Search This Blog

Tuesday, October 23, 2018

Psychometrics

From Wikipedia, the free encyclopedia

Psychometrics is a field of study concerned with the theory and technique of psychological measurement. As defined by the National Council on Measurement in Education (NCME), psychometrics refers to psychological measurement. Generally, it refers to the field in psychology and education that is devoted to testing, measurement, assessment, and related activities.

The field is concerned with the objective measurement of skills and knowledge, abilities, attitudes, personality traits, and educational achievement. Some psychometric researchers focus on the construction and validation of assessment instruments such as questionnaires, tests, raters' judgments, and personality tests. Others focus on research relating to measurement theory (e.g., item response theory; intraclass correlation).

Practitioners are described as psychometricians. Psychometricians usually possess a specific qualification, and most are psychologists with advanced graduate training. In addition to traditional academic institutions, many psychometricians work for the government or in human resources departments. Others specialize as learning and development professionals.

Historical foundation

Psychological testing has come from two streams of thought: the first, from Darwin, Galton, and Cattell on the measurement of individual differences, and the second, from Herbart, Weber, Fechner, and Wundt and their psychophysical measurements of a similar construct. The second set of individuals and their research is what has led to the development of experimental psychology, and standardized testing.

Victorian stream

Charles Darwin was the inspiration behind Sir Francis Galton who led to the creation of psychometrics. In 1859, Darwin published his book "The Origin of Species", which pertained to individual differences in animals. This book discussed how individual members in a species differ and how they possess characteristics that are more adaptive and successful or less adaptive and less successful. Those who are adaptive and successful are the ones that survive and give way to the next generation, who would be just as or more adaptive and successful. This idea, studied previously in animals, led to Galton's interest and study of human beings and how they differ one from another, and more importantly, how to measure those differences.

Galton wrote a book entitled "Hereditary Genius" about different characteristics that people possess and how those characteristics make them more "fit" than others. Today these differences, such as sensory and motor functioning (reaction time, visual acuity, and physical strength) are important domains of scientific psychology. Much of the early theoretical and applied work in psychometrics was undertaken in an attempt to measure intelligence. Galton, often referred to as "the father of psychometrics," devised and included mental tests among his anthropometric measures. James McKeen Cattell, who is considered a pioneer of psychometrics went on to extend Galton's work. Cattell also coined the term mental test, and is responsible for the research and knowledge which ultimately led to the development of modern tests. (Kaplan & Saccuzzo, 2010)

German stream

The origin of psychometrics also has connections to the related field of psychophysics. Around the same time that Darwin, Galton, and Cattell were making their discoveries, Herbart was also interested in "unlocking the mysteries of human consciousness" through the scientific method. (Kaplan & Saccuzzo, 2010) Herbart was responsible for creating mathematical models of the mind, which were influential in educational practices in years to come.

E.H. Weber built upon Herbart's work and tried to prove the existence of a psychological threshold, saying that a minimum stimulus was necessary to activate a sensory system. After Weber, G.T. Fechner expanded upon the knowledge he gleaned from Herbart and Weber, to devise the law that the strength of a sensation grows as the logarithm of the stimulus intensity. A follower of Weber and Fechner, Wilhelm Wundt is credited with founding the science of psychology. It is Wundt's influence that paved the way for others to develop psychological testing.

20th century

The psychometrician L. L. Thurstone, founder and first president of the Psychometric Society in 1936, developed and applied a theoretical approach to measurement referred to as the law of comparative judgment, an approach that has close connections to the psychophysical theory of Ernst Heinrich Weber and Gustav Fechner. In addition, Spearman and Thurstone both made important contributions to the theory and application of factor analysis, a statistical method developed and used extensively in psychometrics. In the late 1950s, Leopold Szondi made an historical and epistemological assessment of the impact of statistical thinking onto psychology during previous few decades: "in the last decades, the specifically psychological thinking has been almost completely suppressed and removed, and replaced by a statistical thinking. Precisely here we see the cancer of testology and testomania of today."

More recently, psychometric theory has been applied in the measurement of personality, attitudes, and beliefs, and academic achievement. Measurement of these unobservable phenomena is difficult, and much of the research and accumulated science in this discipline has been developed in an attempt to properly define and quantify such phenomena. Critics, including practitioners in the physical sciences and social activists, have argued that such definition and quantification is impossibly difficult, and that such measurements are often misused, such as with psychometric personality tests used in employment procedures:
"For example, an employer wanting someone for a role requiring consistent attention to repetitive detail will probably not want to give that job to someone who is very creative and gets bored easily."
Figures who made significant contributions to psychometrics include Karl Pearson, Henry F. Kaiser, Carl Brigham, L. L. Thurstone, Anne Anastasi, Georg Rasch, Eugene Galanter, Johnson O'Connor, Frederic M. Lord, Ledyard R Tucker, Arthur Jensen, and David Andrich.

Definition of measurement in the social sciences

The definition of measurement in the social sciences has a long history. A currently widespread definition, proposed by Stanley Smith Stevens (1946), is that measurement is "the assignment of numerals to objects or events according to some rule." This definition was introduced in the paper in which Stevens proposed four levels of measurement. Although widely adopted, this definition differs in important respects from the more classical definition of measurement adopted in the physical sciences, namely that scientific measurement entails "the estimation or discovery of the ratio of some magnitude of a quantitative attribute to a unit of the same attribute" (p. 358)

Indeed, Stevens's definition of measurement was put forward in response to the British Ferguson Committee, whose chair, A. Ferguson, was a physicist. The committee was appointed in 1932 by the British Association for the Advancement of Science to investigate the possibility of quantitatively estimating sensory events. Although its chair and other members were physicists, the committee also included several psychologists. The committee's report highlighted the importance of the definition of measurement. While Stevens's response was to propose a new definition, which has had considerable influence in the field, this was by no means the only response to the report. Another, notably different, response was to accept the classical definition, as reflected in the following statement:
Measurement in psychology and physics are in no sense different. Physicists can measure when they can find the operations by which they may meet the necessary criteria; psychologists have but to do the same. They need not worry about the mysterious differences between the meaning of measurement in the two sciences. (Reese, 1943, p. 49)
These divergent responses are reflected in alternative approaches to measurement. For example, methods based on covariance matrices are typically employed on the premise that numbers, such as raw scores derived from assessments, are measurements. Such approaches implicitly entail Stevens's definition of measurement, which requires only that numbers are assigned according to some rule. The main research task, then, is generally considered to be the discovery of associations between scores, and of factors posited to underlie such associations.

On the other hand, when measurement models such as the Rasch model are employed, numbers are not assigned based on a rule. Instead, in keeping with Reese's statement above, specific criteria for measurement are stated, and the goal is to construct procedures or operations that provide data that meet the relevant criteria. Measurements are estimated based on the models, and tests are conducted to ascertain whether the relevant criteria have been met.

Instruments and procedures

The firstpsychometric instruments were designed to measure the concept of intelligence. One historical approach involved the Stanford-Binet IQ test, developed originally by the French psychologist Alfred Binet. Intelligence tests are useful tools for various purposes. An alternative conception of intelligence is that cognitive capacities within individuals are a manifestation of a general component, or general intelligence factor, as well as cognitive capacity specific to a given domain.

Psychometrics is applied widely in educational assessment to measure abilities in domains such as reading, writing, and mathematics. The main approaches in applying tests in these domains have been classical test theory and the more recent Item Response Theory and Rasch measurement models. These latter approaches permit joint scaling of persons and assessment items, which provides a basis for mapping of developmental continua by allowing descriptions of the skills displayed at various points along a continuum.

Another major focus in psychometrics has been on personality testing. There have been a range of theoretical approaches to conceptualizing and measuring personality. Some of the better known instruments include the Minnesota Multiphasic Personality Inventory, the Five-Factor Model (or "Big 5") and tools such as Personality and Preference Inventory and the Myers-Briggs Type Indicator. Attitudes have also been studied extensively using psychometric approaches. A common method in the measurement of attitudes is the use of the Likert scale. An alternative method involves the application of unfolding measurement models, the most general being the Hyperbolic Cosine Model (Andrich & Luo, 1993).

Theoretical approaches

Psychometricians have developed a number of different measurement theories. These include classical test theory (CTT) and item response theory (IRT). An approach which seems mathematically to be similar to IRT but also quite distinctive, in terms of its origins and features, is represented by the Rasch model for measurement. The development of the Rasch model, and the broader class of models to which it belongs, was explicitly founded on requirements of measurement in the physical sciences.

Psychometricians have also developed methods for working with large matrices of correlations and covariances. Techniques in this general tradition include: factor analysis, a method of determining the underlying dimensions of data; multidimensional scaling, a method for finding a simple representation for data with a large number of latent dimensions; and data clustering, an approach to finding objects that are like each other. All these multivariate descriptive methods try to distill large amounts of data into simpler structures. More recently, structural equation modeling and path analysis represent more sophisticated approaches to working with large covariance matrices. These methods allow statistically sophisticated models to be fitted to data and tested to determine if they are adequate fits.

One of the main deficiencies in various factor analyses is a lack of consensus in cutting points for determining the number of latent factors. A usual procedure is to stop factoring when eigenvalues drop below one because the original sphere shrinks. The lack of the cutting points concerns other multivariate methods, also.

Key concepts

Key concepts in classical test theory are reliability and validity. A reliable measure is one that measures a construct consistently across time, individuals, and situations. A valid measure is one that measures what it is intended to measure. Reliability is necessary, but not sufficient, for validity.

Both reliability and validity can be assessed statistically. Consistency over repeated measures of the same test can be assessed with the Pearson correlation coefficient, and is often called test-retest reliability. Similarly, the equivalence of different versions of the same measure can be indexed by a Pearson correlation, and is called equivalent forms reliability or a similar term.

Internal consistency, which addresses the homogeneity of a single test form, may be assessed by correlating performance on two halves of a test, which is termed split-half reliability; the value of this Pearson product-moment correlation coefficient for two half-tests is adjusted with the Spearman–Brown prediction formula to correspond to the correlation between two full-length tests. Perhaps the most commonly used index of reliability is Cronbach's α, which is equivalent to the mean of all possible split-half coefficients. Other approaches include the intra-class correlation, which is the ratio of variance of measurements of a given target to the variance of all targets.

There are a number of different forms of validity. Criterion-related validity can be assessed by correlating a measure with a criterion measure theoretically expected to be related. When the criterion measure is collected at the same time as the measure being validated the goal is to establish concurrent validity; when the criterion is collected later the goal is to establish predictive validity. A measure has construct validity if it is related to measures of other constructs as required by theory.  Content validity is a demonstration that the items of a test do an adequate job of covering the domain being measured. In a personnel selection example, test content is based on a defined statement or set of statements of knowledge, skill, ability, or other characteristics obtained from a job analysis.

Item response theory models the relationship between latent traits and responses to test items. Among other advantages, IRT provides a basis for obtaining an estimate of the location of a test-taker on a given latent trait as well as the standard error of measurement of that location. For example, a university student's knowledge of history can be deduced from his or her score on a university test and then be compared reliably with a high school student's knowledge deduced from a less difficult test. Scores derived by classical test theory do not have this characteristic, and assessment of actual ability (rather than ability relative to other test-takers) must be assessed by comparing scores to those of a "norm group" randomly selected from the population. In fact, all measures derived from classical test theory are dependent on the sample tested, while, in principle, those derived from item response theory are not.

Many psychometricians are also concerned with finding and eliminating test bias from their psychological tests. Test bias is a form of systematic (i.e., non-random) error which leads to examinees from one demographic group having an unwarranted advantage over examinees from another demographic group. According to leading experts, test bias may cause differences in average scores across demographic groups, but differences in group scores are not sufficient evidence that test bias is actually present because the test could be measuring real differences among groups. Psychometricians use sophisticated scientific methods to search for test bias and eliminate it. Research shows that it is usually impossible for people reading a test item to accurately determine whether it is biased or not.

Standards of quality

The considerations of validity and reliability typically are viewed as essential elements for determining the quality of any test. However, professional and practitioner associations frequently have placed these concerns within broader contexts when developing standards and making overall judgments about the quality of any test as a whole within a given context. A consideration of concern in many applied research settings is whether or not the metric of a given psychological inventory is meaningful or arbitrary.

Testing standards

In 2014, the American Educational Research Association (AERA), American Psychological Association (APA), and National Council on Measurement in Education (NCME) published a revision of the Standards for Educational and Psychological Testing, which describes standards for test development, evaluation, and use. The Standards cover essential topics in testing including validity, reliability/errors of measurement, and fairness in testing. The book also establishes standards related to testing operations including test design and development, scores, scales, norms, score linking, cut scores, test administration, scoring, reporting, score interpretation, test documentation, and rights and responsibilities of test takers and test users. Finally, the Standards cover topics related to testing applications, including psychological testing and assessment, workplace testing and credentialing, educational testing and assessment, and testing in program evaluation and public policy.

Evaluation standards

In the field of evaluation, and in particular educational evaluation, the Joint Committee on Standards for Educational Evaluation has published three sets of standards for evaluations. The Personnel Evaluation Standards was published in 1988, The Program Evaluation Standards (2nd edition) was published in 1994, and The Student Evaluation Standards was published in 2003.

Each publication presents and elaborates a set of standards for use in a variety of educational settings. The standards provide guidelines for designing, implementing, assessing and improving the identified form of evaluation. Each of the standards has been placed in one of four fundamental categories to promote educational evaluations that are proper, useful, feasible, and accurate. In these sets of standards, validity and reliability considerations are covered under the accuracy topic. For example, the student accuracy standards help ensure that student evaluations will provide sound, accurate, and credible information about student learning and performance.

Non-human: animals and machines

Psychometrics addresses human abilities, attitudes, traits and educational evolution. Notably, the study of behavior, mental processes and abilities of non-human animals is usually addressed by comparative psychology, or with a continuum between non-human animals and the rest of animals by evolutionary psychology. Nonetheless there are some advocators for a more gradual transition between the approach taken for humans and the approach taken for (non-human) animals.

The evaluation of abilities, traits and learning evolution of machines has been mostly unrelated to the case of humans and non-human animals, with specific approaches in the area of artificial intelligence. A more integrated approach, under the name of universal psychometrics, has also been proposed.

Data mining

From Wikipedia, the free encyclopedia

Data mining is the process of discovering patterns in large data sets involving methods at the intersection of machine learning, statistics, and database systems. Data mining is an interdisciplinary subfield of computer science with an overall goal to extract information (with intelligent methods) from a data set and transform the information into a comprehensible structure for further use. Data mining is the analysis step of the "knowledge discovery in databases" process, or KDD. Aside from the raw analysis step, it also involves database and data management aspects, data pre-processing, model and inference considerations, interestingness metrics, complexity considerations, post-processing of discovered structures, visualization, and online updating.

The term "data mining" is in fact a misnomer, because the goal is the extraction of patterns and knowledge from large amounts of data, not the extraction (mining) of data itself. It also is a buzzword and is frequently applied to any form of large-scale data or information processing (collection, extraction, warehousing, analysis, and statistics) as well as any application of computer decision support system, including artificial intelligence (e.g., machine learning) and business intelligence. The book Data mining: Practical machine learning tools and techniques with Java (which covers mostly machine learning material) was originally to be named just Practical machine learning, and the term data mining was only added for marketing reasons. Often the more general terms (large scale) data analysis and analytics – or, when referring to actual methods, artificial intelligence and machine learning – are more appropriate.

The actual data mining task is the semi-automatic or automatic analysis of large quantities of data to extract previously unknown, interesting patterns such as groups of data records (cluster analysis), unusual records (anomaly detection), and dependencies (association rule mining, sequential pattern mining). This usually involves using database techniques such as spatial indices. These patterns can then be seen as a kind of summary of the input data, and may be used in further analysis or, for example, in machine learning and predictive analytics. For example, the data mining step might identify multiple groups in the data, which can then be used to obtain more accurate prediction results by a decision support system. Neither the data collection, data preparation, nor result interpretation and reporting is part of the data mining step, but do belong to the overall KDD process as additional steps.

The related terms data dredging, data fishing, and data snooping refer to the use of data mining methods to sample parts of a larger population data set that are (or may be) too small for reliable statistical inferences to be made about the validity of any patterns discovered. These methods can, however, be used in creating new hypotheses to test against the larger data populations.

Etymology

In the 1960s, statisticians and economists used terms like data fishing or data dredging to refer to what they considered the bad practice of analyzing data without an a-priori hypothesis. The term "data mining" was used in a similarly critical way by economist Michael Lovell in an article published in the Review of Economic Studies 1983. Lovell indicates that the practice "masquerades under a variety of aliases, ranging from "experimentation" (positive) to "fishing" or "snooping" (negative).

The term data mining appeared around 1990 in the database community, generally with positive connotations. For a short time in 1980s, a phrase "database mining"™, was used, but since it was trademarked by HNC, a San Diego-based company, to pitch their Database Mining Workstation; researchers consequently turned to data mining. Other terms used include data archaeology, information harvesting, information discovery, knowledge extraction, etc. Gregory Piatetsky-Shapiro coined the term "knowledge discovery in databases" for the first workshop on the same topic (KDD-1989) and this term became more popular in AI and machine learning community. However, the term data mining became more popular in the business and press communities. Currently, the terms data mining and knowledge discovery are used interchangeably.

In the academic community, the major forums for research started in 1995 when the First International Conference on Data Mining and Knowledge Discovery (KDD-95) was started in Montreal under AAAI sponsorship. It was co-chaired by Usama Fayyad and Ramasamy Uthurusamy. A year later, in 1996, Usama Fayyad launched the journal by Kluwer called Data Mining and Knowledge Discovery as its founding editor-in-chief. Later he started the SIGKDDD Newsletter SIGKDD Explorations. The KDD International conference became the primary highest quality conference in data mining with an acceptance rate of research paper submissions below 18%. The journal Data Mining and Knowledge Discovery is the primary research journal of the field.

Background

The manual extraction of patterns from data has occurred for centuries. Early methods of identifying patterns in data include Bayes' theorem (1700s) and regression analysis (1800s). The proliferation, ubiquity and increasing power of computer technology has dramatically increased data collection, storage, and manipulation ability. As data sets have grown in size and complexity, direct "hands-on" data analysis has increasingly been augmented with indirect, automated data processing, aided by other discoveries in computer science, such as neural networks, cluster analysis, genetic algorithms (1950s), decision trees and decision rules (1960s), and support vector machines (1990s). Data mining is the process of applying these methods with the intention of uncovering hidden patterns in large data sets. It bridges the gap from applied statistics and artificial intelligence (which usually provide the mathematical background) to database management by exploiting the way data is stored and indexed in databases to execute the actual learning and discovery algorithms more efficiently, allowing such methods to be applied to ever larger data sets.

Process

The knowledge discovery in databases (KDD) process is commonly defined with the stages:
  1. Selection
  2. Pre-processing
  3. Transformation
  4. Data mining
  5. Interpretation/evaluation.
It exists, however, in many variations on this theme, such as the Cross Industry Standard Process for Data Mining (CRISP-DM) which defines six phases:
  1. Business understanding
  2. Data understanding
  3. Data preparation
  4. Modeling
  5. Evaluation
  6. Deployment
or a simplified process such as (1) Pre-processing, (2) Data Mining, and (3) Results Validation.
Polls conducted in 2002, 2004, 2007 and 2014 show that the CRISP-DM methodology is the leading methodology used by data miners. The only other data mining standard named in these polls was SEMMA. However, 3–4 times as many people reported using CRISP-DM. Several teams of researchers have published reviews of data mining process models, and Azevedo and Santos conducted a comparison of CRISP-DM and SEMMA in 2008.

Pre-processing

Before data mining algorithms can be used, a target data set must be assembled. As data mining can only uncover patterns actually present in the data, the target data set must be large enough to contain these patterns while remaining concise enough to be mined within an acceptable time limit. A common source for data is a data mart or data warehouse. Pre-processing is essential to analyze the multivariate data sets before data mining. The target set is then cleaned. Data cleaning removes the observations containing noise and those with missing data.

Data mining

Data mining involves six common classes of tasks:
  • Anomaly detection (outlier/change/deviation detection) – The identification of unusual data records, that might be interesting or data errors that require further investigation.
  • Association rule learning (dependency modelling) – Searches for relationships between variables. For example, a supermarket might gather data on customer purchasing habits. Using association rule learning, the supermarket can determine which products are frequently bought together and use this information for marketing purposes. This is sometimes referred to as market basket analysis.
  • Clustering – is the task of discovering groups and structures in the data that are in some way or another "similar", without using known structures in the data.
  • Classification – is the task of generalizing known structure to apply to new data. For example, an e-mail program might attempt to classify an e-mail as "legitimate" or as "spam".
  • Regression – attempts to find a function which models the data with the least error that is, for estimating the relationships among data or datasets.
  • Summarization – providing a more compact representation of the data set, including visualization and report generation.

Results validation

An example of data produced by data dredging through a bot operated by statistician Tyler Vigen, apparently showing a close link between the best word winning a spelling bee competition and the number of people in the United States killed by venomous spiders. The similarity in trends is obviously a coincidence.

Data mining can unintentionally be misused, and can then produce results which appear to be significant; but which do not actually predict future behaviour and cannot be reproduced on a new sample of data and bear little use. Often this results from investigating too many hypotheses and not performing proper statistical hypothesis testing. A simple version of this problem in machine learning is known as overfitting, but the same problem can arise at different phases of the process and thus a train/test split - when applicable at all - may not be sufficient to prevent this from happening.

The final step of knowledge discovery from data is to verify that the patterns produced by the data mining algorithms occur in the wider data set. Not all patterns found by the data mining algorithms are necessarily valid. It is common for the data mining algorithms to find patterns in the training set which are not present in the general data set. This is called overfitting. To overcome this, the evaluation uses a test set of data on which the data mining algorithm was not trained. The learned patterns are applied to this test set, and the resulting output is compared to the desired output. For example, a data mining algorithm trying to distinguish "spam" from "legitimate" emails would be trained on a training set of sample e-mails. Once trained, the learned patterns would be applied to the test set of e-mails on which it had not been trained. The accuracy of the patterns can then be measured from how many e-mails they correctly classify. A number of statistical methods may be used to evaluate the algorithm, such as ROC curves.

If the learned patterns do not meet the desired standards, subsequently it is necessary to re-evaluate and change the pre-processing and data mining steps. If the learned patterns do meet the desired standards, then the final step is to interpret the learned patterns and turn them into knowledge.

Research

The premier professional body in the field is the Association for Computing Machinery's (ACM) Special Interest Group (SIG) on Knowledge Discovery and Data Mining (SIGKDD). Since 1989, this ACM SIG has hosted an annual international conference and published its proceedings, and since 1999 it has published a biannual academic journal titled "SIGKDD Explorations".

Computer science conferences on data mining include:
Data mining topics are also present on many data management/database conferences such as the ICDE Conference, SIGMOD Conference and International Conference on Very Large Data Bases

Standards

There have been some efforts to define standards for the data mining process, for example the 1999 European Cross Industry Standard Process for Data Mining (CRISP-DM 1.0) and the 2004 Java Data Mining standard (JDM 1.0). Development on successors to these processes (CRISP-DM 2.0 and JDM 2.0) was active in 2006, but has stalled since. JDM 2.0 was withdrawn without reaching a final draft.

For exchanging the extracted models – in particular for use in predictive analytics – the key standard is the Predictive Model Markup Language (PMML), which is an XML-based language developed by the Data Mining Group (DMG) and supported as exchange format by many data mining applications. As the name suggests, it only covers prediction models, a particular data mining task of high importance to business applications. However, extensions to cover (for example) subspace clustering have been proposed independently of the DMG.

Notable uses

Data mining is used wherever there is digital data available today. Notable examples of data mining can be found throughout business, medicine, science, and surveillance.

Privacy concerns and ethics

While the term "data mining" itself may have no ethical implications, it is often associated with the mining of information in relation to peoples' behavior (ethical and otherwise).

The ways in which data mining can be used can in some cases and contexts raise questions regarding privacy, legality, and ethics. In particular, data mining government or commercial data sets for national security or law enforcement purposes, such as in the Total Information Awareness Program or in ADVISE, has raised privacy concerns.

Data mining requires data preparation which can uncover information or patterns which may compromise confidentiality and privacy obligations. A common way for this to occur is through data aggregation. Data aggregation involves combining data together (possibly from various sources) in a way that facilitates analysis (but that also might make identification of private, individual-level data deducible or otherwise apparent). This is not data mining per se, but a result of the preparation of data before – and for the purposes of – the analysis. The threat to an individual's privacy comes into play when the data, once compiled, cause the data miner, or anyone who has access to the newly compiled data set, to be able to identify specific individuals, especially when the data were originally anonymous.

It is recommended that an individual is made aware of the following before data are collected:
  • the purpose of the data collection and any (known) data mining projects;
  • how the data will be used;
  • who will be able to mine the data and use the data and their derivatives;
  • the status of security surrounding access to the data;
  • how collected data can be updated.
Data may also be modified so as to become anonymous, so that individuals may not readily be identified. However, even "de-identified"/"anonymized" data sets can potentially contain enough information to allow identification of individuals, as occurred when journalists were able to find several individuals based on a set of search histories that were inadvertently released by AOL.

The inadvertent revelation of personally identifiable information leading to the provider violates Fair Information Practices. This indiscretion can cause financial, emotional, or bodily harm to the indicated individual. In one instance of privacy violation, the patrons of Walgreens filed a lawsuit against the company in 2011 for selling prescription information to data mining companies who in turn provided the data to pharmaceutical companies.

Situation in Europe

Europe has rather strong privacy laws, and efforts are underway to further strengthen the rights of the consumers. However, the U.S.-E.U. Safe Harbor Principles currently effectively expose European users to privacy exploitation by U.S. companies. As a consequence of Edward Snowden's global surveillance disclosure, there has been increased discussion to revoke this agreement, as in particular the data will be fully exposed to the National Security Agency, and attempts to reach an agreement have failed.

Situation in the United States

In the United States, privacy concerns have been addressed by the US Congress via the passage of regulatory controls such as the Health Insurance Portability and Accountability Act (HIPAA). The HIPAA requires individuals to give their "informed consent" regarding information they provide and its intended present and future uses. According to an article in Biotech Business Week, "'[i]n practice, HIPAA may not offer any greater protection than the longstanding regulations in the research arena,' says the AAHC. More importantly, the rule's goal of protection through informed consent is approach a level of incomprehensibility to average individuals." This underscores the necessity for data anonymity in data aggregation and mining practices.

U.S. information privacy legislation such as HIPAA and the Family Educational Rights and Privacy Act (FERPA) applies only to the specific areas that each such law addresses. Use of data mining by the majority of businesses in the U.S. is not controlled by any legislation.

Copyright law

Situation in Europe

Due to a lack of flexibilities in European copyright and database law, the mining of in-copyright works such as web mining without the permission of the copyright owner is not legal. Where a database is pure data in Europe there is likely to be no copyright, but database rights may exist so data mining becomes subject to regulations by the Database Directive. On the recommendation of the Hargreaves review this led to the UK government to amend its copyright law in 2014 to allow content mining as a limitation and exception. Only the second country in the world to do so after Japan, which introduced an exception in 2009 for data mining. However, due to the restriction of the Copyright Directive, the UK exception only allows content mining for non-commercial purposes. UK copyright law also does not allow this provision to be overridden by contractual terms and conditions. The European Commission facilitated stakeholder discussion on text and data mining in 2013, under the title of Licences for Europe. The focus on the solution to this legal issue being licences and not limitations and exceptions led to representatives of universities, researchers, libraries, civil society groups and open access publishers to leave the stakeholder dialogue in May 2013.

Situation in the United States

By contrast to Europe, the flexible nature of US copyright law, and in particular fair use means that content mining in America, as well as other fair use countries such as Israel, Taiwan and South Korea is viewed as being legal. As content mining is transformative, that is it does not supplant the original work, it is viewed as being lawful under fair use. For example, as part of the Google Book settlement the presiding judge on the case ruled that Google's digitisation project of in-copyright books was lawful, in part because of the transformative uses that the digitisation project displayed - one being text and data mining.

Software

Free open-source data mining software and applications

The following applications are available under free/open source licenses. Public access to application source code is also available.
  • Carrot2: Text and search results clustering framework.
  • Chemicalize.org: A chemical structure miner and web search engine.
  • ELKI: A university research project with advanced cluster analysis and outlier detection methods written in the Java language.
  • GATE: a natural language processing and language engineering tool.
  • KNIME: The Konstanz Information Miner, a user friendly and comprehensive data analytics framework.
  • Massive Online Analysis (MOA): a real-time big data stream mining with concept drift tool in the Java programming language.
  • MEPX - cross platform tool for regression and classification problems based on a Genetic Programming variant.
  • ML-Flex: A software package that enables users to integrate with third-party machine-learning packages written in any programming language, execute classification analyses in parallel across multiple computing nodes, and produce HTML reports of classification results.
  • MLPACK library: a collection of ready-to-use machine learning algorithms written in the C++ language.
  • NLTK (Natural Language Toolkit): A suite of libraries and programs for symbolic and statistical natural language processing (NLP) for the Python language.
  • OpenNN: Open neural networks library.
  • Orange: A component-based data mining and machine learning software suite written in the Python language.
  • R: A programming language and software environment for statistical computing, data mining, and graphics. It is part of the GNU Project.
  • scikit-learn is an open source machine learning library for the Python programming language
  • Torch: An open source deep learning library for the Lua programming language and scientific computing framework with wide support for machine learning algorithms.
  • UIMA: The UIMA (Unstructured Information Management Architecture) is a component framework for analyzing unstructured content such as text, audio and video – originally developed by IBM.
  • Weka: A suite of machine learning software applications written in the Java programming language.

Proprietary data-mining software and applications

The following applications are available under proprietary licenses.

Marketplace surveys

Several researchers and organizations have conducted reviews of data mining tools and surveys of data miners. These identify some of the strengths and weaknesses of the software packages. They also provide an overview of the behaviors, preferences and views of data miners. Some of these reports include:
  • Hurwitz Victory Index: Report for Advanced Analytics as a market research assessment tool, it highlights both the diverse uses for advanced analytics technology and the vendors who make those applications possible.Recent-research
  • Rexer Analytics Data Miner Surveys (2007–2015)
  • 2011 Wiley Interdisciplinary Reviews: Data Mining and Knowledge Discovery
  • Forrester Research 2010 Predictive Analytics and Data Mining Solutions report
  • Gartner 2008 "Magic Quadrant" report
  • Robert A. Nisbet's 2006 Three Part Series of articles "Data Mining Tools: Which One is Best For CRM?"
  • Haughton et al.'s 2003 Review of Data Mining Software Packages in The American Statistician
  • Goebel & Gruenwald 1999 "A Survey of Data Mining a Knowledge Discovery Software Tools" in SIGKDD Explorations

The American Economy Is Rigged

And what we can do about it.
By |
The American Economy Is Rigged
Credit: Andrea Ucini
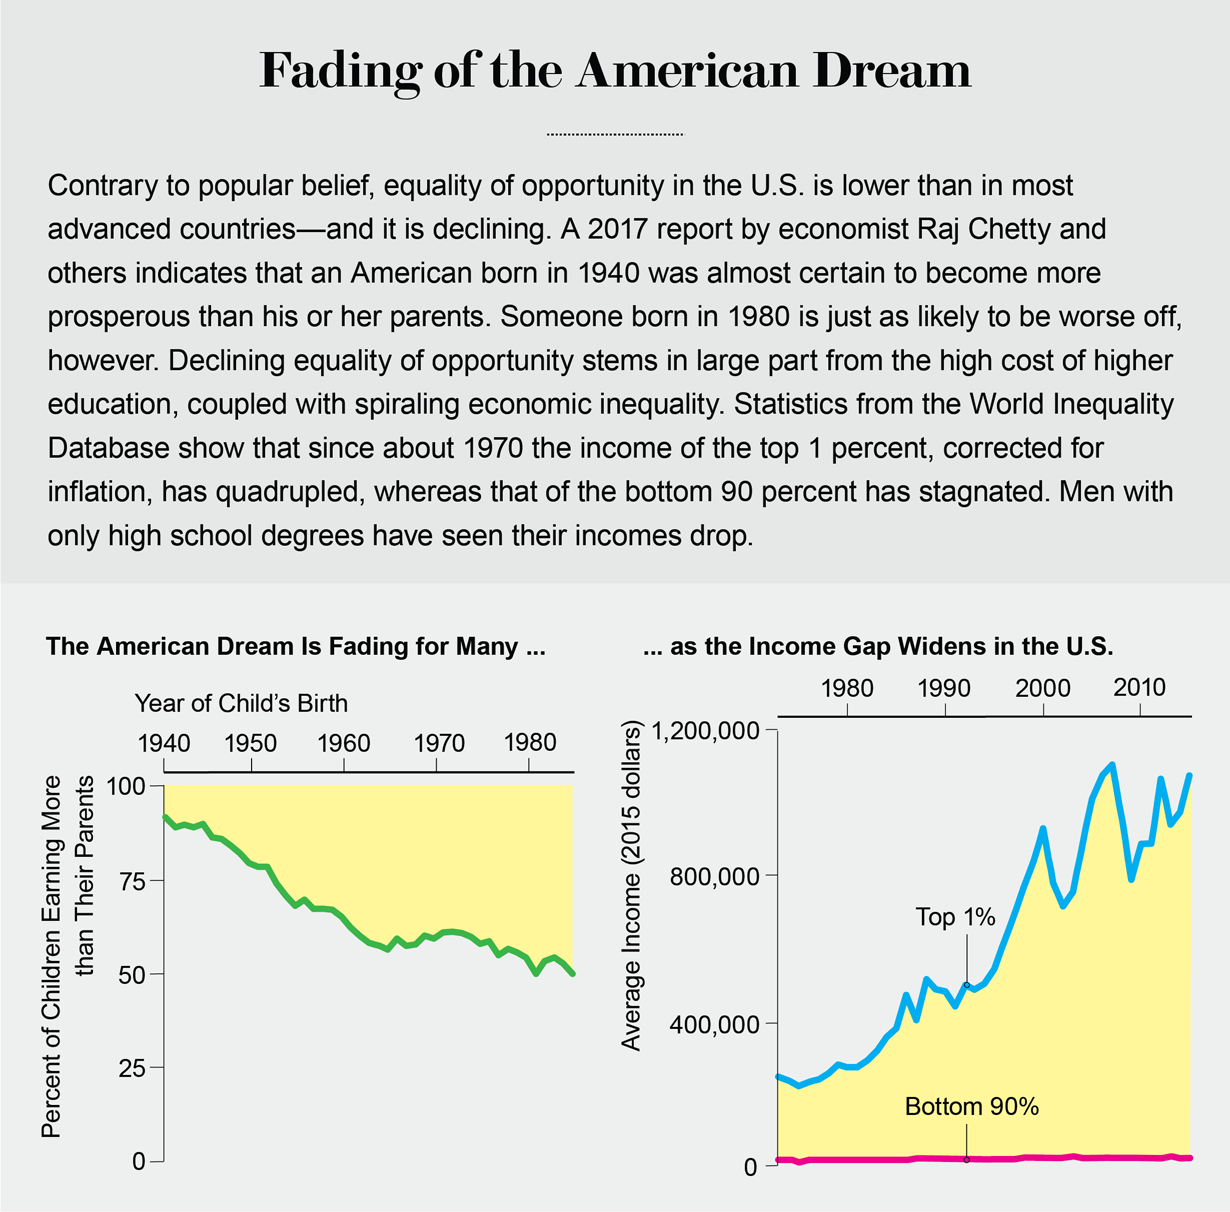
Americans are used to thinking that their nation is special. In many ways, it is: the U.S. has by far the most Nobel Prize winners, the largest defense expenditures (almost equal to the next 10 or so countries put together) and the most billionaires (twice as many as China, the closest competitor). But some examples of American Exceptionalism should not make us proud. By most accounts, the U.S. has the highest level of economic inequality among developed countries. It has the world's greatest per capita health expenditures yet the lowest life expectancy among comparable countries. It is also one of a few developed countries jostling for the dubious distinction of having the lowest measures of equality of opportunity.

The notion of the American Dream—that, unlike old Europe, we are a land of opportunity—is part of our essence. Yet the numbers say otherwise. The life prospects of a young American depend more on the income and education of his or her parents than in almost any other advanced country. When poor-boy-makes-good anecdotes get passed around in the media, that is precisely because such stories are so rare.

Things appear to be getting worse, partly as a result of forces, such as technology and globalization, that seem beyond our control, but most disturbingly because of those within our command. It is not the laws of nature that have led to this dire situation: it is the laws of humankind. Markets do not exist in a vacuum: they are shaped by rules and regulations, which can be designed to favor one group over another. President Donald Trump was right in saying that the system is rigged—by those in the inherited plutocracy of which he himself is a member. And he is making it much, much worse.

America has long outdone others in its level of inequality, but in the past 40 years it has reached new heights. Whereas the income share of the top 0.1 percent has more than quadrupled and that of the top 1 percent has almost doubled, that of the bottom 90 percent has declined. Wages at the bottom, adjusted for inflation, are about the same as they were some 60 years ago! In fact, for those with a high school education or less, incomes have fallen over recent decades. Males have been particularly hard hit, as the U.S. has moved away from manufacturing industries into an economy based on services.

Deaths of Despair

Wealth is even less equally distributed, with just three Americans having as much as the bottom 50 percent—testimony to how much money there is at the top and how little there is at the bottom. Families in the bottom 50 percent hardly have the cash reserves to meet an emergency. Newspapers are replete with stories of those for whom the breakdown of a car or an illness starts a downward spiral from which they never recover.

In significant part because of high inequality [see “The Health-Wealth Gap,” by Robert M. Sapolsky], U.S. life expectancy, exceptionally low to begin with, is experiencing sustained declines. This in spite of the marvels of medical science, many advances of which occur right here in America and which are made readily available to the rich. Economist Ann Case and 2015 Nobel laureate in economics Angus Deaton describe one of the main causes of rising morbidity—the increase in alcoholism, drug overdoses and suicides—as “deaths of despair” by those who have given up hope.
Credit: Jen Christiansen; Sources: “The Fading American Dream: Trends in Absolute Income Mobility Since 1940,” by Raj Chetty et al., in Science, Vol. 356; April 28, 2017 (child-parent wealth comparison); World Inequality database (90% versus 1% wealth trend data)
Defenders of America's inequality have a pat explanation. They refer to the workings of a competitive market, where the laws of supply and demand determine wages, prices and even interest rates—a mechanical system, much like that describing the physical universe. Those with scarce assets or skills are amply rewarded, they argue, because of the larger contributions they make to the economy. What they get merely represents what they have contributed. Often they take out less than they contributed, so what is left over for the rest is that much more.

This fictional narrative may at one time have assuaged the guilt of those at the top and persuaded everyone else to accept this sorry state of affairs. Perhaps the defining moment exposing the lie was the 2008 financial crisis, when the bankers who brought the global economy to the brink of ruin with predatory lending, market manipulation and various other antisocial practices walked away with millions of dollars in bonuses just as millions of Americans lost their jobs and homes and tens of millions more worldwide suffered on their account. Virtually none of these bankers were ever held to account for their misdeeds.

I became aware of the fantastical nature of this narrative as a schoolboy, when I thought of the wealth of the plantation owners, built on the backs of slaves. At the time of the Civil War, the market value of the slaves in the South was approximately half of the region's total wealth, including the value of the land and the physical capital—the factories and equipment. The wealth of at least this part of this nation was not based on industry, innovation and commerce but rather on exploitation. Today we have replaced this open exploitation with more insidious forms, which have intensified since the Reagan-Thatcher revolution of the 1980s. This exploitation, I will argue, is largely to blame for the escalating inequality in the U.S.

After the New Deal of the 1930s, American inequality went into decline. By the 1950s inequality had receded to such an extent that another Nobel laureate in economics, Simon Kuznets, formulated what came to be called Kuznets's law. In the early stages of development, as some parts of a country seize new opportunities, inequalities grow, he postulated; in the later stages, they shrink. The theory long fit the data—but then, around the early 1980s, the trend abruptly reversed.

Explaining Inequality

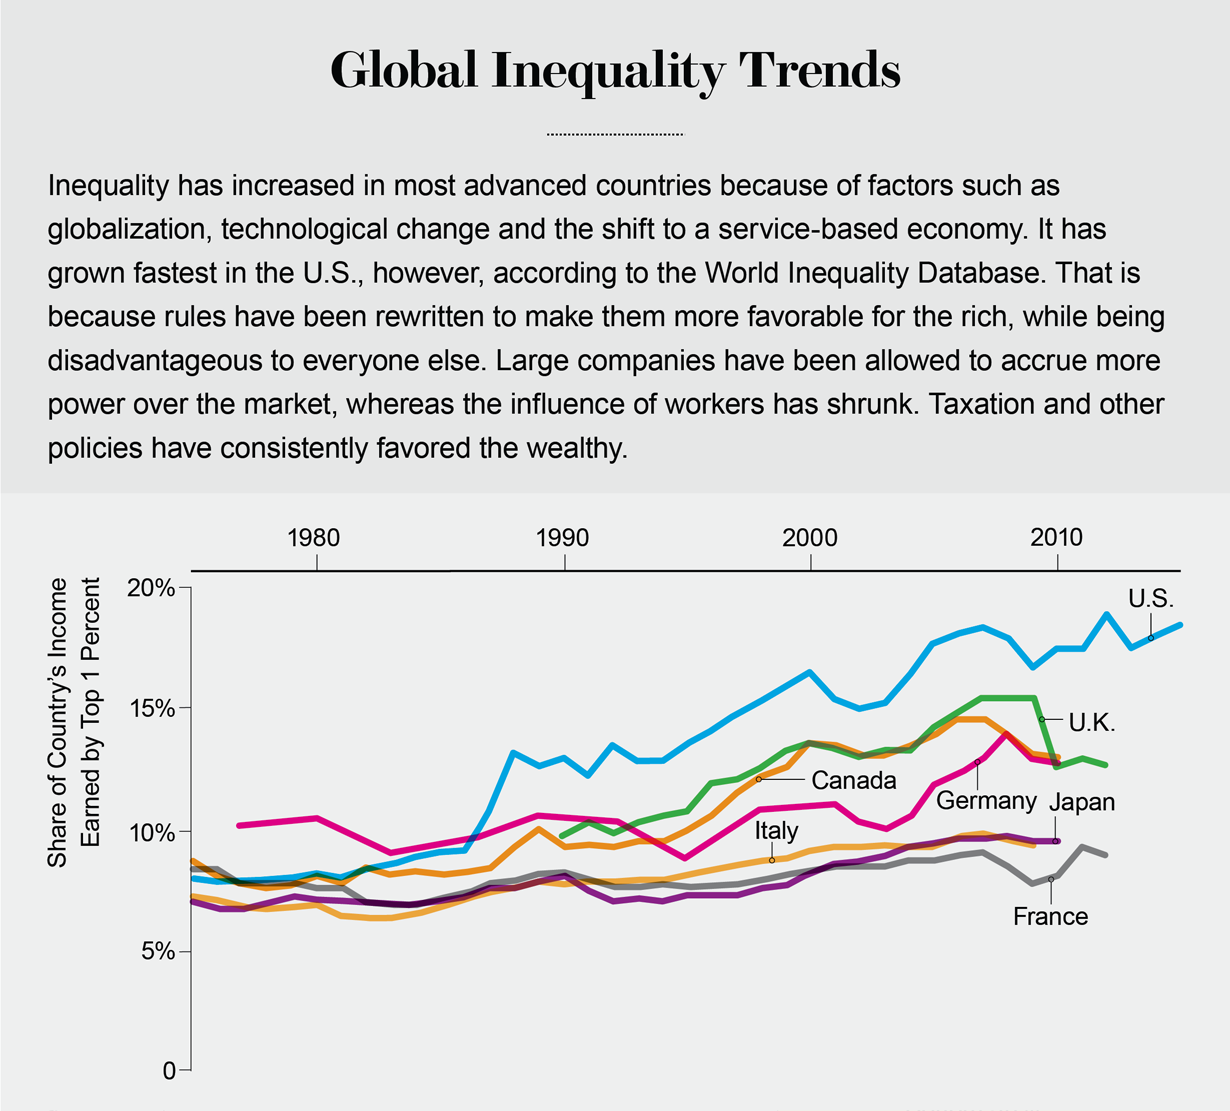
Economists have put forward a range of explanations for why inequality has in fact been increasing in many developed countries. Some argue that advances in technology have spurred the demand for skilled labor relative to unskilled labor, thereby depressing the wages of the latter. Yet that alone cannot explain why even skilled labor has done so poorly over the past two decades, why average wages have done so badly and why matters are so much worse in the U.S. than in other developed nations. Changes in technology are global and should affect all advanced economies in the same way. Other economists blame globalization itself, which has weakened the power of workers. Firms can and do move abroad unless demands for higher wages are curtailed. But again, globalization has been integral to all advanced economies. Why is its impact so much worse in the U.S.?

The shift from a manufacturing to a service-based economy is partly to blame. At its extreme—a firm of one person—the service economy is a winner-takes-all system. A movie star makes millions, for example, whereas most actors make a pittance. Overall, wages are likely to be far more widely dispersed in a service economy than in one based on manufacturing, so the transition contributes to greater inequality. This fact does not explain, however, why the average wage has not improved for decades. Moreover, the shift to the service sector is happening in most other advanced countries: Why are matters so much worse in the U.S.?

Again, because services are often provided locally, firms have more market power: the ability to raise prices above what would prevail in a competitive market. A small town in rural America may have only one authorized Toyota repair shop, which virtually every Toyota owner is forced to patronize. The providers of these local services can raise prices over costs, increasing their profits and the share of income going to owners and managers. This, too, increases inequality. But again, why is U.S. inequality practically unique?

In his celebrated 2013 treatise Capital in the Twenty-First Century, French economist Thomas Piketty shifts the gaze to capitalists. He suggests that the few who own much of a country's capital save so much that, given the stable and high return to capital (relative to the growth rate of the economy), their share of the national income has been increasing. His theory has, however, been questioned on many grounds. For instance, the savings rate of even the rich in the U.S. is so low, compared with the rich in other countries, that the increase in inequality should be lower here, not greater.

An alternative theory is far more consonant with the facts. Since the mid-1970s the rules of the economic game have been rewritten, both globally and nationally, in ways that advantage the rich and disadvantage the rest. And they have been rewritten further in this perverse direction in the U.S. than in other developed countries—even though the rules in the U.S. were already less favorable to workers. From this perspective, increasing inequality is a matter of choice: a consequence of our policies, laws and regulations.

In the U.S., the market power of large corporations, which was greater than in most other advanced countries to begin with, has increased even more than elsewhere. On the other hand, the market power of workers, which started out less than in most other advanced countries, has fallen further than elsewhere. This is not only because of the shift to a service-sector economy—it is because of the rigged rules of the game, rules set in a political system that is itself rigged through gerrymandering, voter suppression and the influence of money. A vicious spiral has formed: economic inequality translates into political inequality, which leads to rules that favor the wealthy, which in turn reinforces economic inequality.

Feedback Loop

Political scientists have documented the ways in which money influences politics in certain political systems, converting higher economic inequality into greater political inequality. Political inequality, in its turn, gives rise to more economic inequality as the rich use their political power to shape the rules of the game in ways that favor them—for instance, by softening antitrust laws and weakening unions. Using mathematical models, economists such as myself have shown that this two-way feedback loop between money and regulations leads to at least two stable points. If an economy starts out with lower inequality, the political system generates rules that sustain it, leading to one equilibrium situation. The American system is the other equilibrium—and will continue to be unless there is a democratic political awakening.

An account of how the rules have been shaped must begin with antitrust laws, first enacted 128 years ago in the U.S. to prevent the agglomeration of market power. Their enforcement has weakened—at a time when, if anything, the laws themselves should have been strengthened. Technological changes have concentrated market power in the hands of a few global players, in part because of so-called network effects: you are far more likely to join a particular social network or use a certain word processor if everyone you know is already using it. Once established, a firm such as Facebook or Microsoft is hard to dislodge. Moreover, fixed costs, such as that of developing a piece of software, have increased as compared with marginal costs—that of duplicating the software. A new entrant has to bear all these fixed costs up front, and if it does enter, the rich incumbent can respond by lowering prices drastically. The cost of making an additional e-book or photo-editing program is essentially zero.

In short, entry is hard and risky, which gives established firms with deep war chests enormous power to crush competitors and ultimately raise prices. Making matters worse, U.S. firms have been innovative not only in the products they make but in thinking of ways to extend and amplify their market power. The European Commission has imposed fines of billions of dollars on Microsoft and Google and ordered them to stop their anticompetitive practices (such as Google privileging its own comparison shopping service). In the U.S., we have done too little to control concentrations of market power, so it is not a surprise that it has increased in many sectors.
Credit: Jen Christiansen; Sources: Economic Report of the President. January 2017; World Inequality database
Rigged rules also explain why the impact of globalization may have been worse in the U.S. A concerted attack on unions has almost halved the fraction of unionized workers in the nation, to about 11 percent. (In Scandinavia, it is roughly 70 percent.) Weaker unions provide workers less protection against the efforts of firms to drive down wages or worsen working conditions. Moreover, U.S. investment treaties such as the North Atlantic Free Trade Agreement—treaties that were sold as a way of preventing foreign countries from discriminating against American firms—also protect investors against a tightening of environmental and health regulations abroad. For instance, they enable corporations to sue nations in private international arbitration panels for passing laws that protect citizens and the environment but threaten the multinational company's bottom line. Firms like these provisions, which enhance the credibility of a company's threat to move abroad if workers do not temper their demands. In short, these investment agreements weaken U.S. workers' bargaining power even further.

Liberated Finance

Many other changes to our norms, laws, rules and regulations have contributed to inequality. Weak corporate governance laws have allowed chief executives in the U.S. to compensate themselves 361 times more than the average worker, far more than in other developed countries. Financial liberalization—the stripping away of regulations designed to prevent the financial sector from imposing harms, such as the 2008 economic crisis, on the rest of society—has enabled the finance industry to grow in size and profitability and has increased its opportunities to exploit everyone else. Banks routinely indulge in practices that are legal but should not be, such as imposing usurious interest rates on borrowers or exorbitant fees on merchants for credit and debit cards and creating securities that are designed to fail. They also frequently do things that are illegal, including market manipulation and insider trading. In all of this, the financial sector has moved money away from ordinary Americans to rich bankers and the banks' shareholders. This redistribution of wealth is an important contributor to American inequality.

Other means of so-called rent extraction—the withdrawal of income from the national pie that is incommensurate with societal contribution—abound. For example, a legal provision enacted in 2003 prohibited the government from negotiating drug prices for Medicare—a gift of some $50 billion a year or more to the pharmaceutical industry. Special favors, such as extractive industries' obtaining public resources such as oil at below fair-market value or banks' getting funds from the Federal Reserve at near-zero interest rates (which they relend at high interest rates), also amount to rent extraction. Further exacerbating inequality is favorable tax treatment for the rich. In the U.S., those at the top pay a smaller fraction of their income in taxes than those who are much poorer—a form of largesse that the Trump administration has just worsened with the 2017 tax bill.

Some economists have argued that we can lessen inequality only by giving up on growth and efficiency. But recent research, such as work done by Jonathan Ostry and others at the International Monetary Fund, suggests that economies with greater equality perform better, with higher growth, better average standards of living and greater stability. Inequality in the extremes observed in the U.S. and in the manner generated there actually damages the economy. The exploitation of market power and the variety of other distortions I have described, for instance, makes markets less efficient, leading to underproduction of valuable goods such as basic research and overproduction of others, such as exploitative financial products.
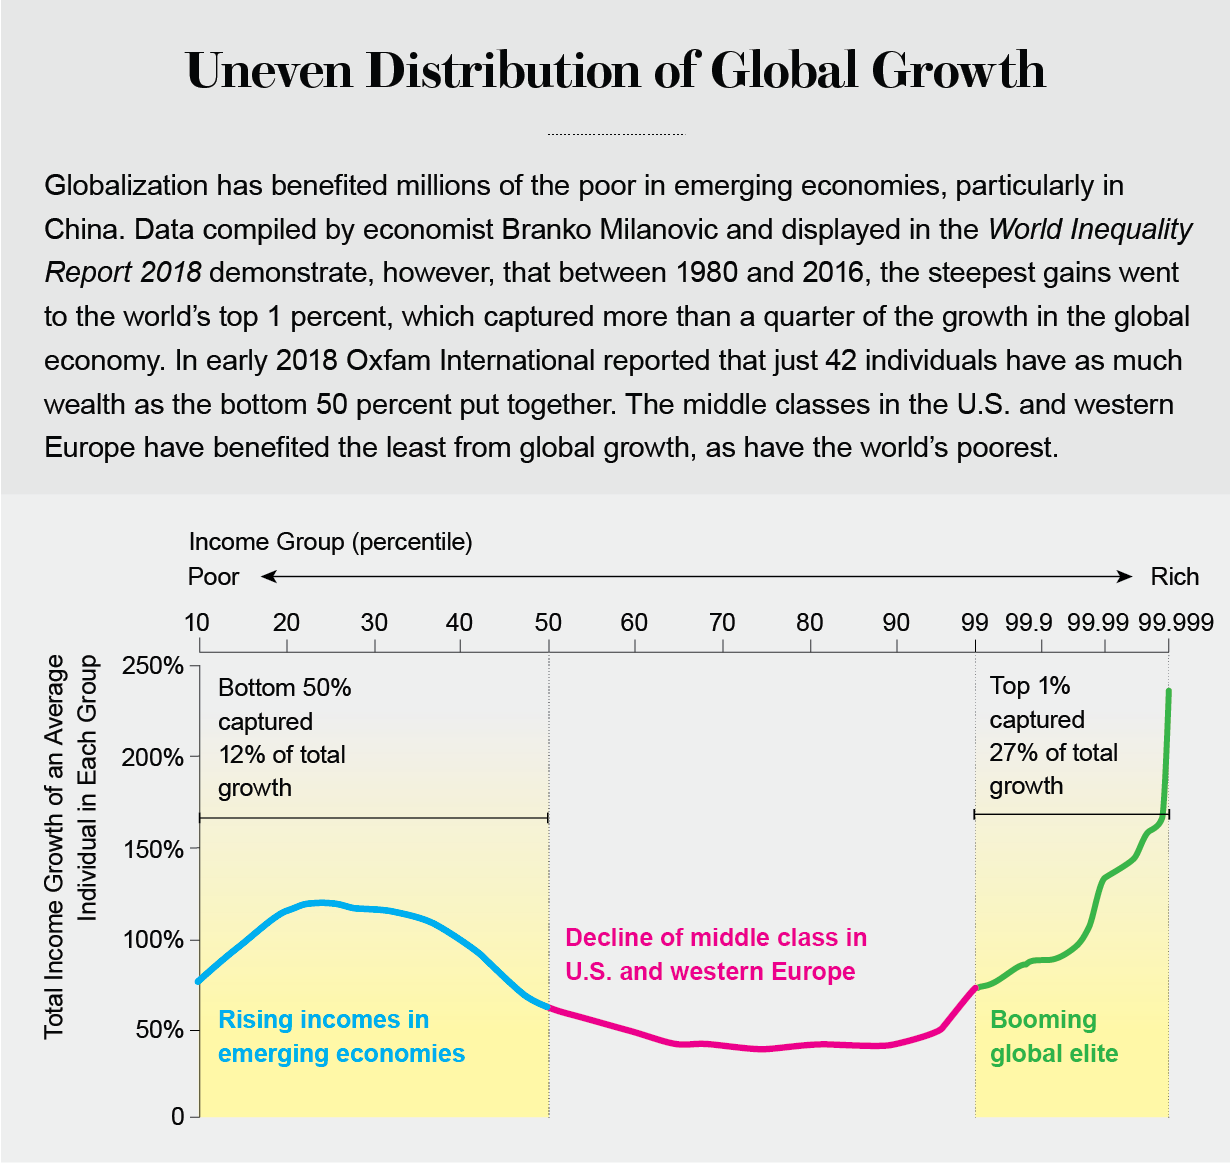
Credit: Jen Christiansen; Sources: World Inequality Report 2018. World Inequality Lab, 2017; Branko Milanovic
Moreover, because the rich typically spend a smaller fraction of their income on consumption than the poor, total or “aggregate” demand in countries with higher inequality is weaker. Societies could make up for this gap by increasing government spending—on infrastructure, education and health, for instance, all of which are investments necessary for long-term growth. But the politics of unequal societies typically puts the burden on monetary policy: interest rates are lowered to stimulate spending. Artificially low interest rates, especially if coupled with inadequate financial market regulation, often give rise to bubbles, which is what happened with the 2008 housing crisis.
It is no surprise that, on average, people living in unequal societies have less equality of opportunity: those at the bottom never get the education that would enable them to live up to their potential. This fact, in turn, exacerbates inequality while wasting the country's most valuable resource: Americans themselves.

Restoring Justice

Morale is lower in unequal societies, especially when inequality is seen as unjust, and the feeling of being used or cheated leads to lower productivity. When those who run gambling casinos or bankers suffering from moral turpitude make a zillion times more than the scientists and inventors who brought us lasers, transistors and an understanding of DNA, it is clear that something is wrong. Then again, the children of the rich come to think of themselves as a class apart, entitled to their good fortune, and accordingly more likely to break the rules necessary for making society function. All of this contributes to a breakdown of trust, with its attendant impact on social cohesion and economic performance.

There is no magic bullet to remedy a problem as deep-rooted as America's inequality. Its origins are largely political, so it is hard to imagine meaningful change without a concerted effort to take money out of politics—through, for instance, campaign finance reform. Blocking the revolving doors by which regulators and other government officials come from and return to the same industries they regulate and work with is also essential.
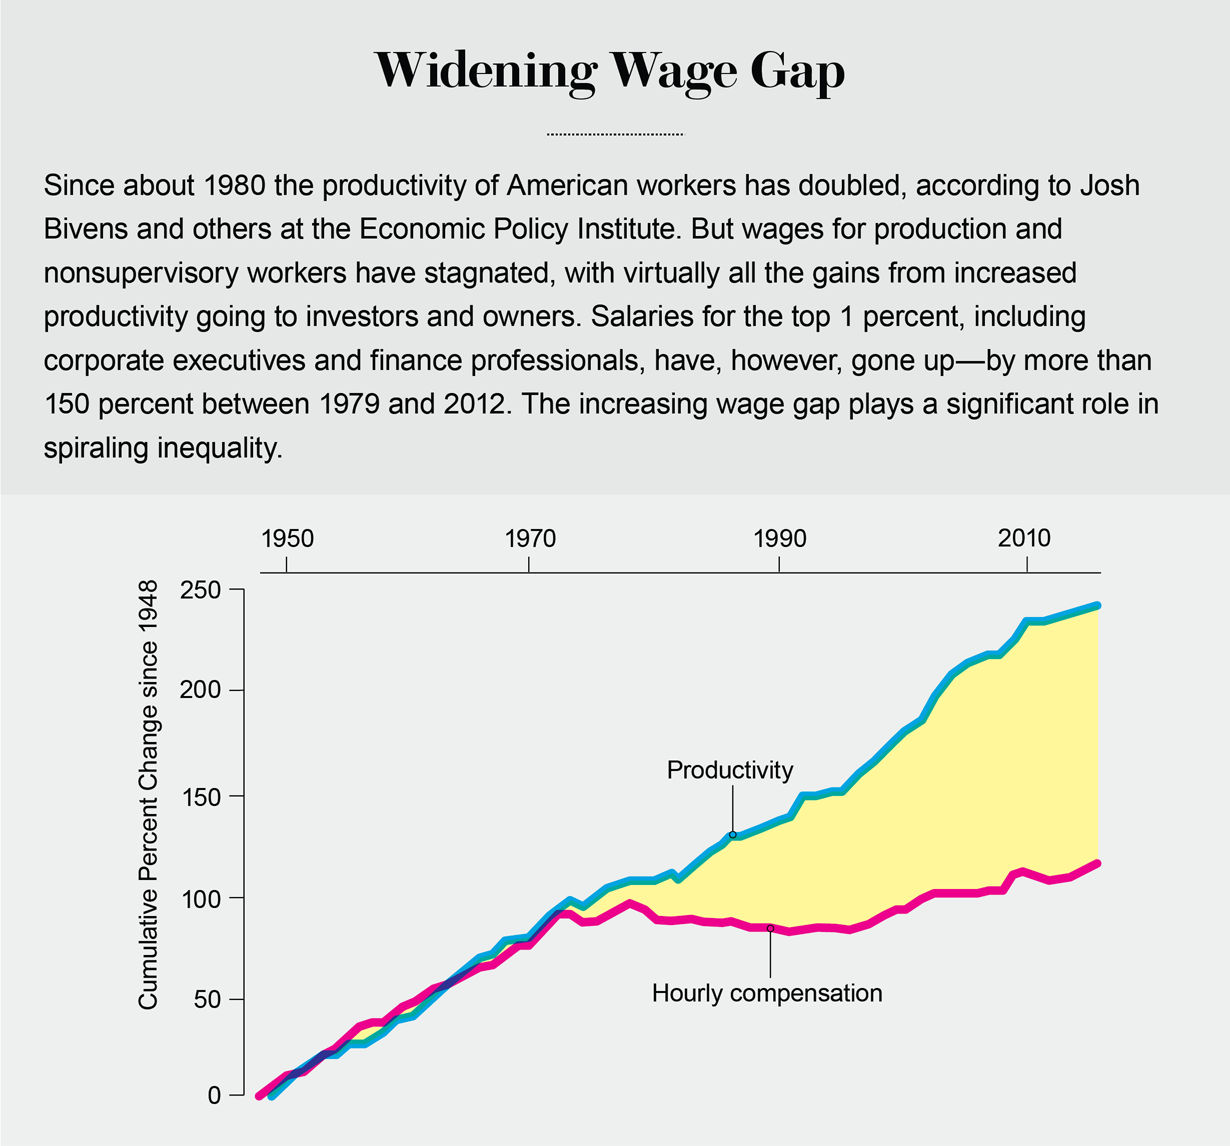
Credit: Jen Christiansen; Sources: Raising America’s Pay: Why It’s Our Central Economic Policy Challenge, by Josh Bivens et al. Economic Policy Institute, June 4, 2014; The State of Working America, by Lawrence Mishel, Josh Bivens, Elise Gould and Heidi Shierholz. 12th Edition. ILR Press, 2012
Beyond that, we need more progressive taxation and high-quality federally funded public education, including affordable access to universities for all, no ruinous loans required. We need modern competition laws to deal with the problems posed by 21st-century market power and stronger enforcement of the laws we do have. We need labor laws that protect workers and their rights to unionize. We need corporate governance laws that curb exorbitant salaries bestowed on chief executives, and we need stronger financial regulations that will prevent banks from engaging in the exploitative practices that have become their hallmark. We need better enforcement of antidiscrimination laws: it is unconscionable that women and minorities get paid a mere fraction of what their white male counterparts receive. We also need more sensible inheritance laws that will reduce the intergenerational transmission of advantage and disadvantage.

The basic perquisites of a middle-class life, including a secure old age, are no longer attainable for most Americans. We need to guarantee access to health care. We need to strengthen and reform retirement programs, which have put an increasing burden of risk management on workers (who are expected to manage their portfolios to guard simultaneously against the risks of inflation and market collapse) and opened them up to exploitation by our financial sector (which sells them products designed to maximize bank fees rather than retirement security). Our mortgage system was our Achilles' heel, and we have not really fixed it. With such a large fraction of Americans living in cities, we have to have urban housing policies that ensure affordable housing for all.

It is a long agenda—but a doable one. When skeptics say it is nice but not affordable, I reply: We cannot afford to not do these things. We are already paying a high price for inequality, but it is just a down payment on what we will have to pay if we do not do something—and quickly. It is not just our economy that is at stake; we are risking our democracy.

As more of our citizens come to understand why the fruits of economic progress have been so unequally shared, there is a real danger that they will become open to a demagogue blaming the country's problems on others and making false promises of rectifying “a rigged system.” We are already experiencing a foretaste of what might happen. It could get much worse.

This article was originally published with the title "A Rigged Economy"

MORE TO EXPLORE

The Price of Inequality: How Today's Divided Society Endangers Our Future. Joseph E. Stiglitz. W. W. Norton, 2012.

The Great Divide: Unequal Societies and What We Can Do about Them. Joseph E. Stiglitz. W. W. Norton, 2015.

Rewriting the Rules of the American Economy: An Agenda for Growth and Shared Prosperity. Joseph E. Stiglitz. W. W. Norton, 2015.

Globalization and Its Discontents Revisited: Anti-globalization in the Era of Trump. Joseph E. Stiglitz. W. W. Norton, 2017.

Algorithmic information theory

From Wikipedia, the free encyclopedia https://en.wikipedia.org/wiki/Algorithmic_information_theory ...