Thermal expansion is the tendency of matter to change its shape, area, volume, and density in response to a change in temperature, usually not including phase transitions.
Temperature is a monotonic function of the average molecular kinetic energy of a substance. When a substance is heated, molecules begin to vibrate and move more, usually creating more distance between themselves. Substances which contract with increasing temperature are unusual, and only occur within limited temperature ranges (see examples below). The relative expansion (also called strain) divided by the change in temperature is called the material's coefficient of linear thermal expansion and generally varies with temperature. As energy in particles increases, they start moving faster and faster weakening the intermolecular forces between them, therefore expanding the substance.
Overview
Predicting expansion
If an equation of state is available, it can be used to predict the values of the thermal expansion at all the required temperatures and pressures, along with many other state functions.
Contraction effects (negative thermal expansion)
A number of materials contract on heating within certain temperature ranges; this is usually called negative thermal expansion, rather than "thermal contraction". For example, the coefficient of thermal expansion of water drops to zero as it is cooled to 3.983 °C and then becomes negative below this temperature; this means that water has a maximum density at this temperature, and this leads to bodies of water maintaining this temperature at their lower depths during extended periods of sub-zero weather. Also, fairly pure silicon has a negative coefficient of thermal expansion for temperatures between about 18 and 120 kelvin.
Factors affecting thermal expansion
Unlike gases or liquids, solid materials tend to keep their shape when undergoing thermal expansion.
Thermal expansion generally decreases with increasing bond energy, which also has an effect on the melting point of solids, so, high melting point materials are more likely to have lower thermal expansion. In general, liquids expand slightly more than solids. The thermal expansion of glasses is higher compared to that of crystals. At the glass transition temperature, rearrangements that occur in an amorphous material lead to characteristic discontinuities of coefficient of thermal expansion and specific heat. These discontinuities allow detection of the glass transition temperature where a supercooled liquid transforms to a glass.
Absorption or desorption of water (or other solvents) can change the size of many common materials; many organic materials change size much more due to this effect than due to thermal expansion. Common plastics exposed to water can, in the long term, expand by many percent.
Effect on density
Thermal expansion changes the space between particles of a substance, which changes the volume of the substance while negligibly changing its mass (the negligible amount comes from energy-mass equivalence), thus changing its density, which has an effect on any buoyant forces acting on it. This plays a crucial role in convection of unevenly heated fluid masses, notably making thermal expansion partly responsible for wind and ocean currents.
Coefficient of thermal expansion
The coefficient of thermal expansion describes how the size of an object changes with a change in temperature. Specifically, it measures the fractional change in size per degree change in temperature at a constant pressure, such that lower coefficients describe lower propensity for change in size. Several types of coefficients have been developed: volumetric, area, and linear. The choice of coefficient depends on the particular application and which dimensions are considered important. For solids, one might only be concerned with the change along a length, or over some area.
The volumetric thermal expansion coefficient is the most basic thermal expansion coefficient, and the most relevant for fluids. In general, substances expand or contract when their temperature changes, with expansion or contraction occurring in all directions. Substances that expand at the same rate in every direction are called isotropic. For isotropic materials, the area and volumetric thermal expansion coefficient are, respectively, approximately twice and three times larger than the linear thermal expansion coefficient.
Mathematical definitions of these coefficients are defined below for solids, liquids, and gases.
General thermal expansion coefficient
In the general case of a gas, liquid, or solid, the volumetric coefficient of thermal expansion is given by
The subscript "p" to the derivative indicates that the pressure is held constant during the expansion, and the subscript V stresses that it is the volumetric (not linear) expansion that enters this general definition. In the case of a gas, the fact that the pressure is held constant is important, because the volume of a gas will vary appreciably with pressure as well as temperature. For a gas of low density this can be seen from the ideal gas
Expansion in solids
When calculating thermal expansion it is necessary to consider whether the body is free to expand or is constrained. If the body is free to expand, the expansion or strain resulting from an increase in temperature can be simply calculated by using the applicable coefficient of Thermal Expansion.
If the body is constrained so that it cannot expand, then internal stress will be caused (or changed) by a change in temperature. This stress can be calculated by considering the strain that would occur if the body were free to expand and the stress required to reduce that strain to zero, through the stress/strain relationship characterised by the elastic or Young's modulus. In the special case of solid materials, external ambient pressure does not usually appreciably affect the size of an object and so it is not usually necessary to consider the effect of pressure changes.
Common engineering solids usually have coefficients of thermal expansion that do not vary significantly over the range of temperatures where they are designed to be used, so where extremely high accuracy is not required, practical calculations can be based on a constant, average, value of the coefficient of expansion.
Linear expansion
Linear expansion means change in one dimension (length) as opposed to change in volume (volumetric expansion). To a first approximation, the change in length measurements of an object due to thermal expansion is related to temperature change by a coefficient of linear thermal expansion (CLTE). It is the fractional change in length per degree of temperature change. Assuming negligible effect of pressure, we may write:
where is a particular length measurement and is the rate of change of that linear dimension per unit change in temperature.
The change in the linear dimension can be estimated to be:
This estimation works well as long as the linear-expansion coefficient does not change much over the change in temperature , and the fractional change in length is small . If either of these conditions does not hold, the exact differential equation (using ) must be integrated.
Effects on strain
For solid materials with a significant length, like rods or cables, an estimate of the amount of thermal expansion can be described by the material strain, given by and defined as:
where is the length before the change of temperature and is the length after the change of temperature.
For most solids, thermal expansion is proportional to the change in temperature:
Thus, the change in either the strain or temperature can be estimated by:
where
is the difference of the temperature between the two recorded strains, measured in degrees Fahrenheit, degrees Rankine, degrees Celsius, or kelvin, and is the linear coefficient of thermal expansion in "per degree Fahrenheit", "per degree Rankine", “per degree Celsius”, or “per kelvin”, denoted by °F−1, R−1, °C−1, or K−1, respectively. In the field of continuum mechanics, the thermal expansion and its effects are treated as eigenstrain and eigenstress.
Area expansion
The area thermal expansion coefficient relates the change in a material's area dimensions to a change in temperature. It is the fractional change in area per degree of temperature change. Ignoring pressure, we may write:
where is some area of interest on the object, and is the rate of change of that area per unit change in temperature.
The change in the area can be estimated as:
This equation works well as long as the area expansion coefficient does not change much over the change in temperature , and the fractional change in area is small . If either of these conditions does not hold, the equation must be integrated.
Volume expansion
For a solid, we can ignore the effects of pressure on the material, and the volumetric thermal expansion coefficient can be written:
where is the volume of the material, and is the rate of change of that volume with temperature.
This means that the volume of a material changes by some fixed fractional amount. For example, a steel block with a volume of 1 cubic meter might expand to 1.002 cubic meters when the temperature is raised by 50 K. This is an expansion of 0.2%. If we had a block of steel with a volume of 2 cubic meters, then under the same conditions, it would expand to 2.004 cubic meters, again an expansion of 0.2%. The volumetric expansion coefficient would be 0.2% for 50 K, or 0.004% K−1.
If we already know the expansion coefficient, then we can calculate the change in volume
where is the fractional change in volume (e.g., 0.002) and is the change in temperature (50 °C).
The above example assumes that the expansion coefficient did not change as the temperature changed and the increase in volume is small compared to the original volume. This is not always true, but for small changes in temperature, it is a good approximation. If the volumetric expansion coefficient does change appreciably with temperature, or the increase in volume is significant, then the above equation will have to be integrated:
where is the volumetric expansion coefficient as a function of temperature T, and , are the initial and final temperatures respectively.
Isotropic materials
For isotropic materials the volumetric thermal expansion coefficient is three times the linear coefficient:
This ratio arises because volume is composed of three mutually orthogonal directions. Thus, in an isotropic material, for small differential changes, one-third of the volumetric expansion is in a single axis. As an example, take a cube of steel that has sides of length L. The original volume will be and the new volume, after a temperature increase, will be
We can easily ignore the terms as change in L is a small quantity which on squaring gets much smaller.
So
The above approximation holds for small temperature and dimensional changes (that is, when and are small); but it does not hold if we are trying to go back and forth between volumetric and linear coefficients using larger values of . In this case, the third term (and sometimes even the fourth term) in the expression above must be taken into account.
Similarly, the area thermal expansion coefficient is two times the linear coefficient:
This ratio can be found in a way similar to that in the linear example above, noting that the area of a face on the cube is just . Also, the same considerations must be made when dealing with large values of .
Put more simply, if the length of a solid expands from 1 m to 1.01 m then the area expands from 1 m2 to 1.0201 m2 and the volume expands from 1 m3 to 1.030301 m3.
Anisotropic materials
Materials with anisotropic structures, such as crystals (with less than cubic symmetry, for example martensitic phases) and many composites, will generally have different linear expansion coefficients in different directions. As a result, the total volumetric expansion is distributed unequally among the three axes. If the crystal symmetry is monoclinic or triclinic, even the angles between these axes are subject to thermal changes. In such cases it is necessary to treat the coefficient of thermal expansion as a tensor with up to six independent elements. A good way to determine the elements of the tensor is to study the expansion by x-ray powder diffraction. The thermal expansion coefficient tensor for the materials possessing cubic symmetry (for e.g. FCC, BCC) is isotropic.
Isobaric expansion in gases
For an ideal gas, the volumetric thermal expansion (i.e., relative change in volume due to temperature change) depends on the type of process in which temperature is changed. Two simple cases are constant pressure (an isobaric process) and constant volume (an isochoric process).
The derivative of the ideal gas law, , is
where is the pressure, is the specific volume, and is temperature measured in energy units.
By the definition of an isobaric thermal expansion, we have , so that , and the isobaric thermal expansion coefficient is:
- .
Similarly, if the volume is held constant, that is if , we have , so that the isochoric thermal expansion coefficient is
- .
Expansion in liquids
Theoretically, the coefficient of linear expansion can be found from the coefficient of volumetric expansion (αV ≈ 3αL). For liquids, αL is calculated through the experimental determination of αV. Liquids, unlike solids have no definite shape and they take the shape of the container. Consequently, liquids have no definite length and area, so linear and areal expansions of liquids have no significance.
Liquids in general, expand on heating. However water is an exception to this general behaviour: below 4 °C it contracts on heating. For higher temperature it shows the normal positive thermal expansion. The thermal expansion of liquids is usually higher than in solids because of weak intermolecular forces present in liquids.
Thermal expansion of solids usually shows little dependence on temperature, except at low temperatures, whereas liquids expand at different rates at different temperatures.
Apparent and absolute expansion of a liquid
The expansion of liquids is usually measured in a container. When a liquid expands in a vessel, the vessel expands along with the liquid. Hence the observed increase in volume of the liquid level is not actual increase in its volume. The expansion of the liquid relative to the container is called its apparent expansion, while the actual expansion of the liquid is called real expansion or absolute expansion. The ratio of apparent increase in volume of the liquid per unit rise of temperature to the original volume is called its coefficient of apparent expansion.
For small and equal rises in temperature, the increase in volume (real expansion) of a liquid is equal to the sum of the apparent increase in volume (apparent expansion) of the liquid and the increase in volume of the containing vessel. Thus a liquid has two coefficients of expansion.
Measurement of the expansion of a liquid must account for the expansion of the container as well. For example, when a flask with a long narrow stem, containing enough liquid to partially fill the stem itself, is placed in a heat bath, the height of the liquid column in the stem will initially drop, followed immediately by a rise of that height until the whole system of flask, liquid and heat bath has warmed through. The initial drop in the height of the liquid column is not due to an initial contraction of the liquid, but rather to the expansion of the flask as it contacts the heat bath first. Soon after, the liquid in the flask is heated by the flask itself and begins to expand. Since liquids typically have a greater expansion over solids, the expansion of the liquid in the flask eventually exceeds that of the flask, causing the level of liquid in the flask to rise. A direct measurement of the height of the liquid column is a measurement of the apparent expansion of the liquid. The absolute expansion of the liquid is the apparent expansion corrected for the expansion of the containing vessel.
Examples and applications
The expansion and contraction of the materials must be considered when designing large structures, when using tape or chain to measure distances for land surveys, when designing molds for casting hot material, and in other engineering applications when large changes in dimension due to temperature are expected.
Thermal expansion is also used in mechanical applications to fit parts over one another, e.g. a bushing can be fitted over a shaft by making its inner diameter slightly smaller than the diameter of the shaft, then heating it until it fits over the shaft, and allowing it to cool after it has been pushed over the shaft, thus achieving a 'shrink fit'. Induction shrink fitting is a common industrial method to pre-heat metal components between 150 °C and 300 °C thereby causing them to expand and allow for the insertion or removal of another component.
There exist some alloys with a very small linear expansion coefficient, used in applications that demand very small changes in physical dimension over a range of temperatures. One of these is Invar 36, with expansion approximately equal to 0.6×10⁻⁶ K−1. These alloys are useful in aerospace applications where wide temperature swings may occur.
Pullinger's apparatus is used to determine the linear expansion of a metallic rod in the laboratory. The apparatus consists of a metal cylinder closed at both ends (called a steam jacket). It is provided with an inlet and outlet for the steam. The steam for heating the rod is supplied by a boiler which is connected by a rubber tube to the inlet. The center of the cylinder contains a hole to insert a thermometer. The rod under investigation is enclosed in a steam jacket. One of its ends is free, but the other end is pressed against a fixed screw. The position of the rod is determined by a micrometer screw gauge or spherometer.
To determine the coefficient of linear thermal expansion of a metal, a pipe made of that metal is heated by passing steam through it. One end of the pipe is fixed securely and the other rests on a rotating shaft, the motion of which is indicated by a pointer. A suitable thermometer records the pipe's temperature. This enables calculation of the relative change in length per degree temperature change.
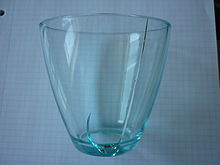
The control of thermal expansion in brittle materials is a key concern for a wide range of reasons. For example, both glass and ceramics are brittle and uneven temperature causes uneven expansion which again causes thermal stress and this might lead to fracture. Ceramics need to be joined or work in concert with a wide range of materials and therefore their expansion must be matched to the application. Because glazes need to be firmly attached to the underlying porcelain (or other body type) their thermal expansion must be tuned to 'fit' the body so that crazing or shivering do not occur. Good example of products whose thermal expansion is the key to their success are CorningWare and the spark plug. The thermal expansion of ceramic bodies can be controlled by firing to create crystalline species that will influence the overall expansion of the material in the desired direction. In addition or instead the formulation of the body can employ materials delivering particles of the desired expansion to the matrix. The thermal expansion of glazes is controlled by their chemical composition and the firing schedule to which they were subjected. In most cases there are complex issues involved in controlling body and glaze expansion, so that adjusting for thermal expansion must be done with an eye to other properties that will be affected, and generally trade-offs are necessary.
Thermal expansion can have a noticeable effect on gasoline stored in above-ground storage tanks, which can cause gasoline pumps to dispense gasoline which may be more compressed than gasoline held in underground storage tanks in winter, or less compressed than gasoline held in underground storage tanks in summer.
Heat-induced expansion has to be taken into account in most areas of engineering. A few examples are:
- Metal-framed windows need rubber spacers.
- Rubber tires need to perform well over a range of temperatures, being passively heated or cooled by road surfaces and weather, and actively heated by mechanical flexing and friction.
- Metal hot water heating pipes should not be used in long straight lengths.
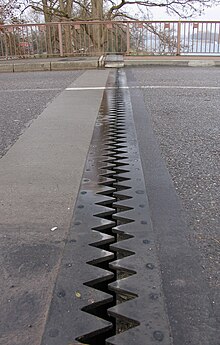
- Large structures such as railways and bridges need expansion joints in the structures to avoid sun kink.
- One of the reasons for the poor performance of cold car engines is that parts have inefficiently large spacings until the normal operating temperature is achieved.
- A gridiron pendulum uses an arrangement of different metals to maintain a more temperature stable pendulum length.
- A power line on a hot day is droopy, but on a cold day it is tight. This is because the metals expand under heat.
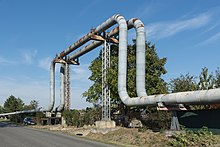
- Expansion joints absorb the thermal expansion in a piping system.
- Precision engineering nearly always requires the engineer to pay attention to the thermal expansion of the product. For example, when using a scanning electron microscope small changes in temperature such as 1 degree can cause a sample to change its position relative to the focus point.
- Liquid thermometers contain a liquid (usually mercury or alcohol) in a tube, which constrains it to flow in only one direction when its volume expands due to changes in temperature.
- A bi-metal mechanical thermometer uses a bimetallic strip and bends due to the differing thermal expansion of the two metals.
Thermal expansion coefficients for various materials
This section summarizes the coefficients for some common materials.
For isotropic materials the coefficients linear thermal expansion α and volumetric thermal expansion αV are related by αV = 3α. For liquids usually the coefficient of volumetric expansion is listed and linear expansion is calculated here for comparison.
For common materials like many metals and compounds, the thermal expansion coefficient is inversely proportional to the melting point. In particular, for metals the relation is:
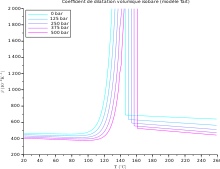
In the table below, the range for α is from 10−7 K−1 for hard solids to 10−3 K−1 for organic liquids. The coefficient α varies with the temperature and some materials have a very high variation; see for example the variation vs. temperature of the volumetric coefficient for a semicrystalline polypropylene (PP) at different pressure, and the variation of the linear coefficient vs. temperature for some steel grades (from bottom to top: ferritic stainless steel, martensitic stainless steel, carbon steel, duplex stainless steel, austenitic steel). The highest linear coefficient in a solid has been reported for a Ti-Nb alloy.
(The formula αV ≈ 3α is usually used for solids.)
| Material | Linear coefficient CLTE α at 20 °C (x10−6 K−1) |
Volumetric coefficient αV at 20 °C (x10−6 K−1) |
Notes |
|---|---|---|---|
| Aluminium | 23.1 | 69 |
|
| Brass | 19 | 57 |
|
| Carbon steel | 10.8 | 32.4 |
|
| CFRP | – 0.8 | Anisotropic | Fiber direction |
| Concrete | 12 | 36 |
|
| Copper | 17 | 51 |
|
| Diamond | 1 | 3 |
|
| Ethanol | 250 | 750 |
|
| Gasoline | 317 | 950 |
|
| Glass | 8.5 | 25.5 |
|
| Glass, borosilicate | 3.3 | 9.9 | matched sealing partner for tungsten, molybdenum and kovar. |
| Glycerine |
|
485 |
|
| Gold | 14 | 42 |
|
| Ice | 51 |
|
|
| Invar | 1.2 | 3.6 |
|
| Iron | 11.8 | 35.4 |
|
| Kapton | 20 | 60 | DuPont Kapton 200EN |
| Lead | 29 | 87 |
|
| Macor | 9.3 |
| |
| Nickel | 13 | 39 |
|
| Oak | 54 |
|
Perpendicular to the grain |
| Douglas-fir | 27 | 75 | radial |
| Douglas-fir | 45 | 75 | tangential |
| Douglas-fir | 3.5 | 75 | parallel to grain |
| Platinum | 9 | 27 |
|
| Polypropylene (PP) | 150 | 450 |
|
| PVC | 52 | 156 |
|
| Fused quartz | 0.59 | 1.77 |
|
| alpha-Quartz | 12-16/6-9 |
|
Parallel to a-axis/c-axis T = -50 to 150 C |
| Rubber | disputed | disputed |
|
| Sapphire | 5.3 |
|
Parallel to C axis, or [001] |
| Silicon Carbide | 2.77 | 8.31 |
|
| Silicon | 2.56 | 9 |
|
| Silver | 18 | 54 |
|
| Glass-ceramic "Sitall" | 0±0.15 | 0±0.45 | average for −60 °C to 60 °C |
| Stainless steel | 10.1 ~ 17.3 | 30.3 ~ 51.9 |
|
| Steel | 11.0 ~ 13.0 | 33.0 ~ 39.0 | Depends on composition |
| Titanium | 8.6 | 26 |
|
| Tungsten | 4.5 | 13.5 |
|
| Water | 69 | 207 |
|
| Glass-ceramic "Zerodur" | ≈0.007-0.1 |
|
at 0...50 °C |
| ALLVAR Alloy 30 | −30 | anisotropic | at 20 °C |







![{\displaystyle {\ce {CO2{}+4H2->[{} \atop 400\ ^{\circ }{\ce {C}}][{\ce {pressure}}]CH4{}+2H2O}}}](https://wikimedia.org/api/rest_v1/media/math/render/svg/ceb1bbee6cc36730e26a3890a998c2d73e4ef9d8)

![{\displaystyle {\ce {CH4->[{\text{heat}}]C{}+2H2}}}](https://wikimedia.org/api/rest_v1/media/math/render/svg/b5f8fe0242166a3eccbb23bb6d026311cb75d856)
![{\displaystyle {\ce {2CH4->[{\text{heat}}]C2H2{}+3H2}}}](https://wikimedia.org/api/rest_v1/media/math/render/svg/84504118c8c5ab21b990e7ddaa54e4fe7f283293)


