Search This Blog

Thursday, September 28, 2023

Ultrafast laser spectroscopy

From Wikipedia, the free encyclopedia

Ultrafast laser spectroscopy is a spectroscopic technique that uses ultrashort pulse lasers for the study of dynamics on extremely short time scales (attoseconds to nanoseconds). Different methods are used to examine the dynamics of charge carriers, atoms, and molecules. Many different procedures have been developed spanning different time scales and photon energy ranges; some common methods are listed below.

Attosecond-to-picosecond spectroscopy

Dynamics on the as to fs time scale are in general too fast to be measured electronically. Most measurements are done by employing a sequence of ultrashort light pulses to initiate a process and record its dynamics. The temporal width (duration) of the light pulses has to be on the same scale as the dynamics that are to be measured or even shorter.

Light sources

Titanium-sapphire laser

Ti-sapphire lasers are tunable lasers that emit red and near-infrared light (700 nm- 1100 nm).Ti-sapphire laser oscillators use Ti doped-sapphire crystals as a gain medium and Kerr-lens mode-locking to achieve sub-picosecond light pulses. Typical Ti:sapphire oscillator pulses have nJ energy and repetition rates 70-100 MHz. Chirped pulse amplification through regenerative amplification can be used to attain higher pulse energies. For amplification, laser pulses from the Ti:sapphire oscillator must first be stretched in time to prevent damage to optics, and then are injected into the cavity of another laser where pulses are amplified at a lower repetition rate. Regeneratively amplified pulses can be further amplified in a multi-pass amplifier. Following amplification, the pulses are recompressed to pulse widths similar to the original pulse widths.

Dye laser

A dye laser is a four-level laser that uses an organic dye as the gain medium. Pumped by a laser with a fixed wavelength, due to various dye types you use, different dye lasers can emit beams with different wavelengths. A ring laser design is most often used in a dye laser system. Also, tuning elements, such as a diffraction grating or prism, are usually incorporated in the cavity. This allows only light in a very narrow frequency range to resonate in the cavity and be emitted as laser emission. The wide tunability range, high output power, and pulsed or CW operation make the dye laser particularly useful in many physical & chemical studies.

Fiber laser

A fiber laser is usually generated first from a laser diode. The laser diode then couples the light into a fiber where it will be confined. Different wavelengths can be achieved with the use of doped fiber. The pump light from the laser diode will excite a state in the doped fiber which can then drop in energy causing a specific wavelength to be emitted. This wavelength may be different from that of the pump light and more useful for a particular experiment.

X-ray generation

Ultrafast optical pulses can be used to generate x-ray pulses in multiple ways. An optical pulse can excite an electron pulse via the photoelectric effect, and acceleration across a high potential gives the electrons kinetic energy. When the electrons hit a target they generate both characteristic x-rays and bremsstrahlung. A second method is via laser-induced plasma. When very high-intensity laser light is incident on a target, it strips electrons off the target creating a negatively charged plasma cloud. The strong Coulomb force due to the ionized material in the center of the cloud quickly accelerates the electrons back to the nuclei left behind. Upon collision with the nuclei, Bremsstrahlung and characteristic emission x-rays are given off. This method of x-ray generation scatters photons in all directions, but also generates picosecond x-ray pulses.

Conversion and characterization

Pulse characterization

For accurate spectroscopic measurements to be made, several characteristics of the laser pulse need to be known; pulse duration, pulse energy, spectral phase, and spectral shape are among some of these.[1] Information about pulse duration can be determined through autocorrelation measurements, or from cross-correlation with another well-characterized pulse. Methods allowing for complete characterization of pulses include frequency-resolved optical gating (FROG) and spectral phase interferometry for direct electric-field reconstruction (SPIDER).

Pulse shaping

Pulse shaping is to modify the pulses from the source in a well-defined manner, including manipulation on pulse’s amplitude, phase, and duration. To amplify pulse’s intensity, chirped pulse amplification is generally applied, which includes a pulse stretcher, amplifier, and compressor. It will not change the duration or phase of the pulse during the amplification. Pulse compression (shorten the pulse duration) is achieved by first chirping the pulse in a nonlinear material and broadening the spectrum, with the following compressor for chirp compensation. A fiber compressor is generally used in this case. Pulse shapers usually refer to optical modulators which apply Fourier transforms to a laser beam. Depending on which property of light is controlled, modulators are called intensity modulators, phase modulators, polarization modulators, spatial light modulators. Depending on the modulation mechanism, optical modulators are divided into Acoustic-optic modulators, Electro-optic modulators, Liquid crystal modulators, etc. Each is dedicated to different applications.

High harmonic generation

High harmonic generation (HHG) is the nonlinear process where intense laser radiation is converted from one fixed frequency to high harmonics of that frequency by ionization and recollision of an electron. It was first observed in 1987 by McPherson et al. who successfully generated harmonic emission up to the 17th order at 248 nm in neon gas. HHG is seen by focusing an ultra-fast, high-intensity, near-IR pulse into a noble gas at intensities of (1013–1014 W/cm2) and it generates coherent pulses in the XUV to Soft X-ray (100–1 nm) region of the spectrum. It is realizable on a laboratory scale (table-top systems) as opposed to large free electron-laser facilities.

High harmonic generation in atoms is well understood in terms of the three-step model (ionization, propagation, and recombination). Ionization: The intense laser field modifies the Coulomb potential of the atom, electron tunnels through the barrier and ionize. Propagation: The free-electron accelerates in the laser field and gains momentum. Recombination: When the field reverses, the electron is accelerated back toward the ionic parent and releases a photon with very high energy.

Frequency conversion techniques

Different spectroscopy experiments require different excitation or probe wavelengths. For this reason, frequency conversion techniques are commonly used to extend the operational spectrum of existing laser light sources. The most widespread conversion techniques rely on using crystals with second-order non-linearity to perform either parametric amplification or frequency mixing. Frequency mixing works by superimposing two beams of equal or different wavelengths to generate a signal which is a higher harmonic or the sum frequency of the first two. Parametric amplification overlaps a weak probe beam with a higher energy pump beam in a non-linear crystal such that the weak beam gets amplified and the remaining energy goes out as a new beam called the idler. This approach has the capability of generating output pulses that are shorter than the input ones. Different schemes of this approach have been implemented. Examples are optical parametric oscillator (OPO), optical parametric amplifier (OPA), non-collinear parametric amplifier (NOPA).

Techniques

Ultrafast transient absorption

This method is typical of 'pump-probe' experiments, where a pulsed laser is used to excite the electrons in a material (such as a molecule or semiconducting solid) from their ground states to higher-energy excited states. A probing light source, typically a xenon arc lamp or broadband laser pulse created by supercontinuum generation, is used to obtain an absorption spectrum of the compound at various times following its excitation. As the excited molecules absorb the probe light, they are further excited to even higher states or induced to return to the ground state radiatively through stimulated emission. After passing through the sample, the unabsorbed probe light continues to a photodetector such as an avalanche photodiode array or CMOS camera, and the data is processed to generate an absorption spectrum of the excited state. Since all the molecules or excitation sites in the sample will not undergo the same dynamics simultaneously, this experiment must be carried out many times (where each "experiment" comes from a single pair of pump and probe laser pulse interactions), and the data must be averaged to generate spectra with accurate intensities and peaks. Because photobleaching and other photochemical or photothermal reactions can happen to the samples, this method requires evaluating these effects by measuring the same sample at the same location many times at different pump and probe intensities. Most time the liquid samples are stirred during measurement making relatively long-time kinetics difficult to measure due to flow and diffusion. Unlike time-correlated single photon counting (TCSPC), this technique can be carried out on non-fluorescent samples. It can also be performed on non-transmissive samples in a reflection geometry.

Ultrafast transient absorption can use almost any probe light, so long as the probe is of a pertinent wavelength or set of wavelengths. A monochromator and photomultiplier tube in place of the avalanche photodiode array allows observation of a single probe wavelength, and thus allows probing of the decay kinetics of the excited species. The purpose of this setup is to take kinetic measurements of species that are otherwise nonradiative, and specifically it is useful for observing species that have short-lived and non-phosphorescent populations within the triplet manifold as part of their decay path. The pulsed laser in this setup is used both as a primary excitation source, and a clock signal for the ultrafast measurements. Although laborious and time-consuming, the monochromator position may also be shifted to allow absorbance decay profiles to be constructed, ultimately to the same effect as the above method.

The data of UTA measurements usually are reconstructed absorption spectra sequenced over the delay time between the pump and probe. Each spectrum resembles a normal steady-state absorption profile of the sample after the delay time of the excitation with the time resolution convoluted from the pump and probe time resolutions. The excitation wavelength is blinded by the pump laser and cut out. The rest of the spectra usually have a few bands such as ground-state absorption, excited-state absorption, and stimulated emission. Under normal conditions, the angles of the emission are randomly orientated and not detected in the absorption geometry. But in UTA measurement, the stimulated emission resembles the lasing effect, is highly oriented, and is detected. Many times this emission overlaps with the absorption bands and needs to be deconvoluted for quantitative analysis. The relationship and correlation among these bands can be visualized using the classical spectroscopic two-dimensional correlation analysis.

Time-resolved photoelectron spectroscopy and two-photon photoelectron spectroscopy

Time-resolved photoelectron spectroscopy and two-photon photoelectron spectroscopy (2PPE) combine a pump-probe scheme with angle-resolved photoemission. A first laser pulse is used to excite a material, a second laser pulse ionizes the system. The kinetic energy of the electrons from this process is then detected, through various methods including energy mapping, time of flight measurements etc. As above, the process is repeated many times, with different time delays between the probe pulse and the pump pulse. This builds up a picture of how the molecule relaxes over time. A variation of this method looks at the positive ions created in this process and is called time-resolved photo-ion spectroscopy (TRPIS)

Multidimensional spectroscopy

Using the same principles pioneered by 2D-NMR experiments, multidimensional optical or infrared spectroscopy is possible using ultrafast pulses. Different frequencies can probe various dynamic molecular processes to differentiate between inhomogeneous and homogeneous line broadening as well as identify coupling between the measured spectroscopic transitions. If two oscillators are coupled together, be it intramolecular vibrations or intermolecular electronic coupling, the added dimensionality will resolve anharmonic responses not identifiable in linear spectra. A typical 2D pulse sequence consists of an initial pulse to pump the system into a coherent superposition of states, followed by a phase conjugate second pulse that pushes the system into a non-oscillating excited state, and finally, a third pulse that converts back to a coherent state that produces a measurable pulse. A 2D frequency spectrum can then be recorded by plotting the Fourier transform of the delay between the first and second pulses on one axis, and the Fourier transform of the delay between a detection pulse relative to the signal-producing third pulse on the other axis. 2D spectroscopy is an example of a four-wave mixing experiment, and the wavevector of the signal will be the sum of the three incident wavevectors used in the pulse sequence. Multidimensional spectroscopies exist in infrared and visible variants as well as combinations using different wavelength regions.

Ultrafast imaging

Most ultrafast imaging techniques are variations on standard pump-probe experiments. Some commonly used techniques are Electron Diffraction imaging, Kerr Gated Microscopy, imaging with ultrafast electron pulses and terahertz imaging. This is particularly true in the biomedical community where safe and non-invasive techniques for diagnosis are always of interest. Terahertz imaging has recently been used to identify areas of decay in tooth enamel and image the layers of the skin. Additionally, it has shown to be able to successfully distinguish a region of breast carcinoma from healthy tissue. Another technique called Serial Time-encoded amplified microscopy has shown to have the capability of even earlier detection of trace amounts of cancer cells in the blood. Other non-biomedical applications include ultrafast imaging around corners or through opaque objects.

Femtosecond up-conversion

Femtosecond up-conversion is a pump-probe technique that uses nonlinear optics to combine the fluorescence signal and probe signal to create a signal with a new frequency via photon upconversion, which is subsequently detected. The probe scans through delay times after the pump excites the sample, generating a plot of intensity over time.

Applications

Applications of femtosecond spectroscopy to biochemistry

Ultrafast processes are found throughout biology. Until the advent of femtosecond methods, many of the mechanism of such processes were unknown. Examples of these include the cis-trans photoisomerization of the rhodopsin chromophore retinal, excited state and population dynamics of DNA, and the charge transfer processes in photosynthetic reaction centers Charge transfer dynamics in photosynthetic reaction centers has a direct bearing on man’s ability to develop light harvesting technology, while the excited state dynamics of DNA has implications in diseases such as skin cancer. Advances in femtosecond methods are crucial to the understanding of ultrafast phenomena in nature.

Photodissociation and femtosecond probing

Photodissociation is a chemical reaction in which a chemical compound is broken down by photons. It is defined as the interaction of one or more photons with one target molecule. Any photon with sufficient energy can affect the chemical bonds of a chemical compound, such as visible light, ultraviolet light, x-rays and gamma rays. The technique of probing chemical reactions has been successfully applied to unimolecular dissociations. The possibility of using a femtosecond technique to study bimolecular reactions at the individual collision level is complicated by the difficulties of spatial and temporal synchronization. One way to overcome this problem is through the use of Van der Waals complexes of weakly bound molecular cluster. Femtosecond techniques are not limited to the observation of the chemical reactions, but can even exploited to influence the course of the reaction. This can open new relaxation channels or increase the yield of certain reaction products.

Picosecond-to-nanosecond spectroscopy

Streak camera

Unlike attosecond and femtosecond pulses, the duration of pulses on the nanosecond timescale are slow enough to be measured through electronic means. Streak cameras translate the temporal profile of pulses into that of a spatial profile; that is, photons that arrive on the detector at different times arrive at different locations on the detector.

Time-correlated single photon counting

Time-correlated single photon counting (TCSPC) is used to analyze the relaxation of molecules from an excited state to a lower energy state. Since various molecules in a sample will emit photons at different times following their simultaneous excitation, the decay must be thought of as having a certain rate rather than occurring at a specific time after excitation. By observing how long individual molecules take to emit their photons, and then combining all these data points, an intensity vs. time graph can be generated that displays the exponential decay curve typical to these processes. However, it is difficult to simultaneously monitor multiple molecules. Instead, individual excitation-relaxation events are recorded and then averaged to generate the curve.
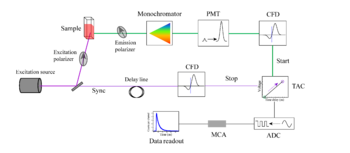
Schematic of a TCSPC setup

This technique analyzes the time difference between the excitation of the sample molecule and the release of energy as another photon. Repeating this process many times will give a decay profile. Pulsed lasers or LEDs can be used as a source of excitation. Part of the light passes through the sample, the other to the electronics as "sync" signal. The light emitted by the sample molecule is passed through a monochromator to select a specific wavelength. The light then is detected and amplified by a photomultiplier tube (PMT). The emitted light signal as well as reference light signal is processed through a constant fraction discriminator (CFD) which eliminates timing jitter. After passing through the CFD, the reference pulse activates a time-to-amplitude converter (TAC) circuit. The TAC charges a capacitor which will hold the signal until the next electrical pulse. In reverse TAC mode the signal of "sync" stops the TAC. This data is then further processed by an analog-to-digital converter (ADC) and multi-channel analyzer (MCA) to get a data output. To make sure that the decay is not biased to early arriving photons, the photon count rate is kept low (usually less than 1% of excitation rate).

This electrical pulse comes after the second laser pulse excites the molecule to a higher energy state, and a photon is eventually emitted from a single molecule upon returning to its original state. Thus, the longer a molecule takes to emit a photon, the higher the voltage of the resulting pulse. The central concept of this technique is that only a single photon is needed to discharge the capacitor. Thus, this experiment must be repeated many times to gather the full range of delays between excitation and emission of a photon. After each trial, a pre-calibrated computer converts the voltage sent out by the TAC into a time and records the event in a histogram of time since excitation. Since the probability that no molecule will have relaxed decreases with time, a decay curve emerges that can then be analyzed to find out the decay rate of the event.

A major complicating factor is that many decay processes involve multiple energy states, and thus multiple rate constants. Though non-linear least squares analysis can usually detect the different rate constants, determining the processes involved is often very difficult and requires the combination of multiple ultra-fast techniques. Even more complicating is the presence of inter-system crossing and other non-radiative processes in a molecule. A limiting factor of this technique is that it is limited to studying energy states that result in fluorescent decay. The technique can also be used to study relaxation of electrons from the conduction band to the valence band in semiconductors.
Second wind

From Wikipedia, the free encyclopedia

Second wind is a phenomenon in endurance sports, such as marathons or road running (as well as other sports), whereby an athlete who is out of breath and too tired to continue (known as "hitting the wall"), finds the strength to press on at top performance with less exertion. The feeling may be similar to that of a "runner's high", the most obvious difference being that the runner's high occurs after the race is over. In muscle glycogenoses (muscle GSDs), an inborn error of carbohydrate metabolism impairs either the formation or utilization of muscle glycogen. As such, those with muscle glycogenoses do not need to do prolonged exercise to experience "hitting the wall". Instead, signs of exercise intolerance, such as an inappropriate rapid heart rate response to exercise, are experienced from the beginning of an activity, and some muscle GSDs can achieve second wind within about 10 minutes from the beginning of the aerobic activity, such as walking. (See below in pathology).

In experienced athletes, "hitting the wall" is conventionally believed to be due to the body's glycogen stores being depleted, with "second wind" occurring when fatty acids become the predominant source of energy. The delay between "hitting the wall" and "second wind" occurring, has to do with the slow speed of which fatty acids sufficiently produce ATP (energy); with fatty acids taking approximately 10 minutes, whereas muscle glycogen is considerably faster at about 30 seconds. Some scientists believe the second wind to be a result of the body finding the proper balance of oxygen to counteract the buildup of lactic acid in the muscles. Others claim second winds are due to endorphin production.

Heavy breathing during exercise also provides cooling for the body. After some time the veins and capillaries dilate and cooling takes place more through the skin, so less heavy breathing is needed. The increase in the temperature of the skin can be felt at the same time as the "second wind" takes place.

Documented experiences of the second wind go back at least 100 years, when it was taken to be a commonly held fact of exercise. The phenomenon has come to be used as a metaphor for continuing on with renewed energy past the point thought to be one's prime, whether in other sports, careers, or life in general.

Hypotheses

Metabolic switching

When non-aerobic glycogen metabolism is insufficient to meet energy demands, physiologic mechanisms utilize alternative sources of energy such as fatty acids and proteins via aerobic respiration. Second-wind phenomena in metabolic disorders such as McArdle's disease are attributed to this metabolic switch and the same or a similar phenomenon may occur in healthy individuals (see symptoms of McArdle's disease).

Lactic acid

Muscular exercise as well as other cellular functions requires oxygen to produce ATP and properly function. This normal function is called aerobic metabolism and does not produce lactic acid if enough oxygen is present. During heavy exercise such as long distance running or any demanding exercise, the body's need for oxygen to produce energy is higher than the oxygen supplied in the blood from respiration. Anaerobic metabolism to some degree then takes place in the muscle and this less ideal energy production produces lactic acid as a waste metabolite. If the oxygen supply is not soon restored, this may lead to accumulation of lactic acid.

This is the case even without exercise in people with respiratory disease, challenged circulation of blood to parts of the body or any other situation when oxygen cannot be supplied to the tissues involved.

Some people's bodies may take more time than others to be able to balance the amount of oxygen they need to counteract the lactic acid. This theory of the second wind posits that, by pushing past the point of pain and exhaustion, runners may give their systems enough time to warm up and begin to use the oxygen to its fullest potential. For this reason, well-conditioned Olympic-level runners do not generally experience a second wind (or they experience it much sooner) because their bodies are trained to perform properly from the start of the race.

The idea of "properly trained" athlete delves into the theory of how an amateur athlete can train his or her body to increase the aerobic capacity or aerobic metabolism. A big push in Ironman Triathlon ten years ago introduced the idea of heart rate training and "tricking" one's body into staying in an aerobic metabolic state for longer periods of time. This idea is widely accepted and incorporated into many Ironman Triathlon training programs.

Endorphins

Endorphins are credited as the cause of the feeling of euphoria and wellbeing found in many forms of exercise, so proponents of this theory believe that the second wind is caused by their early release. Many of these proponents feel that the second wind is very closely related to—or even interchangeable with—the runner's high.

Pathology

A second wind phenomenon is also seen in some medical conditions, such as McArdle disease (GSD-V) and Phosphoglucomutase deficiency (PGM1-CDG/CDG1T/GSD-XIV). Unlike non-affected individuals that have to do long-distance running to deplete their muscle glycogen, in GSD-V individuals their muscle glycogen is unavailable, so second wind is achieved after 6–10 minutes of light to moderate aerobic activity (such as walking without an incline).

Skeletal muscle relies predominantly on glycogenolysis for the first few minutes as it transitions from rest to activity, as well as throughout high-intensity aerobic activity and all anaerobic activity. In GSD-V, due to a glycolytic block, there is an energy shortage in the muscle cells after the phosphagen system has been depleted. The heart tries to compensate for the energy shortage by increasing heart rate to maximize delivery of oxygen and blood borne fuels to the muscle cells for oxidative phosphorylation. Exercise intolerance such as muscle fatigue and pain, an inappropriate rapid heart rate in response to exercise (tachycardia), and rapid breathing (tachypnea) are experienced until sufficient energy is produced via oxidative phosphorylation, primarily from free fatty acids.

Oxidative phosphorylation by free fatty acids is more easily achievable for light to moderate aerobic activity (below the aerobic threshold), as high-intensity (fast-paced) aerobic activity relies more on muscle glycogen due to its high ATP consumption. Oxidative phosphorylation by free fatty acids is not achievable with isometric and other anaerobic activity (such as lifting weights), as contracted muscles restricts blood flow (leaving oxygen and blood borne fuels unable to be delivered to muscle cells adequately for oxidative phosphorylation).

The second wind phenomenon in GSD-V individuals can be demonstrated by measuring heart rate during a 12 Minute Walk Test. A "third wind" phenomenon is also seen in GSD-V individuals, where after approximately 2 hours, they see a further improvement of symptoms as the body becomes even more fat adapted.

Without muscle glycogen, it is important to get into second wind without going too fast, too soon nor trying to push through the pain. Going too fast, too soon encourages protein metabolism over fat metabolism, and the muscle pain in this circumstance is a result of muscle damage due to a severely low ATP reservoir. Aiming for ATP production primarily from fat metabolism rather than protein metabolism is also why the preferred method for getting into second wind is to slowly increase speed during aerobic activity for 10 minutes, rather than to go quickly from the outset and then resting for 10 minutes before resuming. In muscle glycogenoses, second wind is achieved gradually over 6–10 minutes from the beginning of aerobic activity and individuals may struggle to get into second wind within that timeframe if they accelerate their speed too soon or if they try to push through the pain. Understanding the types of activity with which second wind can be achieved and which external factors affect it (such as walking into a headwind, walking on sand, or an icy surface), with practice while paying attention to the sensations in their muscles and using a heart rate monitor to see if their heart rate shoots up too high, individuals can learn how to get into second wind safely to the point where it becomes almost second nature (much like riding a bicycle or driving).

Pain killers and muscle relaxants dull the sensations in the muscles that let us know if we are going too fast, so either take them after exercise or be extra mindful about the speed if you have to take them during exercise. Otherwise, individuals might find themselves in a spiral of taking painkillers or muscle relaxants, inadvertently causing muscle damage because they can’t feel the early warning signals that their muscles are giving them, then having to take more because of the increased pain from muscle damage, then causing even more muscle damage while exercising on the increased dosage, which then causes more pain, and so on. Due to the glycolytic block, those with McArdle disease and select other muscle glycogenoses don’t produce enough lactic acid to feel the usual kind of pain that unaffected individuals do during exercise, so the phrase “no pain, no gain” should be ignored and instead muscle pain and tightness are signals to slow down or rest briefly.

Going too fast, too soon encourages protein metabolism over fat metabolism. Protein metabolism occurs through amino acid degradation which converts amino acids into pyruvate, the breakdown of protein to maintain the amino acid pool, the myokinase (adenylate kinase) reaction and purine nucleotide cycle. Amino acids are vital to the purine nucleotide cycle as they are precursors for purines, nucleotides, and nucleosides; as well as branch-chained amino acids are converted into glutamate and aspartate for use in the cycle (see Aspartate and glutamate synthesis). Severe breakdown of muscle leads to rhabdomyolysis and myoglobinuria. Excessive use of the myokinase reaction and purine nucleotide cycle leads to myogenic hyperuricemia.

For McArdle disease (GSD-V), regular aerobic exercise utilizing "second wind" to enable the muscles to become aerobically conditioned, as well as anaerobic exercise (strength training) that follows the activity adaptations so as not to cause muscle injury, helps to improve exercise intolerance symptoms and maintain overall health. Studies have shown that regular low-moderate aerobic exercise increases peak power output, increases peak oxygen uptake (VO2peak), lowers heart rate, and lowers serum CK in individuals with McArdle disease.

Regardless of whether the patient experiences symptoms of muscle pain, muscle fatigue, or cramping, the phenomenon of second wind having been achieved is demonstrable by the sign of an increased heart rate dropping while maintaining the same speed on the treadmill. Inactive patients experienced second wind, demonstrated through relief of typical symptoms and the sign of an increased heart rate dropping, while performing low-moderate aerobic exercise (walking or brisk walking).

Conversely, patients that were regularly active did not experience the typical symptoms during low-moderate aerobic exercise (walking or brisk walking), but still demonstrated second wind by the sign of an increased heart rate dropping. For the regularly active patients, it took more strenuous exercise (very brisk walking/jogging or bicycling) for them to experience both the typical symptoms and relief thereof, along with the sign of an increased heart rate dropping, demonstrating second wind.

In young children (<10 years old) with McArdle disease (GSD-V), it may be more difficult to detect the second wind phenomenon. They may show a normal heart rate, with normal or above normal peak cardio-respiratory capacity (VO2max). That said, patients with McArdle disease typically experience symptoms of exercise intolerance before the age of 10 years, with the median symptomatic age of 3 years.

Tarui disease (GSD-VII) patients do not experience the "second wind" phenomenon; instead are said to be "out-of-wind". However, they can achieve sub-maximal benefit from lipid metabolism of free fatty acids during aerobic activity following a warm-up.

Cardiac physiology

From Wikipedia, the free encyclopedia
https://en.wikipedia.org/wiki/Cardiac_physiology

Cardiac physiology or heart function is the study of healthy, unimpaired function of the heart: involving blood flow; myocardium structure; the electrical conduction system of the heart; the cardiac cycle and cardiac output and how these interact and depend on one another.

Blood flow

Blood flow through the valves
3D echocardiogram viewed from the top, with the upper part of the ventricles removed and the mitral valve clearly visible (cusps are not clear and pulmonary valve not visible). On the left are two, two-dimensional views showing tricuspid and mitral valves (above) and aortic valve (below).
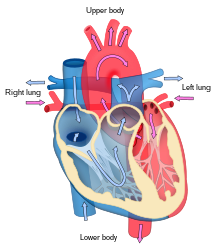
Blood flow diagram of the human heart. Blue components indicate de-oxygenated blood pathways and red components indicate oxygenated pathways.

The heart functions as a pump and acts as a double pump in the cardiovascular system to provide a continuous circulation of blood throughout the body. This circulation includes the systemic circulation and the pulmonary circulation. Both circuits transport blood but they can also be seen in terms of the gases they carry. The pulmonary circulation collects oxygen from the lungs and delivers carbon dioxide for exhalation. The systemic circuit transports oxygen to the body and returns relatively de-oxygenated blood and carbon dioxide to the pulmonary circuit.

Blood flows through the heart in one direction, from the atria to the ventricles, and out through the pulmonary artery into the pulmonary circulation, and the aorta into the systemic circulation. The pulmonary artery (also trunk) branches into the left and right pulmonary arteries to supply each lung. Blood is prevented from flowing backwards (regurgitation) by the tricuspid, bicuspid, aortic, and pulmonary valves.

The function of the right heart, is to collect de-oxygenated blood, in the right atrium, from the body via the superior vena cava, inferior vena cava and from the coronary sinus and pump it, through the tricuspid valve, via the right ventricle, through the semilunar pulmonary valve and into the pulmonary artery in the pulmonary circulation where carbon dioxide can be exchanged for oxygen in the lungs. This happens through the passive process of diffusion. In the left heart oxygenated blood is returned to the left atrium via the pulmonary vein. It is then pumped into the left ventricle through the bicuspid valve and into the aorta for systemic circulation. Eventually in the systemic capillaries exchange with the tissue fluid and cells of the body occurs; oxygen and nutrients are supplied to the cells for their metabolism and exchanged for carbon dioxide and waste products In this case, oxygen and nutrients exit the systemic capillaries to be used by the cells in their metabolic processes, and carbon dioxide and waste products will enter the blood.

The ventricles are stronger and thicker than the atria, and the muscle wall surrounding the left ventricle is thicker than the wall surrounding the right ventricle due to the higher force needed to pump the blood through the systemic circulation. Atria facilitate circulation primarily by allowing uninterrupted venous flow to the heart, preventing the inertia of interrupted venous flow that would otherwise occur at each ventricular systole.

Cardiac muscle

Cardiac muscle tissue has autorhythmicity, the unique ability to initiate a cardiac action potential at a fixed rate – spreading the impulse rapidly from cell to cell to trigger the contraction of the entire heart. This autorhythmicity is still modulated by the endocrine and nervous systems.

There are two types of cardiac muscle cell: cardiomyocytes which have the ability to contract easily, and modified cardiomyocytes the pacemaker cells of the conducting system. The cardiomyocytes make up the bulk (99%) of cells in the atria and ventricles. These contractile cells respond to impulses of action potential from the pacemaker cells and are responsible for the contractions that pump blood through the body. The pacemaker cells make up just (1% of cells) and form the conduction system of the heart. They are generally much smaller than the contractile cells and have few of the myofibrils or myofilaments which means that they have limited contractibility. Their function is similar in many respects to neurons. The bundle of His and Purkinje fibres are specialised cardiomyocytes that function in the conduction system.

Structure of cardiac muscle

Details of intercalated discs

Cardiomyocytes, are considerably shorter and have smaller diameters than skeletal myocytes. Cardiac muscle (like skeletal muscle) is characterized by striations – the stripes of dark and light bands resulting from the organised arrangement of myofilaments and myofibrils in the sarcomere along the length of the cell. T (transverse) tubules are deep invaginations from the sarcolemma (cell membrane) that penetrate the cell, allowing the electrical impulses to reach the interior. In cardiac muscle the T-tubules are only found at the Z-lines. When an action potential causes cells to contract, calcium is released from the sarcoplasmic reticulum of the cells as well as the T tubules. The calcium release triggers sliding of the actin and myosin fibrils leading to contraction. A plentiful supply of mitochondria provide the energy for the contractions. Typically, cardiomyocytes have a single, central nucleus, but can also have two or more.

Cardiac muscle cells branch freely and are connected by junctions known as intercalated discs which help the synchronized contraction of the muscle. The sarcolemma (membrane) from adjacent cells bind together at the intercalated discs. They consist of desmosomes, specialized linking proteoglycans, tight junctions, and large numbers of gap junctions that allow the passage of ions between the cells and help to synchronize the contraction. Intercellular connective tissue also helps to strongly bind the cells together, in order to withstand the forces of contraction.

Cardiac muscle undergoes aerobic respiration patterns, primarily metabolizing lipids and carbohydrates. Oxygen from the lungs attaches to haemoglobin and is also stored in the myoglobin, so that a plentiful supply of oxygen is available. Lipids, and glycogen are also stored within the sarcoplasm and these are broken down by mitochondria to release ATP. The cells undergo twitch-type contractions with long refractory periods followed by brief relaxation periods when the heart fills with blood for the next cycle.

Electrical conduction

Transmission of a cardiac action potential through the heart's conduction system

It is not very well known how the electric signal moves in the atria. It seems that it moves in a radial way, but Bachmann's bundle and coronary sinus muscle play a role in conduction between the two atria, which have a nearly simultaneous systole. While in the ventricles, the signal is carried by specialized tissue called the Purkinje fibers which then transmit the electric charge to the myocardium.

If embryonic heart cells are separated into a Petri dish and kept alive, each is capable of generating its own electrical impulse followed by contraction. When two independently beating embryonic cardiac muscle cells are placed together, the cell with the higher inherent rate sets the pace, and the impulse spreads from the faster to the slower cell to trigger a contraction. As more cells are joined, the fastest cell continues to assume control of the rate. A fully developed adult heart maintains the capability of generating its own electrical impulse, triggered by the fastest cells, as part of the cardiac conduction system. The components of the cardiac conduction system include the atrial and ventricular syncytium, the sinoatrial node, the atrioventricular node, the bundle of His (atrioventricular bundle), the bundle branches, and the Purkinje cells.

Sinoatrial (SA) node

Diagrammatic conduction system of the heart

Normal sinus rhythm is established by the sinoatrial (SA) node, the heart's pacemaker. The SA node is a specialized grouping of cardiomyocytes in the upper and back walls of the right atrium very close to the opening of the superior vena cava. The SA node has the highest rate of depolarization.

This impulse spreads from its initiation in the SA node throughout the atria through specialized internodal pathways, to the atrial myocardial contractile cells and the atrioventricular node. The internodal pathways consist of three bands (anterior, middle, and posterior) that lead directly from the SA node to the next node in the conduction system, the atrioventricular node. The impulse takes approximately 50 ms (milliseconds) to travel between these two nodes. The relative importance of this pathway has been debated since the impulse would reach the atrioventricular node simply following the cell-by-cell pathway through the contractile cells of the myocardium in the atria. In addition, there is a specialized pathway called Bachmann's bundle or the interatrial band that conducts the impulse directly from the right atrium to the left atrium. Regardless of the pathway, as the impulse reaches the atrioventricular septum, the connective tissue of the cardiac skeleton prevents the impulse from spreading into the myocardial cells in the ventricles except at the atrioventricular node. The electrical event, the wave of depolarization, is the trigger for muscular contraction. The wave of depolarization begins in the right atrium, and the impulse spreads across the superior portions of both atria and then down through the contractile cells. The contractile cells then begin contraction from the superior to the inferior portions of the atria, efficiently pumping blood into the ventricles.

Atrioventricular (AV) node

The atrioventricular (AV) node is a second cluster of specialized myocardial conductive cells, located in the inferior portion of the right atrium within the atrioventricular septum. The septum prevents the impulse from spreading directly to the ventricles without passing through the AV node. There is a critical pause before the AV node depolarizes and transmits the impulse to the atrioventricular bundle. This delay in transmission is partially attributable to the small diameter of the cells of the node, which slow the impulse. Also, conduction between nodal cells is less efficient than between conducting cells. These factors mean that it takes the impulse approximately 100 ms to pass through the node. This pause is critical to heart function, as it allows the atrial cardiomyocytes to complete their contraction that pumps blood into the ventricles before the impulse is transmitted to the cells of the ventricle itself. With extreme stimulation by the SA node, the AV node can transmit impulses maximally at 220 per minute. This establishes the typical maximum heart rate in a healthy young individual. Damaged hearts or those stimulated by drugs can contract at higher rates, but at these rates, the heart can no longer effectively pump blood.

Bundle of His, bundle branches, and Purkinje fibers

Arising from the AV node, the bundle of His, proceeds through the interventricular septum before dividing into two bundle branches, commonly called the left and right bundle branches. The left bundle branch has two fascicles. The left bundle branch supplies the left ventricle, and the right bundle branch the right ventricle. Since the left ventricle is much larger than the right, the left bundle branch is also considerably larger than the right. Portions of the right bundle branch are found in the moderator band and supply the right papillary muscles. Because of this connection, each papillary muscle receives the impulse at approximately the same time, so they begin to contract simultaneously just prior to the remainder of the myocardial contractile cells of the ventricles. This is believed to allow tension to develop on the chordae tendineae prior to right ventricular contraction. There is no corresponding moderator band on the left. Both bundle branches descend and reach the apex of the heart where they connect with the Purkinje fibers. This passage takes approximately 25 ms.

The Purkinje fibers are additional myocardial conductive fibers that spread the impulse to the myocardial contractile cells in the ventricles. They extend throughout the myocardium from the apex of the heart toward the atrioventricular septum and the base of the heart. The Purkinje fibers have a fast inherent conduction rate, and the electrical impulse reaches all of the ventricular muscle cells in about 75 ms. Since the electrical stimulus begins at the apex, the contraction also begins at the apex and travels toward the base of the heart, similar to squeezing a tube of toothpaste from the bottom. This allows the blood to be pumped out of the ventricles and into the aorta and pulmonary trunk. The total time elapsed from the initiation of the impulse in the SA node until depolarization of the ventricles is approximately 225 ms.

Membrane potentials and ion movement in cardiac conductive cells

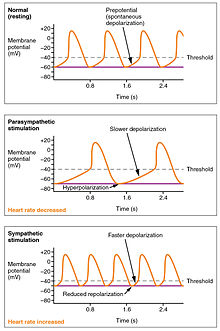
Action potentials are considerably different between conductive and contractive cardiomyocytes. While sodium Na+ and potassium K+ ions play essential roles, calcium ions Ca2+ are also critical for both types of cell. Unlike skeletal muscles and neurons, cardiac conductive cells do not have a stable resting potential. Conductive cells contain a series of sodium ion channels that allow a normal and slow influx of sodium ions that causes the membrane potential to rise slowly from an initial value of −60 mV up to about –40 mV. The resulting movement of sodium ions creates spontaneous depolarization (or prepotential depolarization).

At this point, calcium channels open and Ca2+ enters the cell, further depolarizing it at a more rapid rate until it reaches a value of approximately +5 mV. At this point, the calcium ion channels close and potassium channels open, allowing outflux of K+ and resulting in repolarization. When the membrane potential reaches approximately −60 mV, the K+ channels close and Na+ channels open, and the prepotential phase begins again. This process gives the autorhythmicity to cardiac muscle.

The prepotential is due to a slow influx of sodium ions until the threshold is reached followed by a rapid depolarization and repolarization. The prepotential accounts for the membrane reaching threshold and initiates the spontaneous depolarization and contraction of the cell; there is no resting potential.

Membrane Potentials and ion movement in cardiac contractile cells

There is a distinctly different electrical pattern involving the contractile cells. In this case, there is a rapid depolarization, followed by a plateau phase and then repolarization. This phenomenon accounts for the long refractory periods required for the cardiac muscle cells to pump blood effectively before they are capable of firing for a second time. These cardiac myocytes normally do not initiate their own electrical potential, although they are capable of doing so, but rather wait for an impulse to reach them.

Contractile cells demonstrate a much more stable resting phase than conductive cells at approximately −80 mV for cells in the atria and −90 mV for cells in the ventricles. Despite this initial difference, the other components of their action potentials are virtually identical. In both cases, when stimulated by an action potential, voltage-gated channels rapidly open, beginning the positive-feedback mechanism of depolarization. This rapid influx of positively charged ions raises the membrane potential to approximately +30 mV, at which point the sodium channels close. The rapid depolarization period typically lasts 3–5 ms. Depolarization is followed by the plateau phase, in which membrane potential declines relatively slowly. This is due in large part to the opening of the slow Ca2+ channels, allowing Ca2+ to enter the cell while few K+ channels are open, allowing K+ to exit the cell. The relatively long plateau phase lasts approximately 175 ms. Once the membrane potential reaches approximately zero, the Ca2+ channels close and K+ channels open, allowing K+ to exit the cell. The repolarization lasts approximately 75 ms. At this point, membrane potential drops until it reaches resting levels once more and the cycle repeats. The entire event lasts between 250 and 300 ms.

The absolute refractory period for cardiac contractile muscle lasts approximately 200 ms, and the relative refractory period lasts approximately 50 ms, for a total of 250 ms. This extended period is critical, since the heart muscle must contract to pump blood effectively and the contraction must follow the electrical events. Without extended refractory periods, premature contractions would occur in the heart and would not be compatible with life.


(a) There is long plateau phase due to the influx of calcium ions. The extended refractory period allows the cell to fully contract before another electrical event can occur.
(b) The action potential for heart muscle is compared to that of skeletal muscle.

Calcium ions

Calcium ions play two critical roles in the physiology of cardiac muscle. Their influx through slow calcium channels accounts for the prolonged plateau phase and absolute refractory period. Calcium ions also combine with the regulatory protein troponin in the troponin complex. Both roles enabling the myocardium to function properly.

Approximately 20 percent of the calcium required for contraction is supplied by the influx of Ca2+ during the plateau phase. The remaining Ca2+ for contraction is released from storage in the sarcoplasmic reticulum.

Comparative rates of conduction system firing

The pattern of prepotential or spontaneous depolarization, followed by rapid depolarization and repolarization just described, are seen in the SA node and a few other conductive cells in the heart. Since the SA node is the pacemaker, it reaches threshold faster than any other component of the conduction system. It will initiate the impulses spreading to the other conducting cells. The SA node, without nervous or endocrine control, would initiate a heart impulse approximately 80–100 times per minute. Although each component of the conduction system is capable of generating its own impulse, the rate progressively slows from the SA node to the Purkinje fibers. Without the SA node, the AV node would generate a heart rate of 40–60 beats per minute. If the AV node were blocked, the atrioventricular bundle would fire at a rate of approximately 30–40 impulses per minute. The bundle branches would have an inherent rate of 20–30 impulses per minute, and the Purkinje fibers would fire at 15–20 impulses per minute. While a few exceptionally trained aerobic athletes demonstrate resting heart rates in the range of 30–40 beats per minute (the lowest recorded figure is 28 beats per minute for Miguel Indurain, a cyclist)–for most individuals, rates lower than 50 beats per minute would indicate a condition called bradycardia. Depending upon the specific individual, as rates fall much below this level, the heart would be unable to maintain adequate flow of blood to vital tissues, initially resulting in decreasing loss of function across the systems, unconsciousness, and ultimately death.

Cardiac cycle

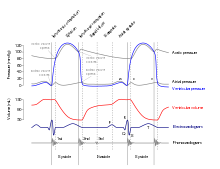
Cardiac cycle shown against ECG

The period of time that begins with contraction of the atria and ends with ventricular relaxation is known as the cardiac cycle. The period of contraction that the heart undergoes while it pumps blood into circulation is called systole. The period of relaxation that occurs as the chambers fill with blood is called diastole. Both the atria and ventricles undergo systole and diastole, and it is essential that these components be carefully regulated and coordinated to ensure blood is pumped efficiently to the body.

The cardiac cycle as correlated to the ECG

Pressures and flow

Fluids, move from regions of high pressure to regions of lower pressure. Accordingly, when the heart chambers are relaxed (diastole), blood will flow into the atria from the higher pressure of the veins. As blood flows into the atria, the pressure will rise, so the blood will initially move passively from the atria into the ventricles. When the action potential triggers the muscles in the atria to contract (atrial systole), the pressure within the atria rises further, pumping blood into the ventricles. During ventricular systole, pressure rises in the ventricles, pumping blood into the pulmonary trunk from the right ventricle and into the aorta from the left ventricle.

Phases of the cardiac cycle

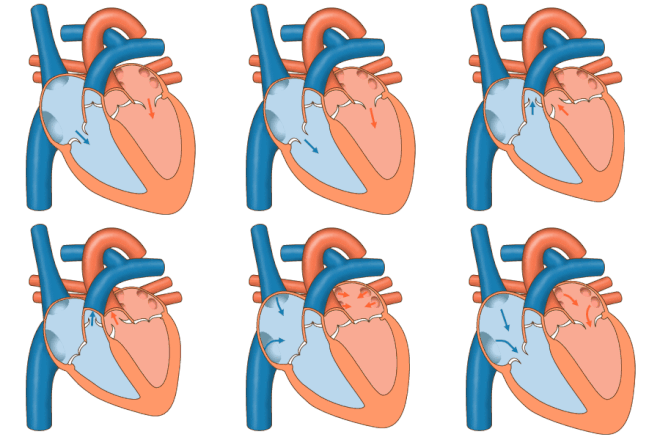
At the beginning of the cardiac cycle, both the atria and ventricles are relaxed (diastole). Blood is flowing into the right atrium from the superior and inferior venae cavae and the coronary sinus. Blood flows into the left atrium from the four pulmonary veins. The two atrioventricular valves, the tricuspid and mitral valves, are both open, so blood flows unimpeded from the atria and into the ventricles. Approximately 70–80 percent of ventricular filling occurs by this method. The two semilunar valves, the pulmonary and aortic valves, are closed, preventing backflow of blood into the right and left ventricles from the pulmonary trunk on the right and the aorta on the left.

Atrial systole and diastole

Contraction of the atria follows depolarization, represented by the P wave of the ECG. As the atrial muscles contract from the superior portion of the atria toward the atrioventricular septum, pressure rises within the atria and blood is pumped into the ventricles through the open atrioventricular (tricuspid, and mitral or bicuspid) valves. At the start of atrial systole, the ventricles are normally filled with approximately 70–80 percent of their capacity due to inflow during diastole. Atrial contraction, also referred to as the "atrial kick," contributes the remaining 20–30 percent of filling. Atrial systole lasts approximately 100 ms and ends prior to ventricular systole, as the atrial muscle returns to diastole.

Ventricular systole

Ventricular systole follows the depolarization of the ventricles and is represented by the QRS complex in the ECG. It may be conveniently divided into two phases, lasting a total of 270 ms. At the end of atrial systole and just prior to ventricular contraction, the ventricles contain approximately 130 mL blood in a resting adult in a standing position. This volume is known as the end diastolic volume (EDV) or preload.

Initially, as the muscles in the ventricle contract, the pressure of the blood within the chamber rises, but it is not yet high enough to open the semilunar (pulmonary and aortic) valves and be ejected from the heart. However, blood pressure quickly rises above that of the atria that are now relaxed and in diastole. This increase in pressure causes blood to flow back toward the atria, closing the tricuspid and mitral valves. Since blood is not being ejected from the ventricles at this early stage, the volume of blood within the chamber remains constant. Consequently, this initial phase of ventricular systole is known as isovolumic contraction, also called isovolumetric contraction.

In the second phase of ventricular systole, the ventricular ejection phase, the contraction of the ventricular muscle has raised the pressure within the ventricle to the point that it is greater than the pressures in the pulmonary trunk and the aorta. Blood is pumped from the heart, pushing open the pulmonary and aortic semilunar valves. Pressure generated by the left ventricle will be appreciably greater than the pressure generated by the right ventricle, since the existing pressure in the aorta will be so much higher. Nevertheless, both ventricles pump the same amount of blood. This quantity is referred to as stroke volume. Stroke volume will normally be in the range of 70–80 mL. Since ventricular systole began with an EDV of approximately 130 mL of blood, this means that there is still 50–60 mL of blood remaining in the ventricle following contraction. This volume of blood is known as the end systolic volume (ESV).

Ventricular diastole

Ventricular relaxation, or diastole, follows repolarization of the ventricles and is represented by the T wave of the ECG. It too is divided into two distinct phases and lasts approximately 430 ms.

During the early phase of ventricular diastole, as the ventricular muscle relaxes, pressure on the remaining blood within the ventricle begins to fall. When pressure within the ventricles drops below pressure in both the pulmonary trunk and aorta, blood flows back toward the heart, producing the dicrotic notch (small dip) seen in blood pressure tracings. The semilunar valves close to prevent backflow into the heart. Since the atrioventricular valves remain closed at this point, there is no change in the volume of blood in the ventricle, so the early phase of ventricular diastole is called the isovolumic ventricular relaxation phase, also called isovolumetric ventricular relaxation phase.

In the second phase of ventricular diastole, called late ventricular diastole, as the ventricular muscle relaxes, pressure on the blood within the ventricles drops even further. Eventually, it drops below the pressure in the atria. When this occurs, blood flows from the atria into the ventricles, pushing open the tricuspid and mitral valves. As pressure drops within the ventricles, blood flows from the major veins into the relaxed atria and from there into the ventricles. Both chambers are in diastole, the atrioventricular valves are open, and the semilunar valves remain closed. The cardiac cycle is complete.

Heart sounds

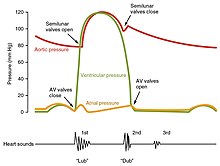
One of the simplest methods of assessing the heart's condition is to listen to it using a stethoscope. In a healthy heart, there are only two audible heart sounds, called S1 and S2. The first heart sound S1, is the sound created by the closing of the atrioventricular valves during ventricular contraction and is normally described as "lub". The second heart sound, S2, is the sound of the semilunar valves closing during ventricular diastole and is described as "dub". Each sound consists of two components, reflecting the slight difference in time as the two valves close. S2 may split into two distinct sounds, either as a result of inspiration or different valvular or cardiac problems. Additional heart sounds may also be present and these give rise to gallop rhythms. A third heart sound, S3 usually indicates an increase in ventricular blood volume. A fourth heart sound S4 is referred to as an atrial gallop and is produced by the sound of blood being forced into a stiff ventricle. The combined presence of S3 and S4 give a quadruple gallop.

The x-axis reflects time with a recording of the heart sounds. The y-axis represents pressure.

Heart murmurs are abnormal heart sounds which can be either pathological or benign and there are numerous kinds. Murmurs are graded by volume, from 1) the quietest, to 6) the loudest, and evaluated by their relationship to the heart sounds and position in the cardiac cycle. Phonocardiograms can record these sounds. Murmurs can result from narrowing (stenosis), regurgitation or insufficiency of any of the main heart valves but they can also result from a number of other disorders, including atrial and ventricular septal defects. One example of a murmur is Still's murmur, which presents a musical sound in children, has no symptoms and disappears in adolescence.

A different type of sound, a pericardial friction rub can be heard in cases of pericarditis where the inflamed membranes can rub together.

Heart rate

The resting heart rate of a newborn can be 120 beats per minute (bpm) and this gradually decreases until maturity and then gradually increases again with age. The adult resting heart rate ranges from 60 to 100 bpm. Exercise and fitness levels, age and basal metabolic rate can all affect the heart rate. An athlete's heart rate can be lower than 60 bpm. During exercise the rate can be 150 bpm with maximum rates reaching from 200 and 220 bpm.

Cardiovascular centres

Autonomic Innervation of the heart cardioaccelerator and cardioinhibitory areas.
The wave of depolarization in a normal sinus rhythm shows a stable resting HR. Following parasympathetic stimulation, HR slows. Following sympathetic stimulation, HR increases.

The normal sinus rhythm of the heart rate is generated by the SA node. It is also influenced by central factors through sympathetic and parasympathetic nerves of the two paired cardiovascular centres of the medulla oblongata. Activity is increased via sympathetic stimulation of the cardioaccelerator nerves, and inhibited via parasympathetic stimulation by the vagus nerve. During rest vagal stimulation normally predominates as, left unregulated, the SA node would initiate a sinus rhythm of approximately 100 bpm.

Both sympathetic and parasympathetic stimuli flow through the paired cardiac plexus near the base of the heart. Without any nervous stimulation, the SA node would establish a sinus rhythm of approximately 100 bpm. Since resting rates are considerably less than this, it becomes evident that parasympathetic stimulation normally slows HR. The cardioaccelerator center also sends additional fibers, forming the cardiac nerves via sympathetic ganglia (the cervical ganglia plus superior thoracic ganglia T1–T4) to both the SA and AV nodes, plus additional fibers to the atria and ventricles. The ventricles are more richly innervated by sympathetic fibers than parasympathetic fibers. Sympathetic stimulation causes the release of the neurotransmitter norepinephrine (also known as noradrenaline) at the neuromuscular junction of the cardiac nerves. This shortens the repolarization period, thus speeding the rate of depolarization and contraction, which results in an increased heartrate. It opens chemical or ligand-gated sodium and calcium ion channels, allowing an influx of positively charged ions. Norepinephrine binds to the beta–1 receptor. High blood pressure medications are used to block these receptors and so reduce the heart rate.

The cardiovascular centres receive input from a series of visceral receptors with impulses traveling through visceral sensory fibers within the vagus and sympathetic nerves via the cardiac plexus. Among these receptors are various proprioreceptors, baroreceptors, and chemoreceptors, plus stimuli from the limbic system which normally enable the precise regulation of heart function, via cardiac reflexes. Increased physical activity results in increased rates of firing by various proprioreceptors located in muscles, joint capsules, and tendons. The cardiovascular centres monitor these increased rates of firing, suppressing parasympathetic stimulation or increasing sympathetic stimulation as needed in order to increase blood flow.

Similarly, baroreceptors are stretch receptors located in the aortic sinus, carotid bodies, the venae cavae, and other locations, including pulmonary vessels and the right side of the heart itself. Rates of firing from the baroreceptors represent blood pressure, level of physical activity, and the relative distribution of blood. The cardiac centers monitor baroreceptor firing to maintain cardiac homeostasis, a mechanism called the baroreceptor reflex. With increased pressure and stretch, the rate of baroreceptor firing increases, and the cardiac centers decrease sympathetic stimulation and increase parasympathetic stimulation. As pressure and stretch decrease, the rate of baroreceptor firing decreases, and the cardiac centers increase sympathetic stimulation and decrease parasympathetic stimulation.

There is a similar reflex, called the atrial reflex or Bainbridge reflex, associated with varying rates of blood flow to the atria. Increased venous return stretches the walls of the atria where specialized baroreceptors are located. However, as the atrial baroreceptors increase their rate of firing and as they stretch due to the increased blood pressure, the cardiac center responds by increasing sympathetic stimulation and inhibiting parasympathetic stimulation to increase HR. The opposite is also true.

Factors influencing heart rate

In addition to the autonomic nervous system, other factors can affect this. These include epinephrine, norepinephrine, and thyroid hormones; levels of various ions including calcium, potassium, and sodium; body temperature; hypoxia; and pH balance .

Table 1: Major factors increasing heart rate and force of contraction
Factor Effect
Cardioaccelerator nerves Release of norepinephrine
Proprioreceptors Increased rates of firing during exercise
Chemoreceptors Decreased levels of O2; increased levels of H+, CO2, and lactic acid
Baroreceptors Decreased rates of firing, indicating falling blood volume/pressure
Limbic system Anticipation of physical exercise or strong emotions
Catecholamines Increased epinephrine and norepinephrine
Thyroid hormones Increased T3 and T4
Calcium Increased Ca2+
Potassium Decreased K+
Sodium Decreased Na+
Body temperature Increased body temperature
Nicotine and caffeine Stimulants, increasing heart rate
 
Table 2: Factors decreasing heart rate and force of contraction
Factor Effect
Cardioinhibitor nerves (vagus) Release of acetylcholine
Proprioreceptors Decreased rates of firing following exercise
Chemoreceptors Increased levels of O2; decreased levels of H+ and CO2
Baroreceptors Increased rates of firing, indicating higher blood volume/pressure
Limbic system Anticipation of relaxation
Catecholamines Decreased epinephrine and norepinephrine
Thyroid hormones Decreased T3 and T4
Calcium Decreased Ca2+
Potassium Increased K+
Sodium Increased Na+
Body temperature Decrease in body temperature

Factors that increase heart rate also trigger an increase in stroke volume. As with skeletal muscles the heart can increase in size and efficiency with exercise. Thus endurance athletes such as marathon runners may have a heart that has hypertrophied by up to 40%. The difference between maximum and minimum cardiac outputs is known as the cardiac reserve and this measures the residual capacity to pump blood. Heart rates may reach up to 185–195 in exercise, depending on how fit a person is.

Cardiac output

Cardiac output as shown on an ECG

Cardiac output (CO) is a measurement of the amount of blood pumped by each ventricle (stroke volume, SV) in one minute. To calculate this, multiply stroke volume (SV), by heart rate (HR), in beats per minute. It can be represented by the equation: CO = HR x SV

SV is normally measured using an echocardiogram to record end diastolic volume (EDV) and end systolic volume (ESV), and calculating the difference: SV = EDV – ESV. SV can also be measured using a specialized catheter, but this is an invasive procedure and far more dangerous to the patient. A mean SV for a resting 70-kg (150-lb) individual would be approximately 70 mL. There are several important variables, including size of the heart, physical and mental condition of the individual, sex, contractility, duration of contraction, preload or EDV, and afterload or resistance. Normal range for SV would be 55–100 mL. An average resting HR would be approximately 75 bpm but could range from 60 to 100 in some individuals. Using these numbers, (which refer to each ventricle, not both) the mean CO is 5.25 L/min, with a range of 4.0–8.0 L/min.

Major Factors Influencing Cardiac Output - Cardiac output is influenced by heart rate and stroke volume, both of which are also variable.

SVs are also used to calculate ejection fraction, which is the portion of the blood that is pumped or ejected from the heart with each contraction. To calculate ejection fraction, SV is divided by EDV. Despite the name, the ejection fraction is normally expressed as a percentage. Ejection fractions range from approximately 55–70 percent, with a mean of 58 percent.

Stroke volume

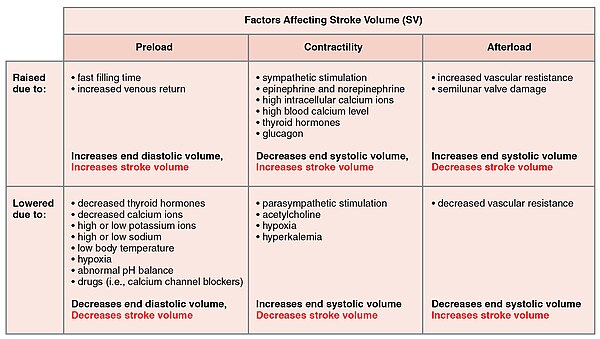
Major Factors Influencing Stroke Volume - Multiple factors affect preload, afterload, and contractility, and are the major considerations influencing SV.
 
Summary of Major Factors Influencing Cardiac Output - The primary factors influencing HR include autonomic innervation plus endocrine control. Not shown are environmental factors, such as electrolytes, metabolic products, and temperature. The primary factors controlling SV include preload, contractility, and afterload. Other factors such as electrolytes may be classified as either positive or negative inotropic agents.

Many of the factors that regulate the heart rate also affect cardiac function by altering the stroke volume. While a number of variables are involved, stroke volume is dependent upon the difference between end diastolic volume and end systolic volume. The three primary factors involved are preload, afterload and contractility.

Preload

Preload is another way of expressing EDV. Therefore, the greater the EDV, the greater the preload. A main factor is ventricular filling time. The faster the contractions are, the shorter the filling time and both the EDV and preload are lower.

The relationship between ventricular stretch and contraction has been stated in the Frank-Starling mechanism which says that the force of contraction is directly proportional to the initial length of muscle fibre. So that the greater the stretch of the ventricle the greater the contraction. Any sympathetic stimulation to the venous system will increase venous return to the heart and ventricular filling.

Afterload

The ventricles must develop a certain tension to pump blood against the resistance of the vascular system. This tension is called afterload. When the resistance is increased particularly due to stenotic valve damage the afterload must necessarily increase. A decrease in normal vascular resistance can also occur. Different cardiac responses operate to restore homeostasis of the pressure and blood flow.

Contractility

The ability of the myocardium to contract, (its contractility), controls the stroke volume which determines the end systolic volume. The greater the contraction the greater the stroke volume and the smaller the end systolic volume. Positive or negative inotropic factors via sympathetic and parasympathetic stimulation respectively, can increase or decrease the force of contractions. Sympathetic stimulation triggers the release of norepinephrine from the cardiac nerves and also stimulates the adrenal cortex to secrete both epinephrine and norepinephrine. These secretions increase the heart rate, subsequent metabolic rate and contractility. Parasympathetic stimulation stimulates the release of acetylcholine (ACh) from the vagus nerve which decreases contractility, and stroke volume which increases end systolic volume.

Several synthetic drugs have been developed that can act either as a stimulant or inhibitor inotrope. The stimulant inotropes, such as Digoxin, cause higher concentrations of calcium ions which increase contractility. Excess calcium (hypercalcemia) is also a positive inotrope. Drugs that are negative inotropes include beta blockers and calcium channel blockers. Hypoxia, acidosis, hyperkalemia are also negative inotropic agents.

Table 3: Cardiac response to decreasing blood flow and pressure due to decreasing cardiac output

Baroreceptors (aorta, carotid arteries, venae cavae, and atria) Chemoreceptors (both central nervous system and in proximity to baroreceptors)
Sensitive to Decreasing stretch Decreasing O2 and increasing CO2, H+, and lactic acid
Target Parasympathetic stimulation suppressed Sympathetic stimulation increased
Response of heart Increasing heart rate and increasing stroke volume Increasing heart rate and increasing stroke volume
Overall effect Increasing blood flow and pressure due to increasing cardiac output; hemostasis restored Increasing blood flow and pressure due to increasing cardiac output; hemostasis restored
 
Table 4: Cardiac response to increasing blood flow and pressure due to increasing cardiac output

Baroreceptors (aorta, carotid arteries, venae cavae, and atria) Chemoreceptors (both central nervous system and in proximity to baroreceptors)
Sensitive to Increasing stretch Increasing O2 and decreasing CO2, H+, and lactic acid
Target Parasympathetic stimulation increased Sympathetic stimulation suppressed
Response of heart Decreasing heart rate and decreasing stroke volume Decreasing heart rate and decreasing stroke volume
Overall effect Decreasing blood flow and pressure due to decreasing cardiac output; hemostasis restored Decreasing blood flow and pressure due to decreasing cardiac output; hemostasis restored

Introduction to entropy

From Wikipedia, the free encyclopedia https://en.wikipedia.org/wiki/Introduct...