Search This Blog

Friday, December 13, 2024

Human ecology

From Wikipedia, the free encyclopedia
Part of the built environment – suburban tract housing in Colorado Springs, Colorado

Human ecology is an interdisciplinary and transdisciplinary study of the relationship between humans and their natural, social, and built environments. The philosophy and study of human ecology has a diffuse history with advancements in ecology, geography, sociology, psychology, anthropology, zoology, epidemiology, public health, and home economics, among others.

Historical development

The roots of ecology as a broader discipline can be traced to the Greeks and a lengthy list of developments in natural history science. Ecology also has notably developed in other cultures. Traditional knowledge, as it is called, includes the human propensity for intuitive knowledge, intelligent relations, understanding, and for passing on information about the natural world and the human experience. The term ecology was coined by Ernst Haeckel in 1866 and defined by direct reference to the economy of nature.

Like other contemporary researchers of his time, Haeckel adopted his terminology from Carl Linnaeus where human ecological connections were more evident. In his 1749 publication, Specimen academicum de oeconomia naturae, Linnaeus developed a science that included the economy and polis of nature. Polis stems from its Greek roots for a political community (originally based on the city-states), sharing its roots with the word police in reference to the promotion of growth and maintenance of good social order in a community. Linnaeus was also the first to write about the close affinity between humans and primates. Linnaeus presented early ideas found in modern aspects to human ecology, including the balance of nature while highlighting the importance of ecological functions (ecosystem services or natural capital in modern terms): "In exchange for performing its function satisfactorily, nature provided a species with the necessaries of life" The work of Linnaeus influenced Charles Darwin and other scientists of his time who used Linnaeus' terminology (i.e., the economy and polis of nature) with direct implications on matters of human affairs, ecology, and economics.

Ecology is not just biological, but a human science as well. An early and influential social scientist in the history of human ecology was Herbert Spencer. Spencer was influenced by and reciprocated his influence onto the works of Charles Darwin. Herbert Spencer coined the phrase "survival of the fittest", he was an early founder of sociology where he developed the idea of society as an organism, and he created an early precedent for the socio-ecological approach that was the subsequent aim and link between sociology and human ecology.

Human ecology is the discipline that inquires into the patterns and process of interaction of humans with their environments. Human values, wealth, life-styles, resource use, and waste, etc. must affect and be affected by the physical and biotic environments along urban-rural gradients. The nature of these interactions is a legitimate ecological research topic and one of increasing importance.

The history of human ecology has strong roots in geography and sociology departments of the late 19th century. In this context a major historical development or landmark that stimulated research into the ecological relations between humans and their urban environments was founded in George Perkins Marsh's book Man and Nature; or, physical geography as modified by human action, which was published in 1864. Marsh was interested in the active agency of human-nature interactions (an early precursor to urban ecology or human niche construction) in frequent reference to the economy of nature.

In 1894, an influential sociologist at the University of Chicago named Albion W. Small collaborated with sociologist George E. Vincent and published a "'laboratory guide' to studying people in their 'every-day occupations.'" This was a guidebook that trained students of sociology how they could study society in a way that a natural historian would study birds. Their publication "explicitly included the relation of the social world to the material environment."

The first English-language use of the term "ecology" is credited to American chemist and founder of the field of home economics, Ellen Swallow Richards. Richards first introduced the term as "oekology" in 1892, and subsequently developed the term "human ecology".

The term "human ecology" first appeared in Ellen Swallow Richards' 1907 Sanitation in Daily Life, where it was defined as "the study of the surroundings of human beings in the effects they produce on the lives of men". Richard's use of the term recognized humans as part of rather than separate from nature. The term made its first formal appearance in the field of sociology in the 1921 book "Introduction to the Science of Sociology", published by Robert E. Park and Ernest W. Burgess (also from the sociology department at the University of Chicago). Their student, Roderick D. McKenzie helped solidify human ecology as a sub-discipline within the Chicago school. These authors emphasized the difference between human ecology and ecology in general by highlighting cultural evolution in human societies.

Human ecology has a fragmented academic history with developments spread throughout a range of disciplines, including: home economics, geography, anthropology, sociology, zoology, and psychology. Some authors have argued that geography is human ecology. Much historical debate has hinged on the placement of humanity as part or as separate from nature. In light of the branching debate of what constitutes human ecology, recent interdisciplinary researchers have sought a unifying scientific field they have titled coupled human and natural systems that "builds on but moves beyond previous work (e.g., human ecology, ecological anthropology, environmental geography)." Other fields or branches related to the historical development of human ecology as a discipline include cultural ecology, urban ecology, environmental sociology, and anthropological ecology. Even though the term ‘human ecology' was popularized in the 1920s and 1930s, studies in this field had been conducted since the early nineteenth century in England and France.

In 1969, College of the Atlantic in Bar Harbor, Maine, was founded as a school of human ecology. Since its first enrolled class of 32 students, the college has grown into a small liberal arts institution with about 350 students and 35 full-time faculty. Every graduate receives a degree in human ecology, an interdisciplinary major which each student designs to fit their own interests and needs.

Biological ecologists have traditionally been reluctant to study human ecology, gravitating instead to the allure of wild nature. Human ecology has a history of focusing attention on humans' impact on the biotic world. Paul Sears was an early proponent of applying human ecology, addressing topics aimed at the population explosion of humanity, global resource limits, pollution, and published a comprehensive account on human ecology as a discipline in 1954. He saw the vast "explosion" of problems humans were creating for the environment and reminded us that "what is important is the work to be done rather than the label." "When we as a profession learn to diagnose the total landscape, not only as the basis of our culture, but as an expression of it, and to share our special knowledge as widely as we can, we need not fear that our work will be ignored or that our efforts will be unappreciated." Recently, the Ecological Society of America has added a Section on Human Ecology, indicating the increasing openness of biological ecologists to engage with human dominated systems and the acknowledgement that most contemporary ecosystems have been influenced by human action.

Overview

Human ecology has been defined as a type of analysis applied to the relations in human beings that was traditionally applied to plants and animals in ecology. Toward this aim, human ecologists (which can include sociologists) integrate diverse perspectives from a broad spectrum of disciplines covering "wider points of view". In its 1972 premier edition, the editors of Human Ecology: An Interdisciplinary Journal gave an introductory statement on the scope of topics in human ecology. Their statement provides a broad overview on the interdisciplinary nature of the topic:

  • Genetic, physiological, and social adaptation to the environment and to environmental change;
  • The role of social, cultural, and psychological factors in the maintenance or disruption of ecosystems;
  • Effects of population density on health, social organization, or environmental quality;
  • New adaptive problems in urban environments;
  • Interrelations of technological and environmental changes;
  • The development of unifying principles in the study of biological and cultural adaptation;
  • The genesis of maladaptions in human biological and cultural evolution;
  • The relation of food quality and quantity to physical and intellectual performance and to demographic change;
  • The application of computers, remote sensing devices, and other new tools and techniques

Forty years later in the same journal, Daniel G. Bates (2012) notes lines of continuity in the discipline and the way it has changed:

Today there is greater emphasis on the problems facing individuals and how actors deal with them with the consequence that there is much more attention to decision-making at the individual level as people strategize and optimize risk, costs and benefits within specific contexts. Rather than attempting to formulate a cultural ecology or even a specifically "human ecology" model, researchers more often draw on demographic, economic and evolutionary theory as well as upon models derived from field ecology.

While theoretical discussions continue, research published in Human Ecology Review suggests that recent discourse has shifted toward applying principles of human ecology. Some of these applications focus instead on addressing problems that cross disciplinary boundaries or transcend those boundaries altogether. Scholarship has increasingly tended away from Gerald L. Young's idea of a "unified theory" of human ecological knowledge—that human ecology may emerge as its own discipline—and more toward the pluralism best espoused by Paul Shepard: that human ecology is healthiest when "running out in all directions". But human ecology is neither anti-discipline nor anti-theory, rather it is the ongoing attempt to formulate, synthesize, and apply theory to bridge the widening schism between man and nature. This new human ecology emphasizes complexity over reductionism, focuses on changes over stable states, and expands ecological concepts beyond plants and animals to include people.

Application to epidemiology and public health

The application of ecological concepts to epidemiology has similar roots to those of other disciplinary applications, with Carl Linnaeus having played a seminal role. However, the term appears to have come into common use in the medical and public health literature in the mid-twentieth century. This was strengthened in 1971 by the publication of Epidemiology as Medical Ecology, and again in 1987 by the publication of a textbook on Public Health and Human Ecology. An "ecosystem health" perspective has emerged as a thematic movement, integrating research and practice from such fields as environmental management, public health, biodiversity, and economic development. Drawing in turn from the application of concepts such as the social-ecological model of health, human ecology has converged with the mainstream of global public health literature.

Connection to home economics

In addition to its links to other disciplines, human ecology has a strong historical linkage to the field of home economics through the work of Ellen Swallow Richards, among others. However, as early as the 1960s, a number of universities began to rename home economics departments, schools, and colleges as human ecology programs. In part, this name change was a response to perceived difficulties with the term home economics in a modernizing society, and reflects a recognition of human ecology as one of the initial choices for the discipline which was to become home economics. Current human ecology programs include the University of Wisconsin School of Human Ecology, the Cornell University College of Human Ecology, and the University of Alberta's Department of Human Ecology, among others.

Niche of the Anthropocene

Perhaps the most important implication involves our view of human society. Homo sapiens is not an external disturbance, it is a keystone species within the system. In the long term, it may not be the magnitude of extracted goods and services that will determine sustainability. It may well be our disruption of ecological recovery and stability mechanisms that determines system collapse.

Changes to the Earth by human activities have been so great that a new geological epoch named the Anthropocene has been proposed. The human niche or ecological polis of human society, as it was known historically, has created entirely new arrangements of ecosystems as we convert matter into technology. Human ecology has created anthropogenic biomes (called anthromes). The habitats within these anthromes reach out through our road networks to create what has been called technoecosystems containing technosols. Technodiversity exists within these technoecosystems. In direct parallel to the concept of the ecosphere, human civilization has also created a technosphere. The way that the human species engineers or constructs technodiversity into the environment threads back into the processes of cultural and biological evolution, including the human economy.

Ecosystem services

A bumblebee pollinating a flower, one example of an ecosystem service

Policy and human institutions should rarely assume that human enterprise is benign. A safer assumption holds that human enterprise almost always exacts an ecological toll - a debit taken from the ecological commons.

The ecosystems of planet Earth are coupled to human environments. Ecosystems regulate the global geophysical cycles of energy, climate, soil nutrients, and water that in turn support and grow natural capital (including the environmental, physiological, cognitive, cultural, and spiritual dimensions of life). Ultimately, every manufactured product in human environments comes from natural systems. Ecosystems are considered common-pool resources because ecosystems do not exclude beneficiaries and they can be depleted or degraded. For example, green space within communities provides sustainable health services that reduce mortality and regulate the spread of vector-borne disease. Research shows that people who are more engaged with and who have regular access to natural areas benefit from lower rates of diabetes, heart disease and psychological disorders. These ecological health services are regularly depleted through urban development projects that do not factor in the common-pool value of ecosystems.

The ecological commons delivers a diverse supply of community services that sustains the well-being of human society. The Millennium Ecosystem Assessment, an international UN initiative involving more than 1,360 experts worldwide, identifies four main ecosystem service types having 30 sub-categories stemming from natural capital. The ecological commons includes provisioning (e.g., food, raw materials, medicine, water supplies), regulating (e.g., climate, water, soil retention, flood retention), cultural (e.g., science and education, artistic, spiritual), and supporting (e.g., soil formation, nutrient cycling, water cycling) services.

Sixth mass extinction

Global assessments of biodiversity indicate that the current epoch, the Holocene (or Anthropocene) is a sixth mass extinction. Species loss is accelerating at 100–1000 times faster than average background rates in the fossil record. The field of conservation biology involves ecologists that are researching, confronting, and searching for solutions to sustain the planet's ecosystems for future generations.

"Human activities are associated directly or indirectly with nearly every aspect of the current extinction spasm."

Nature is a resilient system. Ecosystems regenerate, withstand, and are forever adapting to fluctuating environments. Ecological resilience is an important conceptual framework in conservation management and it is defined as the preservation of biological relations in ecosystems that persevere and regenerate in response to disturbance over time.

However, persistent, systematic, large and non-random disturbance caused by the niche-constructing behavior of human beings, including habitat conversion and land development, has pushed many of the Earth's ecosystems to the extent of their resilience thresholds. Three planetary thresholds have already been crossed, including biodiversity loss, climate change, and nitrogen cycles. These biophysical systems are ecologically interrelated and are naturally resilient, but human civilization has transitioned the planet to an Anthropocene epoch and the ecological state of the Earth is deteriorating rapidly, to the detriment of humanity. The world's fisheries and oceans, for example, are facing dire challenges as the threat of global collapse appears imminent, with serious ramifications for the well-being of humanity.

While the Anthropocene is yet to be classified as an official epoch, current evidence suggest that "an epoch-scale boundary has been crossed within the last two centuries." The ecology of the planet is further threatened by global warming, but investments in nature conservation can provide a regulatory feedback to store and regulate carbon and other greenhouse gases.

Ecological footprint

While we are used to thinking of cities as geographically discrete places, most of the land "occupied" by their residents lies far beyond their borders. The total area of land required to sustain an urban region (its "ecological footprint") is typically at least an order of magnitude greater than that contained within municipal boundaries or the associated built-up area.

In 1992, William Rees developed the ecological footprint concept. The ecological footprint and its close analog the water footprint has become a popular way of accounting for the level of impact that human society is imparting on the Earth's ecosystems. All indications are that the human enterprise is unsustainable as the footprint of society is placing too much stress on the ecology of the planet. The WWF 2008 living planet report and other researchers report that human civilization has exceeded the bio-regenerative capacity of the planet. This means that the footprint of human consumption is extracting more natural resources than can be replenished by ecosystems around the world.

Ecological economics

Ecological economics is an economic science that extends its methods of valuation onto nature in an effort to address the inequity between market growth and biodiversity loss.[68] Natural capital is the stock of materials or information stored in biodiversity that generates services that can enhance the welfare of communities. Population losses are the more sensitive indicator of natural capital than are species extinction in the accounting of ecosystem services. The prospect for recovery in the economic crisis of nature is grim. Populations, such as local ponds and patches of forest are being cleared away and lost at rates that exceed species extinctions. The mainstream growth-based economic system adopted by governments worldwide does not include a price or markets for natural capital. This type of economic system places further ecological debt onto future generations.

Many human-nature interactions occur indirectly due to the production and use of human-made (manufactured and synthesized) products, such as electronic appliances, furniture, plastics, airplanes, and automobiles. These products insulate humans from the natural environment, leading them to perceive less dependence on natural systems than is the case, but all manufactured products ultimately come from natural systems.

Human societies are increasingly being placed under stress as the ecological commons is diminished through an accounting system that has incorrectly assumed "... that nature is a fixed, indestructible capital asset." The current wave of threats, including massive extinction rates and concurrent loss of natural capital to the detriment of human society, is happening rapidly. This is called a biodiversity crisis, because 50% of the worlds species are predicted to go extinct within the next 50 years. Conventional monetary analyses are unable to detect or deal with these sorts of ecological problems. Multiple global ecological economic initiatives are being promoted to solve this problem. For example, governments of the G8 met in 2007 and set forth The Economics of Ecosystems and Biodiversity (TEEB) initiative:

In a global study we will initiate the process of analyzing the global economic benefit of biological diversity, the costs of the loss of biodiversity and the failure to take protective measures versus the costs of effective conservation.

The work of Kenneth E. Boulding is notable for building on the integration between ecology and its economic origins. Boulding drew parallels between ecology and economics, most generally in that they are both studies of individuals as members of a system, and indicated that the "household of man" and the "household of nature" could somehow be integrated to create a perspective of greater value.

Interdisciplinary approaches

Human ecology may be defined: (1) from a bio-ecological standpoint as the study of man as the ecological dominant in plant and animal communities and systems; (2) from a bio-ecological standpoint as simply another animal affecting and being affected by his physical environment; and (3) as a human being, somehow different from animal life in general, interacting with physical and modified environments in a distinctive and creative way. A truly interdisciplinary human ecology will most likely address itself to all three.

Human ecology expands functionalism from ecology to the human mind. People's perception of a complex world is a function of their ability to be able to comprehend beyond the immediate, both in time and in space. This concept manifested in the popular slogan promoting sustainability: "think global, act local." Moreover, people's conception of community stems from not only their physical location but their mental and emotional connections and varies from "community as place, community as way of life, or community of collective action."

In the last century, the world has faced several challenges, including environmental degradation, public health issues, and climate change. Addressing these issues requires interdisciplinary and transdisciplinary interventions, allowing for a comprehensive understanding of the intricate connections between human societies and the environment. In the early years, human ecology was still deeply enmeshed in its respective disciplines: geography, sociology, anthropology, psychology, and economics. Scholars through the 1970s until present have called for a greater integration between all of the scattered disciplines that has each established formal ecological research.

In art

While some of the early writers considered how art fit into a human ecology, it was Sears who posed the idea that in the long run human ecology will in fact look more like art. Bill Carpenter (1986) calls human ecology the "possibility of an aesthetic science", renewing dialogue about how art fits into a human ecological perspective. According to Carpenter, human ecology as an aesthetic science counters the disciplinary fragmentation of knowledge by examining human consciousness.

In education

While the reputation of human ecology in institutions of higher learning is growing, there is no human ecology at the primary or secondary education levels, with one notable exception, Syosset High School, in Long Island, New York. Educational theorist Sir Kenneth Robinson has called for diversification of education to promote creativity in academic and non-academic (i.e., educate their "whole being") activities to implement a "new conception of human ecology".

Bioregionalism and urban ecology

In the late 1960s, ecological concepts started to become integrated into the applied fields, namely architecture, landscape architecture, and planning. Ian McHarg called for a future when all planning would be "human ecological planning" by default, always bound up in humans' relationships with their environments. He emphasized local, place-based planning that takes into consideration all the "layers" of information from geology to botany to zoology to cultural history. Proponents of the new urbanism movement, like James Howard Kunstler and Andres Duany, have embraced the term human ecology as a way to describe the problem of—and prescribe the solutions for—the landscapes and lifestyles of an automobile oriented society. Duany has called the human ecology movement to be "the agenda for the years ahead." While McHargian planning is still widely respected, the landscape urbanism movement seeks a new understanding between human and environment relations. Among these theorists is Frederich Steiner, who published Human Ecology: Following Nature's Lead in 2002 which focuses on the relationships among landscape, culture, and planning. The work highlights the beauty of scientific inquiry by revealing those purely human dimensions which underlie our concepts of ecology. While Steiner discusses specific ecological settings, such as cityscapes and waterscapes, and the relationships between socio-cultural and environmental regions, he also takes a diverse approach to ecology—considering even the unique synthesis between ecology and political geography. Deiter Steiner's 2003 Human Ecology: Fragments of Anti-fragmentary view of the world is an important expose of recent trends in human ecology. Part literature review, the book is divided into four sections: "human ecology", "the implicit and the explicit", "structuration", and "the regional dimension". Much of the work stresses the need for transciplinarity, antidualism, and wholeness of perspective.

Climate change in Antarctica

From Wikipedia, the free encyclopedia
Antarctic surface ice layer temperature trends between 1981 and 2007, based on thermal infrared observations made by a series of NOAA satellite sensors.

Climate change caused by greenhouse gas emissions from human activities occurs everywhere on Earth, and while Antarctica is less vulnerable to it than any other continent, climate change in Antarctica has been observed. Since 1959, there has been an average temperature increase of >0.05 °C/decade since 1957 across the continent, although it had been uneven. West Antarctica warmed by over 0.1 °C/decade from the 1950s to the 2000s, and the exposed Antarctic Peninsula has warmed by 3 °C (5.4 °F) since the mid-20th century. The colder, stabler East Antarctica had been experiencing cooling until the 2000s. Around Antarctica, the Southern Ocean has absorbed more oceanic heat than any other ocean, and has seen strong warming at depths below 2,000 m (6,600 ft). Around the West Antarctic, the ocean has warmed by 1 °C (1.8 °F) since 1955.

The warming of the Southern Ocean around Antarctica has caused the weakening or collapse of ice shelves, which float just offshore of glaciers and stabilize them. Many coastal glaciers have been losing mass and retreating, causing net-annual ice loss across Antarctica, although the East Antarctic ice sheet continues to gain ice inland. By 2100, net ice loss from Antarctica is expected to add about 11 cm (5 in) to global sea level rise. Marine ice sheet instability may cause West Antarctica to contribute tens of centimeters more if it is triggered before 2100. With higher warming, instability would be much more likely, and could double global, 21st-century sea-level rise.

The fresh, 1100-1500 billion tons (GT) per year of meltwater from the ice dilutes the saline Antarctic bottom water, weakening the lower cell of the Southern Ocean overturning circulation (SOOC). According to some research, a full collapse of the SOOC may occur a between 1.7 °C (3.1 °F) and 3 °C (5.4 °F) of global warming, although the full effects are expected to occur over multiple centuries; these include less precipitation in the Southern Hemisphere but more in the Northern Hemisphere, an eventual decline of fisheries in the Southern Ocean and a potential collapse of certain marine ecosystems. While many Antarctic species remain undiscovered, there are documented increases in Antarctic flora, and large fauna such as penguins are already having difficulty retaining suitable habitat. On ice-free land, permafrost thaws release greenhouse gases and formerly frozen pollution.

The West Antarctic ice sheet is likely to completely melt unless temperatures are reduced by 2 °C (3.6 °F) below 2020 levels. The loss of this ice sheet would take between 2,000 and 13,000 years, although several centuries of high greenhouse emissions could shorten this time to 500 years. A sea-level rise of 3.3 m (10 ft 10 in) would occur if the ice sheet collapses, leaving ice caps on the mountains, and 4.3 m (14 ft 1 in) if those ice caps also melt. Isostatic rebound may contribute an additional 1 m (3 ft 3 in) to global sea levels over another 1,000 years. The far-stabler East Antarctic ice sheet may only cause a sea-level rise of 0.5 m (1 ft 8 in) – 0.9 m (2 ft 11 in) from the current level of warming, a small fraction of the 53.3 m (175 ft) contained in the full ice sheet. With global warming of around 3 °C (5.4 °F), vulnerable areas like Wilkes Basin and Aurora Basin may collapse over around 2,000 years, potentially adding up to 6.4 m (21 ft 0 in) to sea levels. The complete melting and disappearance of the East Antarctic ice sheet would require at least 10,000 years and would only occur if global warming reaches 5 °C (9.0 °F) to 10 °C (18 °F).

Temperature and weather changes

Parts of East Antarctica (marked in blue) are currently the only place on Earth to regularly experience negative greenhouse effect during certain months of the year. At greater warming levels, this effect is likely to disappear due to increasing concentrations of water vapor over Antarctica

Antarctica is the coldest, driest continent on Earth, and has the highest average elevation. Antarctica's dryness means the air contains little water vapor and conducts heat poorly. The Southern Ocean surrounding the continent is far more effective at absorbing heat than any other ocean. The presence of extensive, year-around sea ice, which has a high albedo (reflectivity), adds to the albedo of the ice sheets' own bright, white surface. Antarctica's coldness means it is the only place on Earth where an atmospheric temperature inversion occurs every winter; elsewhere on Earth, the atmosphere is at its warmest near the surface and becomes cooler as elevation increases. During the Antarctic winter, the surface of central Antarctica becomes cooler than middle layers of the atmosphere; this means greenhouse gases trap heat in the middle atmosphere, and reduce its flow toward the surface and toward space, rather than preventing the flow of heat from the lower atmosphere to the upper layers. This effect lasts until the end of the Antarctic winter. Early climate models predicted temperature trends over Antarctica would emerge more slowly and be more subtle than those elsewhere.

There were fewer than twenty permanent weather stations across the continent and only two in the continent's interior. Automatic weather stations were deployed relatively late, and their observational record was brief for much of the 20th century satellite temperature measurements began in 1981 and are typically limited to cloud-free conditions. Thus, datasets representing the entire continent only began to appear by the very end of the 20th century. The exception was the Antarctic Peninsula, where warming was pronounced and well-documented; it was eventually found to have warmed by 3 °C (5.4 °F) since the mid 20th century. Based on this limited data, several papers published in the early 2000s said there had been an overall cooling over continental Antarctica outside the Peninsula.

Antarctic surface temperature trends, in °C/decade. Red represents areas where temperatures have increased the most since the 1950s.

A 2002 analysis led by Peter Doran received widespread media coverage after it also indicated stronger cooling than warming between 1966 and 2000, and found the McMurdo Dry Valleys in East Antarctica had experienced cooling of 0.7 °C per decade, a local trend that was confirmed by subsequent research at McMurdo. Multiple journalists said these findings were "contradictory" to global warming, even though the paper noted the limited data and found warming over 42% of the continent. What became known as the Antarctic Cooling Controversy received further attention in 2004, when Michael Crichton wrote that novel State of Fear, which said a conspiracy among climate scientists to make up global warming, and said Doran's study definitively proved there was no warming in Antarctica outside of the Peninsula. Relatively few scientists responded to the book at the time, but it was mentioned in a 2006 US Senate hearing in support of climate change denial. Peter Doran published a statement in The New York Times decrying the misinterpretation of his work. The British Antarctic Survey and NASA also issued statements affirming the strength of climate science after the hearing.

By 2009, researchers were able to combine historical weather-station data with satellite measurements to create consistent temperature records going back to 1957 that demonstrated warming of >0.05 °C/decade since 1957 across the continent, with cooling in East Antarctica offset by the average temperature increase of at least 0.176 ± 0.06 °C per decade in West Antarctica. Subsequent research confirmed clear warming over West Antarctica in the 20th century, with the only uncertainty being the magnitude. During 2012-2013, estimates based on WAIS Divide ice cores and revised temperature records from Byrd Station suggested a much-larger West-Antarctica warming of 2.4 °C (4.3 °F) since 1958, or around 0.46 °C (0.83 °F) per decade, although there has been uncertainty about it. In 2022, a study narrowed the warming of the Central area of the West Antarctic Ice Sheet between 1959 and 2000 to 0.31 °C (0.56 °F) per decade, and conclusively attributed it to increases in greenhouse gas concentrations caused by human activity.

East Antarctica cooled in the 1980s and 1990s, even as West Antarctica warmed (left-hand side). This trend largely reversed in 2000s and 2010s (right-hand side).

Between 2000 and 2020, local changes in atmospheric circulation patterns like the Interdecadal Pacific Oscillation (IPO) and the Southern Annular Mode (SAM) slowed or partially reversed the warming of West Antarctica , with the Antarctic Peninsula experiencing cooling from 2002.

While a variability in those patterns is natural, ozone depletion had also led the SAM to be stronger than it had been in the past 600 years of observations. Studies predicted a reversal in the SAM once the ozone layer began to recover following the Montreal Protocol, starting from 2002, and these changes are consistent with their predictions. As these patterns reversed, the East Antarctica interior demonstrated clear warming over those two decades. In particular, the South Pole warmed by 0.61 ± 0.34 °C per decade between 1990 and 2020, which is three times the global average. The Antarctica-wide warming trend continued after 2000, and in February 2020, the continent recorded its highest temperature of 18.3 °C, which is one degree higher than the previous record of 17.5 °C in March 2015.

Models predict under the most intense climate change scenario, known as RCP8.5, Antarctic temperatures will rise by 4 °C (7.2 °F) on average by 2100; this rise will be accompanied by a 30% increase in precipitation and a 30% decrease in sea ice. RCPs were developed in the late 2000s, and early 2020s research considers RCP8.5 much less likely than the more-moderate scenarios like RCP 4.5, which lie in between the worst-case scenario and the Paris Agreement goals.

Effects on ocean currents

Even under the most intense climate change scenario, which is currently considered unlikely, the Southern Ocean would continue to take up an increasing amount of carbon dioxide (left) and heat (middle) during the 21st century. However, it would take up a smaller fraction of heat (right) and emissions per every additional degree of warming when compared to now.

Between 1971 and 2018, over 90% of thermal energy from global heating entered the oceans. The Southern Ocean absorbs the most heat; after 2005, it accounted for between 67% and 98% of all heat entering the oceans. The temperature in the ocean's upper layer in West Antarctica has warmed by 1 °C (1.8 °F) since 1955, and the Antarctic Circumpolar Current (ACC) is also warming faster than the average. It is also a highly important carbon sink. These properties are connected to the Southern Ocean overturning circulation (SOOC), one half of the global thermohaline circulation. It is important estimates on when global warming will reach 2 °C (3.6 °F) – inevitable in all scenarios where greenhouse gas emissions have not been significantly lowered – depend on the strength of the circulation more than any factor other than the overall emissions.

Since the 1970s, the upper cell of the circulation has strengthened, while the lower cell weakened.

The overturning circulation has two parts; the smaller upper cell, which is most-strongly affected by winds and precipitation, and the larger lower cell that is defined by the temperature and salinity of Antarctic bottom water. Since the 1970s, the upper cell has strengthened by 50-60% while the lower cell has weakened by 10-20%. Some of this was due to the natural cycle of Interdecadal Pacific Oscillation (IPO) but there is a clear effect of climate change, because it alters winds and precipitation through shifts in the Southern Annular Mode (SAM) pattern. Fresh meltwater from the erosion of the West Antarctic ice sheet dilutes the more-saline Antarctic bottom water, which flows at a rate of 1100-1500 billion tons (GT) per year. During the 2010s, a temporary reduction in ice-shelf melting in West Antarctica allowed for the partial recovery of Antarctic bottom water and the lower cell of the circulation. Greater melting and further decline of the circulation is expected in the future.

As bottom water weakens while the flow of warmer, fresher waters strengthens near the surface, the surface waters become more buoyant, and less likely to sink and mix with the lower layers, increasing ocean stratification. One study says the strength of the circulation would halve by 2050 under the worst climate-change scenario, with greater losses occurring afterwards. Paleoclimate evidence shows the entire circulation has significantly weakened or completely collapsed in the past; preliminary research says such a collapse may become likely once global warming reaches between 1.7 °C (3.1 °F) and 3 °C (5.4 °F), but this estimate is much-less certain than for the majority of tipping points in the climate system. Such a collapse would be prolonged; one estimate says it would occur before 2300. As with the better-studied Atlantic meridional overturning circulation (AMOC), a major slowing or collapse of the SOOC would have substantial regional and global effects. Some likely effects include a decline in precipitation in Southern Hemisphere countries like Australia, a corresponding increase in precipitation in the Northern Hemisphere, and an eventual decline of fisheries in the Southern Ocean, which could lead to a potential collapse of some marine ecosystems. These effects are expected to occur over centuries, but there has been limited research to date and few specifics are currently known.

Effects on the cryosphere

Observed changes in ice mass

Contrasting temperature trends across parts of Antarctica mean some locations, particularly at the coasts, lose mass while locations further inland continue to gain mass. These contrasting trends and the remoteness of the region make estimating an average trend difficult. In 2018, a systematic review of all previous studies and data by the Ice Sheet Mass Balance Inter-comparison Exercise (IMBIE) estimated an increase in the West Antarctic ice sheet from 53 ± 29 Gt (gigatonnes) in 1992 to 159 ± 26 Gt in the final five years of the study. On the Antarctic Peninsula, the study estimated a loss of 20 ± 15 Gt per year with an increase in loss of roughly 15 Gt per year after 2000, a significant quantity of which was the loss of ice shelves. The review's overall estimate was that Antarctica lost 2,720 ± 1,390 gigatons of ice from 1992 to 2017, averaging 109 ± 56 Gt per year. This would amount to 7.6 mm (0.30 in) of sea-level rise. A 2021 analysis of data from four research satellite systems – Envisat, European Remote-Sensing Satellite, GRACE and GRACE-FO, and ICESat – indicated an annual mass loss of about 12 Gt from 2012 to 2016 due to much-greater ice gain in East Antarctica than earlier estimated, which offset most of the losses from West Antarctica. The East Antarctic ice sheet can still gain mass despite warming because effects of climate change on the water cycle increase precipitation over its surface, which then freezes and helps to accrete more ice.

Black carbon pollution

A private Il-76 airplane landing onto a ice runway at Union Glacier (upper-left), which causes black carbon concentrations to increase in the surrounding snow (right), as observed through sample collection (lower-left)

Black carbon from incomplete fuel combustion is carried long distances by wind. If it reaches Antarctica, black carbon accumulates on snow and ice, reducing the reflectivity and causing it to absorb more energy. This accelerates melting and can create an ice-albedo feedback loop in which meltwater itself absorbs more heat from sunlight. Due to its remoteness, Antarctica has the cleanest snow in the world, and some research says the effects of black carbon across West and East Antarctica is minimal with an albedo reduction of about 0.5% in one 47-year ice core.

The highest concentrations of black carbon are found on the Antarctic Peninsula, where human activity is higher than elsewhere. Black carbon deposits near common tourist sites and research stations increase summer seasonal melting by between about 5 to 23 kg (11 to 51 lb) of snow per m2.

21st-century ice loss and sea-level rise

An illustration of the theory behind marine ice sheet and marine ice cliff instabilities.

By 2100, net ice loss from Antarctica is expected to add about 11 cm (4.3 in) to global sea-level rise. Other processes may cause West Antarctica to contribute more to sea-level rise. Marine ice-sheet instability is the potential for warm water currents to enter between the seafloor and the base of the ice sheet once the sheet is no longer heavy enough to displace such flows. Marine ice-cliff instability may cause ice cliffs taller than 100 m (330 ft) to collapse under their own weight once they are no longer buttressed by ice shelves. This process has never been observed and it only occurs in some models. By 2100, these processes may increase sea-level rise caused by Antarctica to 41 cm (16 in) under the low-emission scenario and by 57 cm (22 in) under the high-emission scenario.

Some scientists have given greater estimates but all agree melting in Antarctica would have a greater impact and would be much more likely to occur under higher warming scenarios, where it may double the overall 21st-century sea-level rise to 2 m (7 ft) or more. According to one study, if the Paris Agreement is followed and global warming is limited to 2 °C (3.6 °F), the loss of ice in Antarctica will continue at the 2020 rate for the rest of the 21st century, but if a trajectory leading to 3 °C (5.4 °F) is followed, Antarctica ice loss will accelerate after 2060 and start adding 0.5 cm (0.20 in) per year to global sea levels by 2100.

Long-term sea level rise

If countries cut greenhouse gas emissions significantly (lowest trace), then sea level rise by 2100 can be limited to 0.3–0.6 m (1–2 ft). If the emissions instead accelerate rapidly (top trace), sea levels could rise 5 m (16+12 ft) by the year 2300. Higher levels of sea level rise would involve substantial ice loss from Antarctica, including East Antarctica.

Sea levels will continue to rise long after 2100 but potentially at very different rates. According to the most-recent reports of the Intergovernmental Panel on Climate Change (SROCC and the IPCC Sixth Assessment Report), there will be a median rise of 16 cm (6.3 in) and maximum rise of 37 cm (15 in) under the low-emission scenario. The highest-emission scenario results in a median rise of 1.46 m (5 ft) with a minimum of 60 cm (2 ft) and a maximum of 2.89 m (9+12 ft).

Over longer timescales, the West Antarctic ice sheet, which is much smaller than the East Antarctic ice sheet and is grounded deep below sea level, is considered highly vulnerable. The melting of all of the ice in West Antarctica would increase global sea-level rise to 4.3 m (14 ft 1 in). Mountain ice caps that are not in contact with water are less vulnerable than the majority of the ice sheet, which is located below sea level. The collapse of the West Antarctic ice sheet would cause around 3.3 m (10 ft 10 in) of sea-level rise. This kind of collapse is now considered almost inevitable because it appears to have occurred during the Eemian period 125,000 years ago, when temperatures were similar to those in the early 21st century. The Amundsen Sea also appears to be warming at rates that, if continued, make the ice sheet's collapse inevitable.

The only way to reverse ice loss from West Antarctica once triggered is to lower the global temperature to 1 °C (1.8 °F) below the pre-industrial level, to 2 °C (3.6 °F) below the temperature of 2020. Other researchers said a climate engineering intervention to stabilize the ice sheet's glaciers may delay its loss by centuries and give the environment more time to adapt. This is an uncertain proposal and would be one of the most-expensive projects ever attempted. Otherwise, the disappearance of the West Antarctic ice sheet would take an estimated 2,000 years. The loss of West Antarctica ice would take at least 500 years and possibly as long as 13,000 years. Once the ice sheet is lost, the isostatic rebound of the land previously covered by the ice sheet would result in an additional 1 m (3 ft 3 in) of sea-level rise over the following 1,000 years.

Retreat of Cook Glacier - a key part of the Wilkes Basin - during the Eemian ~120,000 years ago and an earlier Pleistocene interglacial ~330,000 years ago. These retreats would have added about 0.5 m (1 ft 8 in) and 0.9 m (2 ft 11 in) to sea level rise.

The East Antarctic ice sheet is far more stable than the West Antarctic ice sheet. The loss of the entire East Antarctic ice sheet would require global warming of between 5 °C (9.0 °F) and 10 °C (18 °F), and a minimum of 10,000 years. Some of its parts, such as Totten Glacier and Wilkes Basin, are in vulnerable subglacial basins that lie below sea level. Estimates suggest the irreversible loss of those basins would begin once global warming reaches 3 °C (5.4 °F), although this loss may become irreversible at warming of between 2 °C (3.6 °F) and 6 °C (11 °F). After global warming reaches the critical threshold for the collapse of these subglacial basins, their loss will likely occur over around 2,000 years, although the loss may be as fast as 500 years or as slow as 10,000 years.

The loss of all of this ice would add between 1.4 m (4 ft 7 in) and 6.4 m (21 ft 0 in) to sea levels, depending on the ice sheet model used. Isostatic rebound of the newly ice-free land would add between 8 cm (3.1 in) and 57 cm (1 ft 10 in). Evidence from the Pleistocene shows partial loss can occur at lower warming levels; Wilkes Basin is estimated to have lost enough ice to add 0.5 m (1 ft 8 in) to sea levels between 115,000 and 129,000 years ago during the Eemian, and about 0.9 m (2 ft 11 in) between 318,000 and 339,000 years ago during Marine Isotope Stage 9.

Permafrost thaw

Antarctica has much less permafrost than the Arctic. Antarctic permafrost is subject to thaw. The permafrost in Antarctica traps various compounds, including persistent organic pollutants (POPs) like polycyclic aromatic hydrocarbons, many of which are known carcinogens or can cause liver damage; and polychlorinated biphenyls such as hexachlorobenzene (HCB) and DDT, which are associated with decreased reproductive success and immunohematological disorders. Antarctic soils also contain heavy metals, including mercury, lead and cadmium, all of which can cause endocrine disruption, DNA damage, immunotoxicity and reproductive toxicity. These compounds are released when contaminated permafrost thaws; this can change the chemistry of surface water. Bioaccumulation and biomagnification spread these compounds throughout the food web. Permafrost thaw also results in greenhouse gas emissions, though the limited volume of Antarctic permafrost relative to Arctic permafrost means Antarctic permafrost is not considered a significant cause of climate change.

Ecological effects

Marine ecosystems

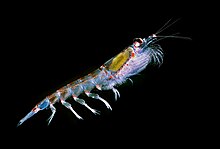
Antarctic krill (Euphasia superba)

Nearly all of the species in Antarctic are marine; by 2015, 8,354 species had been discovered in Antarctica and taxonomically accepted; of these species, only 57 were not marine. Antarctica may have up to 17,000 species; while 90% of the ocean around Antarctica is deeper than 1,000 m (3,281 ft), only 30% of the benthic-sample locations were taken at that depth. On the Antarctic continental shelves, bethnic-zone biomass may increase due to oceanic warming, which is likely to be of most benefit to seaweed. Around 12% of the native benthic species may be outcompeted and go extinct. These estimates are preliminary; the vulnerabilities of most Antarctic species have yet to be assessed.

Unlike the Arctic, there has been little change in marine primary production across the Southern Ocean in the available observations. Estimates say an increase in Southern Ocean primary production could occur after 2100; this increase would block many nutrients from travelling to other oceans, leading to decreased production elsewhere. Some microbial communities appear to have been negatively affected by ocean acidification and there is a risk future acidification would threaten the eggs of pteropods, a type of zooplankton.

Antarctic krill are a key species in the Antarctic food web; they feed on phytoplankton, and are the main food for fish and penguins. Krill are likely to abandon the fastest-warming areas, such as the Weddell Sea, while icefish may find shelf waters around Antarctic islands unsuitable. The shifts or declines in krill and copepod numbers are known to prevent the recovery in numbers of baleen whale following the declines caused by historical whaling. Without a reversal in temperature increases, baleen whales are likely to be forced to adapt their migratory patterns or face local extinction. Many other marine species are expected to move into Antarctic waters as the oceans continue to warm, forcing native species to compete with them. Some research says at 3 °C (5.4 °F) of warming, the diversity of Antarctic species would decline by nearly 17% and the suitable climate area would shrink by 50%.

Penguins

Gentoo penguin (Pygoscelis papua) at South Georgia

Penguins are the highest species in the Antarctic food web and are already being substantially affected by climate change. Numbers of Adélie penguins, chinstrap penguins, emperor penguin and king penguins have already been declining, while the number of gentoo penguins has increased. Gentoo penguins, which are ice intolerant and use mosses as nesting material, have been able to spread into previously inaccessible territories and substantially increase in number. The vulnerable penguin species can respond through acclimatization, adaptation, or range shift. Range shift through dispersal leads to colonization elsewhere but results in local extinction.

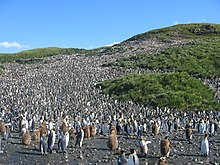
King penguins are threatened by climate change in Antarctica.

Climate change is particularly threatening to penguins. As early as 2008, it was estimated every Southern Ocean temperature increase of 0.26 °C (0.47 °F) reduces king penguin populations by nine percent. Under the worst-case warming scenario, king penguins will permanently lose at least two of their current eight breeding sites, and 70% of the species (1.1 million pairs) will have to relocate to avoid extinction. Emperor penguin populations may be at a similar risk; with no climate mitigation, 80% of populations are at risk of extinction by 2100. With Paris-Agreement temperature goals in place, that number may fall to 31% under the 2 °C (3.6 °F) goal, and to 19% under the 1.5 °C (2.7 °F) goal.

A 27-year study of the largest colony of Magellanic penguins that was published in 2014 found extreme weather caused by climate change kills seven percent of penguin chicks in an average year, accounting for up to 50% of all chick deaths in some years. Since 1987, the number of breeding pairs in the colony has fallen by 24%. Chinstrap penguins are also in decline, mainly due to a corresponding decline of Antarctic krill. It is estimated while Adélie penguins will retain some habitat past 2099, one-third of colonies along the West Antarctic Peninsula – around 20% of the species – will be in decline by 2060.

Terrestrial ecosystems

Deschampsia antarctica and Colobanthus quitensis

On the Antarctic continent, plants are mainly found in coastal areas; the commonest plants are lichens, followed by mosses and ice algae. In the Antarctic Peninsula, green snow algae have a combined biomass of around 1,300 t (2,900,000 lb). As glaciers retreat, they expose areas that often become colonized by pioneer lichen species. The reduction in precipitation in East Antarctica had turned many green mosses from green to red or brown as they respond to this drought. Schistidium antarctici had declined, while the desiccation-tolerant species Bryum pseudotriquetrum and Ceratodon purpureus have increased. The Antarctic ozone hole has led to an increase in UV-B radiation, which also causes observed damage to plant cells and photosynthesis.

The only vascular plants on continental Antarctica are Deschampsia antarctica and Colobanthus quitensis, which are found on the Antarctic Peninsula. Increased temperatures have boosted photosynthesis and allowed these species to increase their population and range. Other plant species are increasingly likely to spread to Antarctica as the climate continues to warm and as human activity on the continent increases.

Effects of human development

The number of Antarctic research stations had grown substantially since the start of the 20th century, and a major growth in tourism had occurred during 2010s

Tourism in Antarctica has significantly increased since 2020; 74,400 tourists arrived there in late 2019 and early 2020. The development of Antarctica for the purposes of industry, tourism, and an increase in research facilities may put pressure on the continent and threaten its status as largely untouched land. Regulated tourism in Antarctica brings about awareness, and encourages the investment and public support needed to preserve Antarctica's distinctive environment. An unmitigated loss of ice on land and sea could greatly reduce its attractiveness.

Policy can be used to increase climate-change resilience through the protection of ecosystems. Ships that operate in Antarctic waters adhere to the international Polar Code, which includes regulations and safety measures such as operational training and assessments, the control of oil discharge, appropriate sewage disposal, and the prevention of pollution by toxic liquids. Antarctic Specially Protected Areas (ASPA) and Antarctic Specially Managed Areas (ASMA) are designated by the Antarctic Treaty to protect flora and fauna. Both ASPAs and ASMAs restrict entry but to different extents, with ASPAs being the highest level of protection. Designation of ASPAs has decreased 84% since the 1980s despite a rapid increase in tourism, which may bring additional stressors to the natural environment and ecosystems. To alleviate stress on Antarctic ecosystems posed by climate change and the rapid increase in tourism, much of the scientific community advocates for an increase in protected areas like ASPAs to improve Antarctica's resilience to rising temperatures.

Climate of Antarctica

From Wikipedia, the free encyclopedia
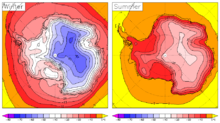
Surface temperature of Antarctica in winter and summer from the European Centre for Medium-Range Weather Forecasts

The climate of Antarctica is the coldest on Earth. The continent is also extremely dry (it is a desert), averaging 166 mm (6.5 in) of precipitation per year. Snow rarely melts on most parts of the continent, and, after being compressed, becomes the glacier ice that makes up the ice sheet. Weather fronts rarely penetrate far into the continent, because of the katabatic winds. Most of Antarctica has an ice-cap climate (Köppen classification EF) with extremely cold and dry weather.

Temperature

The highest temperature ever recorded on Antarctica was 19.8 °C (67.6 °F) recorded at Signy Research Station, Signy Island on 30 January 1982.

The highest temperature on the Antarctic mainland was 18.3 °C (64.9 °F) at the Esperanza Base (Argentina) on 6 February 2020.

The Antarctic temperature changes during the last several glacial and interglacial cycles of the present ice age

The lowest air temperature record, the lowest reliably measured temperature on Antarctica was set on 21 July 1983, when a temperature of −89.2 °C (−128.6 °F) was observed at Vostok Station. For comparison, this is 10.7 °C (19.3 °F) colder than subliming dry ice (at sea level pressure). The elevation of the location is 3,488 meters (11,444 feet).

Satellite measurements have identified even lower ground temperatures, with −93.2 °C (−135.8 °F) having been observed at the cloud-free East Antarctic Plateau on 10 August 2010.

The lowest recorded temperature of any location on Earth's surface at 81.8°S 63.5°E was revised with new data in 2018 in nearly 100 locations, ranging from −93.2 °C (−135.8 °F)[7] to −98 °C (−144.4 °F). This unnamed part of the Antarctic plateau, between Dome A and Dome F, was measured on 10 August 2010, and the temperature was deduced from radiance measured by the Landsat 8 and other satellites. It was discovered during a National Snow and Ice Data Center review of stored data in December 2013 but revised by researchers on 25 June 2018. This temperature is not directly comparable to the –89.2 °C reading quoted above, since it is a skin temperature deduced from satellite-measured upwelling radiance, rather than a thermometer-measured temperature of the air 1.5 m (5 ft) above the ground surface.

The mean annual temperature of the interior is −43.5 °C (−46.3 °F). The coast is warmer; on the coast Antarctic average temperatures are around −10 °C (14.0 °F) (in the warmest parts of Antarctica) and in the elevated inland they average about −55 °C (−67.0 °F) in Vostok. Monthly means at McMurdo Station range from −26 °C (−14.8 °F) in August to −3 °C (26.6 °F) in January. At the South Pole, the highest temperature ever recorded was −12.3 °C (9.9 °F) on 25 December 2011. Along the Antarctic Peninsula, temperatures as high as 18.3 °C (64.9 °F) have been recorded, though the summer temperature is below 0 °C (32 °F) most of the time. Severe low temperatures vary with latitude, elevation, and distance from the ocean. East Antarctica is colder than West Antarctica because of its higher elevation. The Antarctic Peninsula has the most moderate climate. Higher temperatures occur in January along the coast and average slightly below freezing.

Precipitation

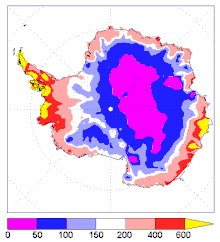
Map of average annual precipitation on Antarctica (mm liquid equivalent)

The total precipitation on Antarctica, averaged over the entire continent, is about 166 millimetres (6.5 inches) per year (Vaughan et al., J. Clim., 1999). The actual rates vary widely, from high values over the Peninsula (380 to 640 millimetres (15 to 25 inches) a year) to very low values (as little as 50 millimetres (2.0 inches) in the high interior (Bromwich, Reviews of Geophysics, 1988). Areas that receive less than 250 millimetres (9.8 inches) of precipitation per year are classified as deserts. Almost all Antarctic precipitation falls as snow. Rainfall is rare and mainly occurs during the summer in coastal areas and surrounding islands. Note that the quoted precipitation is a measure of its equivalence to water, rather than being the actual depth of snow. The air in Antarctica is also very dry. The low temperatures result in a very low absolute humidity, which means that dry skin and cracked lips are a continual problem for scientists and expeditioners working on the continent.

Weather condition classification

The weather in Antarctica can be highly variable, and the weather conditions can often change dramatically in short periods of time. There are various classifications for describing weather conditions in Antarctica; restrictions given to workers during the different conditions vary by station and nation.

Ice cover

Nearly all of Antarctica is covered by a sheet of ice that is, on average, at least 1,500 m (5,000 ft) thick. Antarctica contains 90% of the world's ice and more than 70% of its fresh water. If all the land-ice covering Antarctica were to melt — around 30×106 km3 (7.2×10⁶ cu mi) of ice — the seas would rise by over 60 m (200 ft). The Antarctic is so cold that even with increases of a few degrees, temperatures would generally remain below the melting point of ice. Higher temperatures are expected to lead to more precipitation, which takes the form of snow. This would increase the amount of ice in Antarctica, offsetting approximately one third of the expected sea level rise from thermal expansion of the oceans. During a recent decade, East Antarctica thickened at an average rate of about 1.8 cm (1116 in) per year while West Antarctica showed an overall thinning of 0.9 cm (38 in) per year. For the contribution of Antarctica to present and future sea level change, see sea level rise. Because ice flows, albeit slowly, the ice within the ice sheet is younger than the age of the sheet itself.

Morphometric data for Antarctica (from Drewry, 1983)
Surface Area Mean ice
thickness
(m)
Volume
(km2) Percent (km3) Percent
Inland ice sheet 11,965,700 85.97 2,450 29,324,700 97.00
Ice shelves 1,541,710 11.08 475 731,900 2.43
Ice rises 78,970 0.57 670 53,100 0.18
Glacier ice (total) 13,586,380   2,160 30,109,800 
Rock outcrop 331,690 2.38


Antarctica (total) 13,918,070 100.00 2,160 30,109,800 100.00

Regional ice data (from Drewry and others, 1982; Drewry, 1983)
Region Area
(km2)
Mean ice
thickness
(m)
Volume
(km3)
East Antarctica
Inland ice 9,855,570 2,630 25,920,100
Ice shelves 293,510 400 117,400
Ice rises 4,090 400 1,600
West Antarctica (excluding Antarctic Peninsula)
Inland ice sheet 1,809,760 1,780 3,221,400
Ice shelves 104,860 375 39,300
Ice rises 3,550 375 1,300
Antarctic Peninsula
Inland ice sheet 300,380 610 183,200
Ice shelves 144,750 300 43,400
Ice rises 1,570 300 500
Ross Ice Shelf
Ice shelf 525,840 427 224,500
Ice rises 10,320 500 5,100
Filchner-Ronne Ice Shelf
Ice shelf 472,760 650 307,300
Ice rises 59,440 750 44,600

Ice shelves

Antarctic ice shelves, 1998

About 75% of the coastline of Antarctica is ice shelf. The majority of ice shelf consists of floating ice, and a lesser amount consists of glaciers that move slowly from the land mass into the sea. Ice shelves lose mass through breakup of glacial ice (calving), or basal melting due to warm ocean water under the ice.

Melting or breakup of floating shelf ice does not directly affect global sea levels; however, ice shelves have a buttressing effect on the ice flow behind them. If ice shelves break up, the ice flow behind them may accelerate, resulting in increasing melt of the Antarctic ice sheet and an increasing contribution to sea level rise.

Known changes in coastline ice around the Antarctic Peninsula:

  • 1936–1989: Wordie Ice Shelf significantly reduced in size.
  • 1995: Ice in the Prince Gustav Channel disintegrated.
  • Parts of the Larsen Ice Shelf broke up in recent decades.
    • 1995: The Larsen A ice shelf disintegrated in January 1995.
    • 2001: 3,250 km2 (1,250 sq mi) of the Larsen B ice shelf disintegrated in February 2001. It had been gradually retreating before the breakup event.
    • 2015: A study concluded that the remaining Larsen B ice-shelf will disintegrate by the end of the decade, based on observations of faster flow and rapid thinning of glaciers in the area.

The George VI Ice Shelf, which may be on the brink of instability, has probably existed for approximately 8,000 years, after melting 1,500 years earlier. Warm ocean currents may have been the cause of the melting. Not only are the ice sheets losing mass, they are losing mass at an accelerating rate.

Climate change

Climate change caused by greenhouse gas emissions from human activities occurs everywhere on Earth, and while Antarctica is less vulnerable to it than any other continent, climate change in Antarctica has been observed. Since 1959, there has been an average temperature increase of >0.05 °C/decade since 1957 across the continent, although it had been uneven. West Antarctica warmed by over 0.1 °C/decade from the 1950s to the 2000s, and the exposed Antarctic Peninsula has warmed by 3 °C (5.4 °F) since the mid-20th century. The colder, stabler East Antarctica had been experiencing cooling until the 2000s. Around Antarctica, the Southern Ocean has absorbed more oceanic heat than any other ocean, and has seen strong warming at depths below 2,000 m (6,600 ft). Around the West Antarctic, the ocean has warmed by 1 °C (1.8 °F) since 1955.

The warming of the Southern Ocean around Antarctica has caused the weakening or collapse of ice shelves, which float just offshore of glaciers and stabilize them. Many coastal glaciers have been losing mass and retreating, causing net-annual ice loss across Antarctica, although the East Antarctic ice sheet continues to gain ice inland. By 2100, net ice loss from Antarctica is expected to add about 11 cm (5 in) to global sea level rise. Marine ice sheet instability may cause West Antarctica to contribute tens of centimeters more if it is triggered before 2100. With higher warming, instability would be much more likely, and could double global, 21st-century sea-level rise.

Cascadia subduction zone

From Wikipedia, the free encyclopedia https://en.wikipedia.org/wiki/Cascadia_subduction_zone Area of the C...