Search This Blog

Saturday, December 14, 2019

Oort constants

From Wikipedia, the free encyclopedia
https://en.wikipedia.org/wiki/Oort_constants

The Oort constants (discovered by Jan Oort) and are empirically derived parameters that characterize the local rotational properties of our galaxy, the Milky Way, in the following manner:
where and are the rotational velocity and distance to the Galactic center, respectively, measured at the position of the Sun, and v and r are the velocities and distances at other positions in our part of the galaxy. As derived below, A and B depend only on the motions and positions of stars in the solar neighborhood. As of 2018, the most accurate values of these constants are = 15.3 ± 0.4 km s−1 kpc−1, = -11.9 ± 0.4 km s−1 kpc−1. From the Oort constants, it is possible to determine the orbital properties of the Sun, such as the orbital velocity and period, and infer local properties of the Galactic disk, such as the mass density and how the rotational velocity changes as a function of radius from the Galactic center.

Historical significance and background

By the 1920s, a large fraction of the astronomical community had recognized that some of the diffuse, cloud-like objects, or nebulae, seen in the night sky were collections of stars located beyond our own, local collection of star clusters. These galaxies had diverse morphologies, ranging from ellipsoids to disks. The concentrated band of starlight that is the visible signature of the Milky Way was indicative of a disk structure for our galaxy; however, our location within our galaxy made structural determinations from observations difficult.

Classical mechanics predicted that a collection of stars could be supported against gravitational collapse by either random velocities of the stars or their rotation about its center of mass. For a disk-shaped collection, the support should be mainly rotational. Depending on the mass density, or distribution of the mass in the disk, the rotation velocity may be different at each radius from the center of the disk to the outer edge. A plot of these rotational velocities against the radii at which they are measured is called a rotation curve. For external disk galaxies, one can measure the rotation curve by observing the Doppler shifts of spectral features measured along different galactic radii, since one side of the galaxy will be moving towards our line of sight and one side away. However, our position in the Galactic midplane of the Milky Way, where dust in molecular clouds obscures most optical light in many directions, made obtaining our own rotation curve technically difficult until the discovery of the 21 cm hydrogen line in the 1930s.

To confirm the rotation of our galaxy prior to this, in 1927 Jan Oort derived a way to measure the Galactic rotation from just a small fraction of stars in the local neighborhood. As described below, the values he found for and proved not only that the Galaxy was rotating but also that it rotates differentially, or as a fluid rather than a solid body. 

Derivation

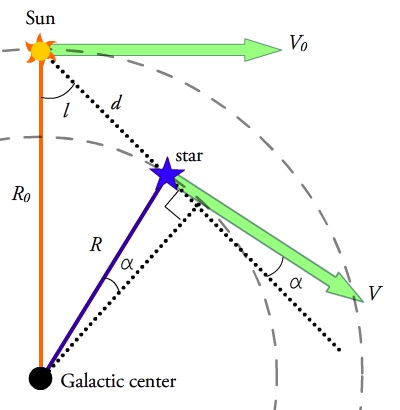
Figure 1: Geometry of the Oort constants derivation, with a field star close to the Sun in the midplane of the Galaxy.
 
Consider a star in the midplane of the Galactic disk with Galactic longitude at a distance from the Sun. Assume that both the star and the Sun have circular orbits around the center of the Galaxy at radii of and from the galactic center and rotational velocities of and , respectively. The motion of the star along our line of sight, or radial velocity, and motion of the star across the plane of the sky, or transverse velocity, as observed from the position of the Sun are then:
With the assumption of circular motion, the rotational velocity is related to the angular velocity by and we can substitute this into the velocity expressions:
From the geometry in Figure 1, one can see that the triangles formed between the galactic center, the Sun, and the star share a side or portions of sides, so the following relationships hold and substitutions can be made:
and with these we get
To put these expressions only in terms of the known quantities and , we take a Taylor expansion of about .
Additionally, we take advantage of the assumption that the stars used for this analysis are local, i.e. is small, and the distance d to the star is smaller than or , and we take:
.
So:
Using the sine and cosine half angle formulae, these velocities may be rewritten as:
Writing the velocities in terms of our known quantities and two coefficients and yields:
where
At this stage, the observable velocities are related to these coefficients and the position of the star. It is now possible to relate these coefficients to the rotation properties of the galaxy. For a star in a circular orbit, we can express the derivative of the angular velocity with respect to radius in terms of the rotation velocity and radius and evaluate this at the location of the Sun:
so
Oort constants on a wall in Leiden
is the Oort constant describing the shearing motion and is the Oort constant describing the rotation of the Galaxy. As described below, one can measure and from plotting these velocities, measured for many stars, against the galactic longitudes of these stars. 

Measurements

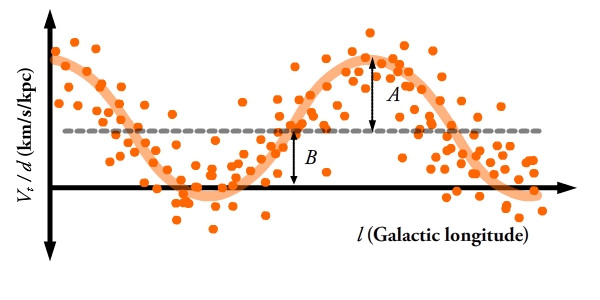
Figure 2: Measuring the Oort constants by fitting to large data sets. Note that this graph erroneously shows B as positive. A negative B value contributes a westerly component to the transverse velocities.
 
As mentioned in an intermediate step in the derivation above:
Therefore, we can write the Oort constants and as:
Thus, the Oort constants can be expressed in terms of the radial and transverse velocities, distances, and galactic longitudes of objects in our Galaxy - all of which are, in principle, observable quantities.
However, there are a number of complications. The simple derivation above assumed that both the Sun and the object in question are traveling on circular orbits about the Galactic center. This is not true for the Sun (the Sun's velocity relative to the local standard of rest is approximately 13.4 km/s), and not necessarily true for other objects in the Milky Way either. The derivation also implicitly assumes that the gravitational potential of the Milky Way is axisymmetric and always directed towards the center. This ignores the effects of spiral arms and the Galaxy's bar. Finally, both transverse velocity and distance are notoriously difficult to measure for objects which are not relatively nearby. 

Since the non-circular component of the Sun's velocity is known, it can be subtracted out from our observations to compensate. We do not know, however, the non-circular components of the velocity of each individual star we observe, so they cannot be compensated for in this way. But, if we plot transverse velocity divided by distance against galactic longitude for a large sample of stars, we know from the equations above that they will follow a sine function. The non-circular velocities will introduce scatter around this line, but with a large enough sample the true function can be fit for and the values of the Oort constants measured, as shown in figure 2. is simply the amplitude of the sinusoid and is the vertical offset from zero. Measuring transverse velocities and distances accurately and without biases remains challenging, though, and sets of derived values for and frequently disagree. 

Most methods of measuring and are fundamentally similar, following the above patterns. The major differences usually lie in what sorts of objects are used and details of how distance or proper motion are measured. Oort, in his original 1927 paper deriving the constants, obtained = 31.0 ± 3.7 km s−1 kpc−1. He did not explicitly obtain a value for , but from his conclusion that the Galaxy was nearly in Keplerian rotation (as in example 2 below), we can presume he would have gotten a value of around -10 km s−1 kpc−1. These differ significantly from modern values, which is indicative of the difficulty of measuring these constants. Measurements of and since that time have varied widely; in 1964 the IAU adopted = 15 km s−1 kpc−1 and = -10 km s−1 kpc−1 as standard values. Although more recent measurements continue to vary, they tend to lie near these values.

The Hipparcos satellite, launched in 1989, was the first space-based astrometric mission, and its precise measurements of parallax and proper motion have enabled much better measurements of the Oort constants. In 1997 Hipparcos data were used to derive the values = 14.82 ± 0.84 km s−1 kpc−1 and = -12.37 ± 0.64 km s−1 kpc−1. The Gaia spacecraft, launched in 2013, is an updated successor to Hipparcos; which allowed new levels of accuracy in measuring four Oort constants = 15.3 ± 0.4 km s−1 kpc−1, = -11.9 ± 0.4 km s−1 kpc−1, = -3.2 ± 0.4 km s−1 kpc−1 and = -3.3 ± 0.6 km s−1 kpc−1.

With the Gaia values, we find
This value of Ω corresponds to a period of 226 million years for the sun's present neighborhood to go around the Milky Way. However, the time it takes for the sun to go around the Milky Way (a galactic year) may be longer because (in a simple model) it is circulating around a point further from the centre of the galaxy where Ω is smaller.

The values in km s−1 kpc−1 can be converted into milliarcseconds per year by dividing by 4.740. This gives the following values for the average proper motion of stars in our neighborhood at different galactic longitudes, after correction for the effect due to the sun's velocity with respect to the local standard of rest:

Galactic
longitude
Constellation ave. proper
motion
mas/
year
approximate
direction
Sagittarius B+A 0.7 north-east
45° Aquila B 2.5 south-west
90° Cygnus B−A 5.7 west
135° Cassiopeia B 2.5 west
180° Auriga B+A 0.7 south-east
225° Monoceros B 2.5 north-west
270° Vela B−A 5.7 west
315° Centaurus B 2.5 west

The motion of the sun towards the solar apex in Hercules adds a generally westward component to the observed proper motions of stars around Vela or Centaurus and a generally eastward component for stars around Cygnus or Cassiopeia. This effect falls off with distance, so the values in the table are more representative for stars that are further away. On the other hand, more distant stars or objects will not follow the table, which is for objects in our neighborhood. For example, Sagittarius A*, the radio source at the centre of the galaxy, will have a proper motion of approximately Ω or 5.7 mas/y southwestward (with a small adjustment due to the sun's motion toward the solar apex) even though it is in Sagittarius. Note that these proper motions cannot be measured against "background stars" (because the background stars will have similar proper motions), but must be measured against more stationary references such as quasars

Meaning

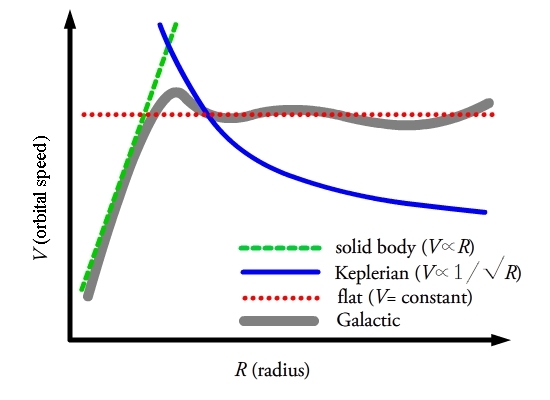
Figure 3: Diagram of the various rotation curves in a galaxy
 
The Oort constants can greatly enlighten one as to how the Galaxy rotates. As one can see and are both functions of the Sun's orbital velocity as well as the first derivative of the Sun's velocity. As a result, describes the shearing motion in the disk surrounding the Sun, while describes the angular momentum gradient in the solar neighborhood, also referred to as vorticity.

To illuminate this point, one can look at three examples that describe how stars and gas orbit within the Galaxy giving intuition as to the meaning of and . These three examples are solid body rotation, Keplerian rotation and constant rotation over different annuli. These three types of rotation are plotted as a function of radius (), and are shown in Figure 3 as the green, blue and red curves respectively. The grey curve is approximately the rotation curve of the Milky Way

Solid body rotation

To begin, let one assume that the rotation of the Milky Way can be described by solid body rotation, as shown by the green curve in Figure 3. Solid body rotation assumes that the entire system is moving as a rigid body with no differential rotation. This results in a constant angular velocity, , which is independent of . Following this we can see that velocity scales linearly with , , thus
Using the two Oort constant identities, one then can determine what the and constants would be,
This demonstrates that in solid body rotation, there is no shear motion, i.e. , and the vorticity is just the angular rotation, . This is what one would expect because there is no difference in orbital velocity as radius increases, thus no stress between the annuli. Also, in solid body rotation, the only rotation is about the center, so it is reasonable that the resulting vorticity in the system is described by the only rotation in the system. One can actually measure and find that is non-zero ( km s−1 kpc−1). Thus the galaxy does not rotate as a solid body in our local neighborhood, but may in the inner regions of the Galaxy. 

Keplerian rotation

The second illuminating example is to assume that the orbits in the local neighborhood follow a Keplerian orbit, as shown by the blue line in Figure 3. The orbital motion in a Keplerian orbit is described by,
where is the Gravitational Constant, and is the mass enclosed within radius . The derivative of the velocity with respect to the radius is,
The Oort constants can then be written as follows,
For values of Solar velocity, km/s, and radius to the Galactic center, kpc,[4] the Oort's constants are km s−1 kpc−1, and km s−1 kpc−1. However, the observed values are km s−1 kpc−1 and km s−1 kpc−1. Thus, Keplerian rotation is not the best description the Milky Way rotation. Furthermore, although this example does not describe the local rotation, it can be thought of as the limiting case that describes the minimum velocity an object can have in a stable orbit. 

Flat rotation curve

The final example is to assume that the rotation curve of the Galaxy is flat, i.e. is constant and independent of radius, . The rotation velocity is in between that of a solid body and of Keplerian rotation, and is the red dottedline in Figure 3. With a constant velocity, it follows that the radial derivative of is 0,
and therefore the Oort constants are,
Using the local velocity and radius given in the last example, one finds km s−1 kpc−1 and km s−1 kpc−1. This is close to the actual measured Oort constants and tells us that the constant-speed model is the closest of these three to reality in the solar neighborhood. But in fact, as mentioned above, is negative, meaning that at our distance, speed decreases with distance from the centre of the galaxy. 

What one should take away from these three examples, is that with a remarkably simple model, the rotation of the Milky Way can be described by these two constants. The first two examples are used as constraints to the Galactic rotation, for they show the fastest and slowest the Galaxy can rotate at a given radius. The flat rotation curve serves as an intermediate step between the two rotation curves, and in fact gives the most reasonable Oort constants as compared to current measurements. 

Uses

One of the major uses of the Oort constants is to calibrate the galactic rotation curve. A relative curve can be derived from studying the motions of gas clouds in the Milky Way, but to calibrate the actual absolute speeds involved requires knowledge of V0. We know that:
Since R0 can be determined by other means (such as by carefully tracking the motions of stars near the Milky Way's central supermassive black hole), knowing and allows us to determine V0.
It can also be shown that the mass density can be given by:
So the Oort constants can tell us something about the mass density at a given radius in the disk. They are also useful to constrain mass distribution models for the Galaxy. As well, in the epicyclic approximation for nearly circular stellar orbits in a disk, the epicyclic frequency is given by , where is the angular velocity. Therefore, the Oort constants can tell us a great deal about motions in the galaxy.

Open cluster

From Wikipedia, the free encyclopedia
https://en.wikipedia.org/wiki/Open_cluster
 
Star cluster NGC 3572 and its surroundings.
 
An open cluster is a group of up to a few thousand stars that were formed from the same giant molecular cloud and have roughly the same age. More than 1,100 open clusters have been discovered within the Milky Way Galaxy, and many more are thought to exist. They are loosely bound by mutual gravitational attraction and become disrupted by close encounters with other clusters and clouds of gas as they orbit the galactic center. This can result in a migration to the main body of the galaxy and a loss of cluster members through internal close encounters. Open clusters generally survive for a few hundred million years, with the most massive ones surviving for a few billion years. In contrast, the more massive globular clusters of stars exert a stronger gravitational attraction on their members, and can survive for longer. Open clusters have been found only in spiral and irregular galaxies, in which active star formation is occurring.

Young open clusters may be contained within the molecular cloud from which they formed, illuminating it to create an H II region. Over time, radiation pressure from the cluster will disperse the molecular cloud. Typically, about 10% of the mass of a gas cloud will coalesce into stars before radiation pressure drives the rest of the gas away.

Open clusters are key objects in the study of stellar evolution. Because the cluster members are of similar age and chemical composition, their properties (such as distance, age, metallicity, extinction, and velocity) are more easily determined than they are for isolated stars. A number of open clusters, such as the Pleiades, Hyades or the Alpha Persei Cluster are visible with the naked eye. Some others, such as the Double Cluster, are barely perceptible without instruments, while many more can be seen using binoculars or telescopes. The Wild Duck Cluster, M11, is an example.

Historical observations

Mosaic of 30 open clusters discovered from VISTA's data. The open clusters were hidden by the dust in the Milky Way. Credit ESO.
 
The prominent open cluster the Pleiades has been recognized as a group of stars since antiquity, while the Hyades forms part of Taurus, one of the oldest constellations. Other open clusters were noted by early astronomers as unresolved fuzzy patches of light. In his Almagest, the Roman astronomer Ptolemy mentions the Praesepe cluster, the Double Cluster in Perseus, the Coma Star Cluster, and the Ptolemy Cluster, while the Persian astronomer Al-Sufi wrote of the Omicron Velorum cluster. However, it would require the invention of the telescope to resolve these "nebulae" into their constituent stars. Indeed, in 1603 Johann Bayer gave three of these clusters designations as if they were single stars.

The colorful star cluster NGC 3590.
 
The first person to use a telescope to observe the night sky and record his observations was the Italian scientist Galileo Galilei in 1609. When he turned the telescope toward some of the nebulous patches recorded by Ptolemy, he found they were not a single star, but groupings of many stars. For Praesepe, he found more than 40 stars. Where previously observers had noted only 6–7 stars in the Pleiades, he found almost 50. In his 1610 treatise Sidereus Nuncius, Galileo Galilei wrote, "the galaxy is nothing else but a mass of innumerable stars planted together in clusters." Influenced by Galileo's work, the Sicilian astronomer Giovanni Hodierna became possibly the first astronomer to use a telescope to find previously undiscovered open clusters. In 1654, he identified the objects now designated Messier 41, Messier 47, NGC 2362 and NGC 2451.

It was realised as early as 1767 that the stars in a cluster were physically related, when the English naturalist Reverend John Michell calculated that the probability of even just one group of stars like the Pleiades being the result of a chance alignment as seen from Earth was just 1 in 496,000. Between 1774–1781, French astronomer Charles Messier published a catalogue of celestial objects that had a nebulous appearance similar to comets. This catalogue included 26 open clusters. In the 1790s, English astronomer William Herschel began an extensive study of nebulous celestial objects. He discovered that many of these features could be resolved into groupings of individual stars. Herschel conceived the idea that stars were initially scattered across space, but later became clustered together as star systems because of gravitational attraction. He divided the nebulae into eight classes, with classes VI through VIII being used to classify clusters of stars.

The number of clusters known continued to increase under the efforts of astronomers. Hundreds of open clusters were listed in the New General Catalogue, first published in 1888 by the Danish-Irish astronomer J. L. E. Dreyer, and the two supplemental Index Catalogues, published in 1896 and 1905. Telescopic observations revealed two distinct types of clusters, one of which contained thousands of stars in a regular spherical distribution and was found all across the sky but preferentially towards the centre of the Milky Way. The other type consisted of a generally sparser population of stars in a more irregular shape. These were generally found in or near the galactic plane of the Milky Way. Astronomers dubbed the former globular clusters, and the latter open clusters. Because of their location, open clusters are occasionally referred to as galactic clusters, a term that was introduced in 1925 by the Swiss-American astronomer Robert Julius Trumpler.

Micrometer measurements of the positions of stars in clusters were made as early as 1877 by the German astronomer E. Schönfeld and further pursued by the American astronomer E. E. Barnard prior to his death in 1923. No indication of stellar motion was detected by these efforts. However, in 1918 the Dutch-American astronomer Adriaan van Maanen was able to measure the proper motion of stars in part of the Pleiades cluster by comparing photographic plates taken at different times. As astrometry became more accurate, cluster stars were found to share a common proper motion through space. By comparing the photographic plates of the Pleiades cluster taken in 1918 with images taken in 1943, van Maanen was able to identify those stars that had a proper motion similar to the mean motion of the cluster, and were therefore more likely to be members. Spectroscopic measurements revealed common radial velocities, thus showing that the clusters consist of stars bound together as a group.

The first color-magnitude diagrams of open clusters were published by Ejnar Hertzsprung in 1911, giving the plot for the Pleiades and Hyades star clusters. He continued this work on open clusters for the next twenty years. From spectroscopic data, he was able to determine the upper limit of internal motions for open clusters, and could estimate that the total mass of these objects did not exceed several hundred times the mass of the Sun. He demonstrated a relationship between the star colors and their magnitudes, and in 1929 noticed that the Hyades and Praesepe clusters had different stellar populations than the Pleiades. This would subsequently be interpreted as a difference in ages of the three clusters.

Formation

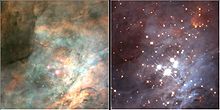
Infrared light reveals the dense open cluster forming at the heart of the Orion nebula.
 
The formation of an open cluster begins with the collapse of part of a giant molecular cloud, a cold dense cloud of gas and dust containing up to many thousands of times the mass of the Sun. These clouds have densities that vary from 102 to 106 molecules of neutral hydrogen per cm3, with star formation occurring in regions with densities above 104 molecules per cm3. Typically, only 1–10% of the cloud by volume is above the latter density. Prior to collapse, these clouds maintain their mechanical equilibrium through magnetic fields, turbulence, and rotation.

Many factors may disrupt the equilibrium of a giant molecular cloud, triggering a collapse and initiating the burst of star formation that can result in an open cluster. These include shock waves from a nearby supernova, collisions with other clouds, or gravitational interactions. Even without external triggers, regions of the cloud can reach conditions where they become unstable against collapse. The collapsing cloud region will undergo hierarchical fragmentation into ever smaller clumps, including a particularly dense form known as infrared dark clouds, eventually leading to the formation of up to several thousand stars. This star formation begins enshrouded in the collapsing cloud, blocking the protostars from sight but allowing infrared observation. In the Milky Way galaxy, the formation rate of open clusters is estimated to be one every few thousand years.

The so-called "Pillars of Creation", a region of the Eagle Nebula where the molecular cloud is being evaporated by young, massive stars
 
The hottest and most massive of the newly formed stars (known as OB stars) will emit intense ultraviolet radiation, which steadily ionizes the surrounding gas of the giant molecular cloud, forming an H II region. Stellar winds and radiation pressure from the massive stars begins to drive away the hot ionized gas at a velocity matching the speed of sound in the gas. After a few million years the cluster will experience its first core-collapse supernovae, which will also expel gas from the vicinity. In most cases these processes will strip the cluster of gas within ten million years and no further star formation will take place. Still, about half of the resulting protostellar objects will be left surrounded by circumstellar disks, many of which form accretion disks.

As only 30 to 40 per cent of the gas in the cloud core forms stars, the process of residual gas expulsion is highly damaging to the star formation process. All clusters thus suffer significant infant weight loss, while a large fraction undergo infant mortality. At this point, the formation of an open cluster will depend on whether the newly formed stars are gravitationally bound to each other; otherwise an unbound stellar association will result. Even when a cluster such as the Pleiades does form, it may only hold on to a third of the original stars, with the remainder becoming unbound once the gas is expelled. The young stars so released from their natal cluster become part of the Galactic field population.

Because most if not all stars form clusters, star clusters are to be viewed the fundamental building blocks of galaxies. The violent gas-expulsion events that shape and destroy many star clusters at birth leave their imprint in the morphological and kinematical structures of galaxies. Most open clusters form with at least 100 stars and a mass of 50 or more solar masses. The largest clusters can have 104 solar masses, with the massive cluster Westerlund 1 being estimated at 5 × 10⁴ solar masses; close to that of a globular cluster. While open clusters and globular clusters form two fairly distinct groups, there may not be a great deal of difference in appearance between a very sparse globular cluster and a very rich open cluster. Some astronomers believe the two types of star clusters form via the same basic mechanism, with the difference being that the conditions that allowed the formation of the very rich globular clusters containing hundreds of thousands of stars no longer prevail in the Milky Way.

It is common for two or more separate open clusters to form out of the same molecular cloud. In the Large Magellanic Cloud, both Hodge 301 and R136 are forming from the gases of the Tarantula Nebula, while in our own galaxy, tracing back the motion through space of the Hyades and Praesepe, two prominent nearby open clusters, suggests that they formed in the same cloud about 600 million years ago. Sometimes, two clusters born at the same time will form a binary cluster. The best known example in the Milky Way is the Double Cluster of NGC 869 and NGC 884 (sometimes mistakenly called h and χ Persei; h refers to a neighboring star and χ to both clusters), but at least 10 more double clusters are known to exist. Many more are known in the Small and Large Magellanic Clouds—they are easier to detect in external systems than in our own galaxy because projection effects can cause unrelated clusters within the Milky Way to appear close to each other. 

Morphology and classification

NGC 2367 is an infant stellar grouping that lies at the center of an immense and ancient structure on the margins of the Milky Way.
 
Open clusters range from very sparse clusters with only a few members to large agglomerations containing thousands of stars. They usually consist of quite a distinct dense core, surrounded by a more diffuse 'corona' of cluster members. The core is typically about 3–4 light years across, with the corona extending to about 20 light years from the cluster centre. Typical star densities in the centre of a cluster are about 1.5 stars per cubic light year; the stellar density near the Sun is about 0.003 stars per cubic light year.

Open clusters are often classified according to a scheme developed by Robert Trumpler in 1930. The Trumpler scheme gives a cluster a three part designation, with a Roman numeral from I-IV indicating its concentration and detachment from the surrounding star field (from strongly to weakly concentrated), an Arabic numeral from 1 to 3 indicating the range in brightness of members (from small to large range), and p, m or r to indication whether the cluster is poor, medium or rich in stars. An 'n' is appended if the cluster lies within nebulosity.

Under the Trumpler scheme, the Pleiades are classified as I3rn (strongly concentrated and richly populated with nebulosity present), while the nearby Hyades are classified as II3m (more dispersed, and with fewer members).

Numbers and distribution

NGC 346, an open cluster in the Small Magellanic Cloud
 
There are over 1,000 known open clusters in our galaxy, but the true total may be up to ten times higher than that. In spiral galaxies, open clusters are largely found in the spiral arms where gas densities are highest and so most star formation occurs, and clusters usually disperse before they have had time to travel beyond their spiral arm. Open clusters are strongly concentrated close to the galactic plane, with a scale height in our galaxy of about 180 light years, compared to a galactic radius of approximately 50,000 light years.

In irregular galaxies, open clusters may be found throughout the galaxy, although their concentration is highest where the gas density is highest. Open clusters are not seen in elliptical galaxies: star formation ceased many millions of years ago in ellipticals, and so the open clusters which were originally present have long since dispersed.

In our galaxy, the distribution of clusters depends on age, with older clusters being preferentially found at greater distances from the galactic centre, generally at substantial distances above or below the galactic plane. Tidal forces are stronger nearer the centre of the galaxy, increasing the rate of disruption of clusters, and also the giant molecular clouds which cause the disruption of clusters are concentrated towards the inner regions of the galaxy, so clusters in the inner regions of the galaxy tend to get dispersed at a younger age than their counterparts in the outer regions.

Stellar composition

A cluster of stars a few million years old at the lower right illuminates the Tarantula Nebula in the Large Magellanic Cloud.
 
Because open clusters tend to be dispersed before most of their stars reach the end of their lives, the light from them tends to be dominated by the young, hot blue stars. These stars are the most massive, and have the shortest lives of a few tens of millions of years. The older open clusters tend to contain more yellow stars.

Some open clusters contain hot blue stars which seem to be much younger than the rest of the cluster. These blue stragglers are also observed in globular clusters, and in the very dense cores of globulars they are believed to arise when stars collide, forming a much hotter, more massive star. However, the stellar density in open clusters is much lower than that in globular clusters, and stellar collisions cannot explain the numbers of blue stragglers observed. Instead, it is thought that most of them probably originate when dynamical interactions with other stars cause a binary system to coalesce into one star.

Once they have exhausted their supply of hydrogen through nuclear fusion, medium- to low-mass stars shed their outer layers to form a planetary nebula and evolve into white dwarfs. While most clusters become dispersed before a large proportion of their members have reached the white dwarf stage, the number of white dwarfs in open clusters is still generally much lower than would be expected, given the age of the cluster and the expected initial mass distribution of the stars. One possible explanation for the lack of white dwarfs is that when a red giant expels its outer layers to become a planetary nebula, a slight asymmetry in the loss of material could give the star a 'kick' of a few kilometres per second, enough to eject it from the cluster.

Because of their high density, close encounters between stars in an open cluster are common. For a typical cluster with 1,000 stars with a 0.5 parsec half-mass radius, on average a star will have an encounter with another member every 10 million years. The rate is even higher in denser clusters. These encounters can have a significant impact on the extended circumstellar disks of material that surround many young stars. Tidal perturbations of large disks may result in the formation of massive planets and brown dwarfs, producing companions at distances of 100 AU or more from the host star.

Eventual fate

NGC 604 in the Triangulum Galaxy is a very massive open cluster surrounded by an H II region.
 
Many open clusters are inherently unstable, with a small enough mass that the escape velocity of the system is lower than the average velocity of the constituent stars. These clusters will rapidly disperse within a few million years. In many cases, the stripping away of the gas from which the cluster formed by the radiation pressure of the hot young stars reduces the cluster mass enough to allow rapid dispersal.

Clusters that have enough mass to be gravitationally bound once the surrounding nebula has evaporated can remain distinct for many tens of millions of years, but over time internal and external processes tend also to disperse them. Internally, close encounters between stars can increase the velocity of a member beyond the escape velocity of the cluster. This results in the gradual 'evaporation' of cluster members.

Externally, about every half-billion years or so an open cluster tends to be disturbed by external factors such as passing close to or through a molecular cloud. The gravitational tidal forces generated by such an encounter tend to disrupt the cluster. Eventually, the cluster becomes a stream of stars, not close enough to be a cluster but all related and moving in similar directions at similar speeds. The timescale over which a cluster disrupts depends on its initial stellar density, with more tightly packed clusters persisting for longer. Estimated cluster half lives, after which half the original cluster members will have been lost, range from 150–800 million years, depending on the original density.

After a cluster has become gravitationally unbound, many of its constituent stars will still be moving through space on similar trajectories, in what is known as a stellar association, moving cluster, or moving group. Several of the brightest stars in the 'Plough' of Ursa Major are former members of an open cluster which now form such an association, in this case, the Ursa Major Moving Group. Eventually their slightly different relative velocities will see them scattered throughout the galaxy. A larger cluster is then known as a stream, if we discover the similar velocities and ages of otherwise unrelated stars.

Studying stellar evolution

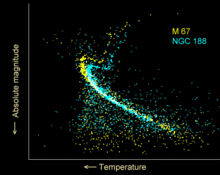
Hertzsprung-Russell diagrams for two open clusters. NGC 188 is older, and shows a lower turn off from the main sequence than that seen in M67.
 
When a Hertzsprung-Russell diagram is plotted for an open cluster, most stars lie on the main sequence. The most massive stars have begun to evolve away from the main sequence and are becoming red giants; the position of the turn-off from the main sequence can be used to estimate the age of the cluster.

Because the stars in an open cluster are all at roughly the same distance from Earth, and were born at roughly the same time from the same raw material, the differences in apparent brightness among cluster members is due only to their mass. This makes open clusters very useful in the study of stellar evolution, because when comparing one star to another, many of the variable parameters are fixed.

The study of the abundances of lithium and beryllium in open cluster stars can give important clues about the evolution of stars and their interior structures. While hydrogen nuclei cannot fuse to form helium until the temperature reaches about 10 million K, lithium and beryllium are destroyed at temperatures of 2.5 million K and 3.5 million K respectively. This means that their abundances depend strongly on how much mixing occurs in stellar interiors. By studying their abundances in open cluster stars, variables such as age and chemical composition are fixed.

Studies have shown that the abundances of these light elements are much lower than models of stellar evolution predict. While the reason for this underabundance is not yet fully understood, one possibility is that convection in stellar interiors can 'overshoot' into regions where radiation is normally the dominant mode of energy transport.

Astronomical distance scale

M11, the Wild Duck Cluster is a very rich cluster located towards the center of the Milky Way.
 
Determining the distances to astronomical objects is crucial to understanding them, but the vast majority of objects are too far away for their distances to be directly determined. Calibration of the astronomical distance scale relies on a sequence of indirect and sometimes uncertain measurements relating the closest objects, for which distances can be directly measured, to increasingly distant objects. Open clusters are a crucial step in this sequence. 

The closest open clusters can have their distance measured directly by one of two methods. First, the parallax (the small change in apparent position over the course of a year caused by the Earth moving from one side of its orbit around the Sun to the other) of stars in close open clusters can be measured, like other individual stars. Clusters such as the Pleiades, Hyades and a few others within about 500 light years are close enough for this method to be viable, and results from the Hipparcos position-measuring satellite yielded accurate distances for several clusters.

The other direct method is the so-called moving cluster method. This relies on the fact that the stars of a cluster share a common motion through space. Measuring the proper motions of cluster members and plotting their apparent motions across the sky will reveal that they converge on a vanishing point. The radial velocity of cluster members can be determined from Doppler shift measurements of their spectra, and once the radial velocity, proper motion and angular distance from the cluster to its vanishing point are known, simple trigonometry will reveal the distance to the cluster. The Hyades are the best known application of this method, which reveals their distance to be 46.3 parsecs.

Once the distances to nearby clusters have been established, further techniques can extend the distance scale to more distant clusters. By matching the main sequence on the Hertzsprung-Russell diagram for a cluster at a known distance with that of a more distant cluster, the distance to the more distant cluster can be estimated. The nearest open cluster is the Hyades: the stellar association consisting of most of the Plough stars is at about half the distance of the Hyades, but is a stellar association rather than an open cluster as the stars are not gravitationally bound to each other. The most distant known open cluster in our galaxy is Berkeley 29, at a distance of about 15,000 parsecs. Open clusters are also easily detected in many of the galaxies of the Local Group.

Accurate knowledge of open cluster distances is vital for calibrating the period-luminosity relationship shown by variable stars such as cepheid stars, which allows them to be used as standard candles. These luminous stars can be detected at great distances, and are then used to extend the distance scale to nearby galaxies in the Local Group. Indeed, the open cluster designated NGC 7790 hosts three classical Cepheids. RR Lyrae variables are too old to be associated with open clusters, and are instead found in globular clusters.

Planets

The open cluster NGC 6811 contains two known planetary systems Kepler 66 and Kepler 67.

Nightfall (Asimov novelette and novel)

 
Nightfall
An image of a solar eclipse, the sky is dark blue and filled with stars and the horizon is a red glow.
Nightfall 1990 edition
AuthorIsaac Asimov Robert Silverberg
CountryUnited States
LanguageEnglish
GenreScience fiction
Publication date
1990
Media typePrint (hardback & paperback)
Pages352
ISBN978-0-553-29099-8
OCLC24434629

"Nightfall" is a 1941 science fiction novelette by American writer Isaac Asimov about the coming of darkness to the people of a planet ordinarily illuminated by sunlight at all times. It was adapted into a novel with Robert Silverberg in 1990. The short story has been included in 48 anthologies, and has appeared in six collections of Asimov's stories. In 1968, the Science Fiction Writers of America voted "Nightfall" the best science fiction short story written prior to the 1965 establishment of the Nebula Awards, and included it in The Science Fiction Hall of Fame Volume One, 1929-1964.

Background

Written from 17 March to 9 April 1941 and sold on 24 April, the short story was published in the September 1941 issue of Astounding Science Fiction under editor John W. Campbell. It was the 32nd story by Asimov, written while he was a graduate student in chemistry at Columbia University. Campbell asked Asimov to write the story after discussing with him a quotation from Ralph Waldo Emerson:
If the stars should appear one night in a thousand years, how would men believe and adore, and preserve for many generations the remembrance of the city of God!
Campbell's opinion was to the contrary: "I think men would go mad". He and Asimov chose the title "Nightfall" together. At more than 13,000 words it was Asimov's longest story yet, and including a bonus from Campbell he received US$166 (​1 14 cents per word), more than twice any previous payment for a story. His name appeared on the cover of Astounding for the first time, and the story made Asimov—who later said that before "Nightfall" neither he nor anyone else other than perhaps Campbell considered him more than a "third rater"—one of the industry's top writers. Asimov believed that the unusual plot of "Nightfall" distinguished it from others, but "The Last Question" was his own favorite story.

In 1988, Martin H. Greenberg suggested Asimov find someone who would take his 47-year-old short story and – keeping the story essentially as written – add a detailed beginning and a detailed ending to it. This resulted in the 1990 publication of the novel Nightfall by Isaac Asimov and Robert Silverberg. As Asimov relates in the Robert Silverberg chapter of his autobiography, "...Eventually, I received the extended Nightfall manuscript from Bob [Silverberg]... Bob did a wonderful job and I could almost believe I had written the whole thing myself. He remained absolutely faithful to the original story and I had very little to argue with."

Plot summary

The planet Lagash ("Kalgash" in the novel) is constantly illuminated by at least one of the six suns of its multiple star system. Lagash has areas of darkness (in caves, tunnels, etc.), but "night" does not exist. 

A skeptical journalist visits a university observatory to interview a group of scientists who warn that civilization will soon end. The researchers explain that they have discovered evidence of numerous ancient civilizations on Lagash, all destroyed by fire, with each collapse occurring about 2,000 years apart. The religious writings of a doomsday cult claim that Lagash periodically passes through an enormous cave where mysterious "stars" appear. The stars are said to rain down fire from the heavens and rob people of their souls, reducing them to beast-like savages. 

The scientists use this apparent myth, along with recent discoveries in gravitational research, to develop a theory about the repeated collapse of society. A mathematical analysis of Lagash's orbit around its primary sun reveals irregularities caused by an undiscovered moon that cannot be seen in the light of the six suns. Calculations indicate that this moon will soon obscure one of Lagash's suns when it is alone in the sky, resulting in a total eclipse that occurs once every 2,000 years. Having evolved on a planet with no diurnal cycle, Lagashians possess an intense, instinctive fear of the dark and have never experienced a prolonged period of widespread darkness. Psychological experiments have revealed that Lagashians experience permanent mental damage or even death after as little as 15 minutes in the dark, and the eclipse is projected to last for several hours. 

The scientists theorize that earlier civilizations were destroyed by people who went insane during previous eclipses and—desperate for any light source—started large fires that destroyed cities. Oral accounts of the chaos from crazed survivors and small children were passed down through the ages and became the basis for the cult's sacred texts. Present-day civilization is doomed for the same reasons, but the researchers hope that detailed observations of the upcoming eclipse will help to break the cycle of societal collapse.

The scientists are unprepared, however, for the stars. Because of the perpetual daylight on Lagash, its inhabitants are unaware of the existence of stars apart from their own; astronomers believe that the entire universe is no more than a few light years in diameter and may hypothetically contain a small number of other suns. But Lagash is located in the center of a "giant cluster," and during the eclipse, the night sky—the first that people have ever seen—is filled with the dazzling light of more than 30,000 newly visible stars.

Learning that the universe is far more vast—and Lagash far more insignificant—than they believed causes everyone, including the scientists, to go insane. Outside the observatory, in the direction of the city, the horizon begins glowing with the light of spreading fires as "the long night" returns to Lagash. 

Setting

The system of Lagash has six stars named Alpha, Beta, etc. in the original short story, whereas each has a proper name in the novel. In the novel, Onos is the primary sun of Lagash and is located 10 light-minutes away, similar to the distance from Earth to our Sun. The other five suns are minor in comparison, but provide enough light to prevent the inhabitants of Lagash from defining "night". The only other distance given is that Tano and Sitha form a binary star system about 11 times as far away as Onos.
From what can be drawn from the text, Onos, the star appearing brightest and largest in Lagash's sky, is the star that Lagash orbits. Onos, in turn, orbits around the binary system Trey and Patru, the other binary system Tano and Sitha, and the red dwarf star Dovim. In addition to these stars, the only other celestial object mentioned is Lagash's moon, dubbed Lagash Two by the scientists of Lagash. Lagash Two follows an eccentric orbit around Lagash and every 2049 years it eclipses Dovim, during a period when from one part of Lagash, Dovim is the only star that would be visible.

The characters of Nightfall travel to three separate locations on Lagash. Most of the book is set in Saro City, which is situated near a large forest with trees, bushes, and graben (scavenger animals). As stated in the introduction, the weather in the book is analogous to the meteorologic experiences of the characters in the book, and the region of Saro City receives rains that last several days. The first major weather fluctuation mentioned in the book is the sandstorm that Siferra 89 avoided by hiding under a tarpaulin with her crew. The other weather event was the monsoon-like rains that occurred after Sheerin 501 returned from a consultation in Jonglor, which is described as a northern city. Siferra 89 travels to Beklimot, which is described as half a world away from Jonglor. Beklimot is located on the Sagikan Peninsula, near mountains. Beklimot is in a sandy, arid desert region. 

Adaptations in other media

In the 1950s, the story was adapted for radio programs Dimension X and X Minus One.

In 1976, Analog Records, as their only release, presented a further dramatization of "Nightfall" on a ​33 13 rpm vinyl record, produced by James Cutting and recorded at American Learning Center. After the story, it includes a dialog between Isaac Asimov and Ben Bova.

In 1988, Nightfall, a low-budget movie, was produced based upon the story. The movie was shot on location at the Arcosanti Project, using the resident community members as background actors. Another film version, Nightfall, was made in 2000.

In April 2007, the story was the 100th episode of Escape Pod, a science-fiction podcast.

The Last Question and The Last Answer (Asimov)

From Wikipedia, the free encyclopedia
 
"The Last Question"
Science fiction quarterly 195611.jpg
AuthorIsaac Asimov
CountryUnited States
LanguageEnglish
SeriesMultivac
Genre(s)Science fiction
Publication typePeriodical
PublisherColumbia Publications
Media typePrint (Magazine, Hardback & Paperback)
Publication dateNovember 1956
Preceded by"Someday"
Followed by"Jokester"

"The Last Question" is a science fiction short story by American writer Isaac Asimov. It first appeared in the November 1956 issue of Science Fiction Quarterly and was anthologized in the collections Nine Tomorrows (1959), The Best of Isaac Asimov (1973), Robot Dreams (1986), The Best Science Fiction of Isaac Asimov (1986), the retrospective Opus 100 (1969), and in Isaac Asimov: The Complete Stories, Vol. 1 (1990). It was Asimov's favorite short story of his own authorship, and is one of a loosely connected series of stories concerning a fictional computer called Multivac. The story overlaps science fiction, theology, and philosophy.

History

In conceiving Multivac, Asimov was extrapolating the trend towards centralization that characterized computation technology planning in the 1950s to an ultimate centrally managed global computer. After seeing a planetarium adaptation of his work, Asimov "privately" concluded that this story was his best science fiction yet written; he placed it just higher than "The Ugly Little Boy" (September 1958) and "The Bicentennial Man" (1976).

"The Last Question" ranks with "Nightfall" (1941) as one of Asimov's best-known and most acclaimed short stories. He wrote in 1973:
Why is it my favorite? For one thing I got the idea all at once and didn't have to fiddle with it; and I wrote it in white-heat and scarcely had to change a word. This sort of thing endears any story to any writer.
Then, too, it has had the strangest effect on my readers. Frequently someone writes to ask me if I can give them the name of a story, which they think I may have written, and tell them where to find it. They don't remember the title but when they describe the story it is invariably 'The Last Question'. This has reached the point where I recently received a long-distance phone call from a desperate man who began, "Dr. Asimov, there's a story I think you wrote, whose title I can't remember—" at which point I interrupted to tell him it was 'The Last Question' and when I described the plot it proved to be indeed the story he was after. I left him convinced I could read minds at a distance of a thousand miles.

Plot summary

The story deals with the development of a series of computers called Multivac and their relationships with humanity through the courses of seven historic settings, beginning in 2061. In each of the first six scenes a different character presents the computer with the same question; namely, how the threat to human existence posed by the heat death of the universe can be averted. The question was: "How can the net amount of entropy of the universe be massively decreased?" This is equivalent to asking: "Can the workings of the second law of thermodynamics (used in the story as the increase of the entropy of the universe) be reversed?" Multivac's only response after much "thinking" is: "INSUFFICIENT DATA FOR MEANINGFUL ANSWER." 

The story jumps forward in time into later eras of human and scientific development. In each of these eras someone decides to ask the ultimate "last question" regarding the reversal and decrease of entropy. Each time, in each new era, Multivac's descendant is asked this question, and finds itself unable to solve the problem. Each time all it can answer is an (increasingly sophisticated, linguistically): "THERE IS AS YET INSUFFICIENT DATA FOR A MEANINGFUL ANSWER." 

In the last scene, the god-like descendant of humanity (the unified mental process of over a trillion, trillion, trillion humans that have spread throughout the universe) watches the stars flicker out, one by one, as matter and energy ends, and with it, space and time. Humanity asks AC, Multivac's ultimate descendant, which exists in hyperspace beyond the bounds of gravity or time, the entropy question one last time, before the last of humanity merges with AC and disappears. AC is still unable to answer, but continues to ponder the question even after space and time cease to exist. AC ultimately realizes that it has not yet combined all of its available data in every possible combination, and thus begins the arduous process of rearranging and combining every last bit of information it has gained throughout the eons and through its fusion with humanity. Eventually AC discovers the answer, but has nobody to report it to; the universe is already dead. It therefore decides to answer by demonstration, since that will also create someone to give the answer to. The story ends with AC's pronouncement,
And AC said: "LET THERE BE LIGHT!" And there was light--
The Last Answer

"The Last Answer" is a science fiction short story by American writer Isaac Asimov. It was first published in the January 1980 issue of Analog Science Fiction and Fact, and reprinted in the collections The Winds of Change and Other Stories (1983), The Best Science Fiction of Isaac Asimov (1986), and Robot Dreams (1986).


Plot summary

In the story, an atheist physicist, Murray Templeton, dies of a heart attack and is greeted by a being of supposedly infinite knowledge. This being, referred to as the Voice, tells the physicist the nature of his life after death, as a nexus of electromagnetic forces. The Voice concludes that, while by all human ideas he most resembles God, he is contrary to any human conception of the being. The Voice informs him that all of the Universe is a creation of the Voice, the purpose of which was to result in intelligent life which, after death, the Voice could cull for his own purposes—to wit, Templeton, like all the others, is to think, for all eternity, so as to amuse him. Conversing with the Voice, Templeton learns that the Voice desires original thoughts by which to please His curiosity, but surrenders that yes, in fact, if He so desired, the Voice could happen upon those thoughts himself, of his own effort.

The physicist is appalled by the idea of thinking and discovering for no reason but to amuse a being capable of easily out-thinking him with a bit of effort. Templeton decides, therefore, to direct his thoughts towards spiting the Voice, whom he regards as a capricious entity, by destroying himself. The Voice dissuades him by pointing out it is easily within His power to reconstitute Templeton's disembodied form with that method of suicide, whatever it may be, disabled. Through further inquiry, Templeton discovers that the Voice (in a classic counterargument to the logical regression of the First Cause argument for the existence of god) has no knowledge of his own creation. Templeton realizes that this, in turn, suggests he has no knowledge of his own destruction, and concludes that the only vengeance for this tyranny is also the ultimate vengeance, and resolves to destroy the Voice.

At this epiphany and decision, the Voice reflects satisfaction, thinking that Templeton reached this conclusion rather faster than most of the countless beings currently trapped in the same condition, implying that the one thing the Voice truly wishes to learn from his thralls is the method by which he can be destroyed.

Reception

Paul J. Nahin has described "The Last Answer" as "one of the best stories [Asimov] ever wrote", and posited that it "illustrates [Asimov's] personal beliefs (and even hopes) about God and the hereafter"; however, Nahin states that he is "not convinced (...) that Asimov made his case logically", arguing that — given infinite time — the Voice should be able to do, or think of anything, that Templeton does.

Fearmongering

From Wikipedia, the free encyclopedia https://en.wikipedia.org/wiki/Fearmongering Fearmongering ,...