Search This Blog

Thursday, April 8, 2021

Beehive

From Wikipedia, the free encyclopedia

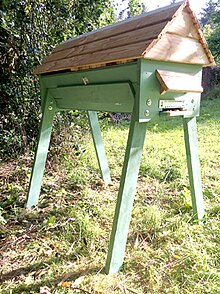
Painted wooden beehives with active honey bees

A beehive is an enclosed structure in which some honey bee species of the subgenus Apis live and raise their young. Though the word beehive is commonly used to describe the nest of any bee colony, scientific and professional literature distinguishes nest from hive. Nest is used to discuss colonies that house themselves in natural or artificial cavities or are hanging and exposed. Hive is used to describe an artificial/man-made structure to house a honey bee nest. Several species of Apis live in colonies, but for honey production the western honey bee (Apis mellifera) and the eastern honey bee (Apis cerana) are the main species kept in hives.

The nest's internal structure is a densely packed group of hexagonal prismatic cells made of beeswax, called a honeycomb. The bees use the cells to store food (honey and pollen) and to house the brood (eggs, larvae, and pupae).

Beehives serve several purposes: production of honey, pollination of nearby crops, housing supply bees for apitherapy treatment, and to try to mitigate the effects of colony collapse disorder. In America, hives are commonly transported so that bees can pollinate crops in other areas. A number of patents have been issued for beehive designs.

Honey bee nests

Natural bee colony in the hollow of a tree

Honey bees use caves, rock cavities and hollow trees as natural nesting sites. In warmer climates they may occasionally build exposed hanging nests. Members of other subgenera have exposed aerial combs. The nest is composed of multiple honeycombs, parallel to each other, with a relatively uniform bee space. It usually has a single entrance. Western honey bees prefer nest cavities approximately 45 litres in volume and avoid those smaller than 10 or larger than 100 litres. Western honey bees show several nest-site preferences: the height above ground is usually between 1 metre (3.3 ft) and 5 metres (16 ft), entrance positions tend to face downward, equatorial-facing entrances are favored, and nest sites over 300 metres (980 ft) from the parent colony are preferred. Bees usually occupy nests for several years.

The bees often smooth the bark surrounding the nest entrance, and coat the cavity walls with a thin layer of hardened plant resin called propolis. Honeycombs are attached to the walls along the cavity tops and sides, but small passageways are left along the comb edges. The basic nest architecture for all honeybees is similar: honey is stored in the upper part of the comb; beneath it are rows of pollen-storage cells, worker-brood cells, and drone-brood cells, in that order. The peanut-shaped queen cells are normally built at the lower edge of the comb.

Ancient hives

Bees were kept in man-made hives in Egypt in antiquity. The walls of the Egyptian sun temple of Nyuserre Ini from the 5th Dynasty, dated earlier than 2422 BC, depict workers blowing smoke into hives as they remove honeycombs. Inscriptions detailing the production of honey are found on the tomb of Pabasa from the 26th Dynasty (c. 650 BC), and describe honey stored in jars, and cylindrical hives.

The archaeologist Amihai Mazar cites 30 intact hives that were discovered in the ruins of the city of Rehov (2,000 residents in 900 BC, Israelites and Canaanites). This is evidence that an advanced honey industry existed in Israel, approximately 4,000 years ago. The beehives, made of straw and unbaked clay, were found in orderly rows, with a total of 150 hives, many broken. Ezra Marcus from the University of Haifa said the discovery provided a glimpse of ancient beekeeping seen in texts and ancient art from the Near East. An altar decorated with fertility figurines was found alongside the hives and may indicate religious practices associated with beekeeping. While beekeeping predates these ruins, this is the oldest apiary yet discovered.

Traditional hives

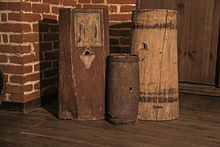
Hives from the collection of Radomysl Castle, Ukraine, 19th century
 
Beehiveswatercolour painted by Stanisław Masłowski in 1924, Silesian Museum in Katowice, Poland

Traditional beehives simply provided an enclosure for the bee colony. Because no internal structures were provided for the bees, the bees created their own honeycomb within the hives. The comb is often cross-attached and cannot be moved without destroying it. This is sometimes called a fixed-frame hive to differentiate it from the modern movable-frame hives. Harvest generally destroyed the hives, though there were some adaptations using extra top baskets which could be removed when the bees filled them with honey. These were gradually supplanted with box hives of varying dimensions, with or without frames, and finally replaced by newer modern equipment.

Honey from traditional hives was typically extracted by pressing – crushing the wax honeycomb to squeeze out the honey. Due to this harvesting, traditional beehives typically provided more beeswax, but far less honey, than a modern hive.

Four styles of traditional beehives are mud hives, clay/tile hives, skeps, and bee gums.

Mud hives

Bees in a baked clay jar in Malta

Mud hives are still used in Egypt and Siberia. These are long cylinders made from a mixture of unbaked mud, straw, and dung.

Clay hives

Clay tiles were the customary homes of kept bees in the eastern end of the Mediterranean. Long cylinders of baked clay were used in ancient Egypt, the Middle East and to some extent in Greece, Italy and Malta. They sometimes were used singly, but more often stacked in rows to provide some shade, at least for those not on top. Keepers would smoke one end to drive the bees to the other end while they harvested honey.

Skeps

Traditional manufacture of skeps from straw in England
 
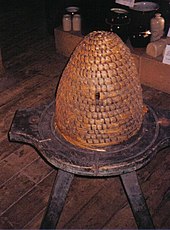
A bee skep at Dalgarven Mill. The base is part of an old cheese press

Skeps, baskets placed open-end-down, have been used to house bees for some 2000 years. Believed to have been first used in Ireland, they were initially made from wicker plastered with mud and dung but after the Middle Ages, almost all were made of straw. In northern and western Europe, skeps were made of coils of grass or straw. In its simplest form, there is a single entrance at the bottom of the skep. Again, there is no internal structure provided for the bees and the colony must produce its own honeycomb, which is attached to the inside of the skep.

Skeps have two disadvantages: beekeepers cannot inspect the comb for diseases and pests, and honey removal is difficult and often results in the destruction of the entire colony. To get the honey beekeepers either drove the bees out of the skep or, by using a bottom extension called an eke or a top extension called a cap, sought to create a comb with only honey in it. Quite often the bees were killed, sometimes using lighted sulfur, to allow the honeycomb to be removed. Skeps could also be squeezed in a vise to extract the honey.

As of 1998, most US states prohibited the use of skeps because they cannot be inspected for disease and parasites.

Later skep designs included a smaller woven basket (cap) on top over a small hole in the main skep. This cap acted as a crude super, allowing some honey to be extracted with less destruction of brood and bees. In England, such an extension piece consisting of a ring of about 4 or 5 coils of straw placed below a straw beehive to give extra room for brood rearing was called an eke, imp or nadir. An eke was used to give just a bit of extra room, or to "eke" some more space, a nadir is a larger extension used when a full story was needed beneath.

The term is derived from Old Norse skeppa, "basket". A person who made such woven beehives was called a "skepper", a surname that still exists in western countries. In England the thickness of the coil of straw was controlled using a ring of leather or piece of cow's horn called a "girth" and the coils of straw could be sewn together using strips of briar. Likenesses of skeps can be found in paintings, carvings and old manuscripts. The skep is often used on signs as an indication of industry ("the busy bee").

In the late 18th century, more complex skeps appeared with wooden tops with holes in them over which glass jars were placed. The comb was built in the glass jars, making the designs commercially attractive. The most popular style of skep in the latter half of the 18th century was called the "troubé-nade"--two skeps of the same design in two, round, narrow wooden posts placed at opposite ends of the main skeps. On their side, these wooden posts came in two forms (bicuspid or "twisted") like an upside-down bell, though this was less common. The wooden posts were often wood with painted faces or painted on a blackboard. These wooden skeps, with one, or sometimes two spouts on each side, were held by a pole from which they could be turned down. They were called "bicuspid" because they looked like the handle of a bicuspid or "twisted" bell. In contrast, the "troubé-nade" had three spouts like a bicuspid.

Bee gums

"Barć" in a museum in Białowieża

In the eastern United States, especially in the southeast, sections of hollow trees were used until the 20th century. These were called "gums" because they often were from black gum (Nyssa sylvatica) trees.

Sections of the hollow trees were set upright in "bee yards" or apiaries. Sometimes sticks or crossed sticks were placed under a board cover to give an attachment for the honeycomb. As with skeps, the harvest of honey from these destroyed the colony. Often the harvester would kill the bees before even opening their nest. This was done by inserting a metal container of burning sulfur into the gum.

Natural tree hollows and artificially hollowed tree trunks were widely used in the past by beekeepers in Central Europe. For example, in Poland such a beehive was called a barć and was protected in various ways from unfavorable weather conditions (rain, frost) and predators (woodpeckers, bears, pine martens, forest dormice). Harvest of honey from these did not destroy the colony, as only a protective piece of wood was removed from the opening and smoke was used to temporarily pacify the bees.

Bee gums are still used by beekeepers today, for bee species including Apis mellifera mellifera whose honey output is less than that of the more productive honeybee. Unlike most beehives (which are optimized for Apis mellifera and Apis cerana), the bee gum allows housing of other bee species. The bee gum allows the bees themselves to organize their nest.

Part of the reason why bee gums are still used is that this allows the producers of the honey to distinguish themselves from other honey producers and to ask a higher price for the honey. An example where bee gums are still used is Mont-Lozère, France, although in Europe they are referred to as log hives. The length of these log hives used is shorter than bee gums; they are hollowed out artificially and cut to a specific size.

Modern hives

A beekeeper inspects a hive frame with honeycomb, showing capped honey and brood cells. The modular design allows for easier management and non-destructive harvesting of honey and beeswax.

The earliest recognizably modern designs of beehives arose in the 19th century, though they were perfected from intermediate stages of progress made in the 18th century.

Intermediate stages in hive design were recorded for example by Thomas Wildman in 1768/1770, who described advances over the destructive old skep-based beekeeping so that the bees no longer had to be killed to harvest the honey. Wildman, for example, fixed a parallel array of wooden bars across the top of a straw hive or skep (with a separate straw top to be fixed on later) "so that there are in all seven bars of deal" [in a 10-inch-diameter (250 mm) hive] "to which the bees fix their combs". He also described using such hives in a multi-story configuration, foreshadowing the modern use of supers: he described adding (at the proper time) successive straw hives below, and eventually removing the ones above when free of brood and filled with honey, so that the bees could be separately preserved at the harvest for the following season. Wildman also described a further development, using hives with "sliding frames" for the bees to build their comb, foreshadowing more modern uses of movable-comb hives. Wildman acknowledged the advances in knowledge of bees previously made by Swammerdam, Maraldi, and de Reaumur – he included a lengthy translation of Reaumur's account of the natural history of bees – and he also described the initiatives of others in designing hives for the preservation of bee-life when taking the harvest, citing in particular reports from Brittany dating from the 1750s, due to Comte de la Bourdonnaye.

In 1814 Petro Prokopovych, the founder of commercial beekeeping in Malorossia, invented one of the first beehive frames which allowed an easier honey harvest.

The correct distance between combs for easy operations in beehives was described in 1845 by Jan Dzierżon as 1½ inches from the center of one top bar to the center of the next one. In 1848, Dzierżon introduced grooves into the hive's side walls replacing the strips of wood for moving top bars. The grooves were 8 mm × 8 mm (0.31 in × 0.31 in), the spacing later termed bee space. The Langstroth hive was the first successful top-opened hive with movable frames. The Langstroth hive was however a direct descendant of Dzierżon's hive designs.

Hives can be vertical or horizontal. There are three main types of modern hive in common use worldwide:

Most hives have been optimized for Apis mellifera and Apis cerana. Some other hives have been designed and optimized for some meliponines such as Melipona beecheii. Examples of such hives are the Nogueira-Neto hive and the UTOB hive.

Vertical hives

Langstroth hives

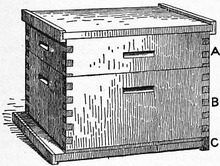
Langstroth hive

The key innovation of this type of hive was the use of vertically hanging frames on which bees build their comb. The modern Langstroth hive consists of:

  • Bottom board: this has an entrance for the bees.
  • Boxes containing frames for brood and honey: the lowest box for the queen to lay eggs, and boxes above where honey is stored
  • Inner cover and top cap providing weather protection

Named for their inventor, Rev. Lorenzo Langstroth, Langstroth hives are probably the most commonly used. Langstroth patented his design in the United States on October 5, 1852 originally for comb honey production, but it has become the standard style hive for many of the world's beekeepers, both professional and amateurs.

A common feature of Langstroth hives is the use of specific bee spaces between frames and other parts so that bees are not likely to glue together nor fill these spaces with burr comb (comb joining adjacent frames). The sizes of hive bodies (rectangular boxes without tops or bottoms placed one on top of another) and internal frames are relatively well defined for a particular style. Langstroth hive bodies are rectangular in shape and can be made from a variety of materials that can be stacked to expand the usable space for the bees.

Inside the boxes, frames are hung parallel to each other. Langstroth frames are thin rectangular structures made of wood or plastic and typically have a plastic or wax foundation on which the bees draw out the comb. The frames hold the beeswax honeycomb formed by the bees. Eight or ten frames side by side (depending on the size of the box) will fill the hive body and leave the right amount of bee space between each frame and between the end frames and the hive body.

Langstroth frames can be reinforced with wire, making it possible to spin the honey out of the comb in a centrifuge. As a result, the empty frames and comb can be returned to the beehive for re-filling by the bees. Creating honeycomb involves a significant energy investment, conservatively estimated at 6.25 kilograms of honey needed to create 1 kilogram of comb in temperate climates. Reusing comb can thus increase the productivity of a beekeeping enterprise.

This class of hives includes several other styles, which differ mainly in the size and number of frames used. These include:

  • BS National hive: This smaller version of the Langstroth class of hive is designed for the less prolific and more docile Buckfastleigh bee strain and for standard dimension parts. It is based on square boxes (460 mm side), with a 225 mm standard/brood box, and shallow 150 mm Supers typically used for honey. The construction of the boxes is relatively complicated (eight pieces), but strong and with easy-to-hold handles. The boxes take frames of 432 mm length, with a relatively long lug (38 mm) and a comb width of 355 mm.
  • BS Commercial hive: A variation with the same cross-sectional dimensions as a BS National hive (460 mm x 460 mm), but deeper brood box (267 mm/10.5") and supers intended for more prolific bees. The internal structure of the boxes is also simpler, resulting in wider frames (406 mm/16") with shorter handles or lugs. Some find these supers too heavy when full of honey and therefore use National supers on top of a Commercial brood box.
  • Rose Hive: A hive and method of management developed by Tim Rowe, it is a variation on the BS National hive. The Rose hive maintains the same cross-sectional dimensions of the National hive (460 mm x 460 mm), but opts for a single depth box of 190 mm (7.5"). The single box and frame size are used for both brood and honey supers. Standardizing on one size reduces complexity and allows for the movement of brood or honey frames to any other position in the hive. A queen excluder is avoided, allowing the queen freedom to move where she wants. Boxes are added to the hive above the brood and below the supers. The colony can expand during large sap flow and retract to lower portions of the hive as the colony shrinks in the fall. When collecting honey, brood and honey frames can be relocated up or down the hive, as needed.
  • Smith hive
  • Segeberger Beute (German)
  • D.E. hive
  • Frankenbeute (German)
  • Normalmass (German)
  • Dadant hive: Developed by Charles Dadant (developed in the USA in 1920 from the Dadant-Blatt hive)
  • Hyper Hyve: Designed by Mike James and incorporates an insulated hive with integrated monitoring.
  • Flow Hive: A proprietary design for a beehive launched in 2015 on Indiegogo. It was based on a design by a father and son team of beekeepers and inventors, Stuart and Cedar Anderson from Australia to find a way of extracting honey from the comb without the need to open the hive. The system uses food-grade plastic frames which can be split using a special tool and the honey then flows into containers without the need to remove any frames. Some authors have opposed the flow hive.

Warré hives

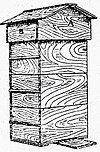
Warré Hive

The Warré hive was invented by the abbot Émile Warré, and is also called "ruche populaire" (fr) or "The People's Hive" (en). It is a modular and storied design similar to a Langstroth hive. The hive body is made of boxes stacked vertically; however, it uses top bars for comb support instead of full frames similar to a Top-Bar Hive, as a general rule. The popularity of this hive is growing among 'sustainable-practice' beekeepers.

The Warre hive differs from other stacked hive systems in one fundamental aspect: when the bees need more space as the colony expands, the new box is "nadired". i.e. positioned underneath the existing box(es). This serves the purpose of warmth retention within the brood nest of the hive, considered vital to colony health.

WBC hives

WBC hive

The WBC, invented by and named after William Broughton Carr in 1890, is a double-walled hive with an external housing that splays out towards the bottom of each frame covering a standard box shape hive inside. The WBC is in many respects the 'classic' hive as represented in pictures and paintings, but despite the extra level of insulation for the bees offered by its double-walled design, many beekeepers avoid it, owing to the inconvenience of having to remove the external layer before the hive can be examined.

CDB hives

CDB hive

In 1890, Charles Nash Abbott (1830–1894), advisor to Ireland's Department of Agriculture and Technical Instruction, designed a new Congested Districts Board (CDB) hive in Dublin, Ireland. It was commissioned by the Irish Congested District Board which provided support for rural populations until its absorption in the department of Agriculture.

AZ hives

One of the most famous Slovenian beekeepers was Anton Žnideršič (1874–1947). He developed the AZ hive house and hive box widely used today in Slovenia.

Horizontal hives

Top-bar hives

Top bar hive

The top-bar or Kenya hives were developed as a lower-cost alternative to the standard Langstroth hives and equipment. They are becoming very popular in the US due to their alignment with the organic, treatment-free philosophies of many new beekeeping devotees in the United States. They are also popular, owing to their simplicity and low cost, in developing countries. Top-bar hives have movable comb and make use of the concept of bee space.

The top-bar hive is so named because the bees draw their comb from a top bar suspended across the top of a cavity and not inside a full rectangular frame with sides and a bottom bar. The beekeeper does not provide foundation wax (or provides only a small starter piece of foundation) for the bees to build from. The bees build the comb so it hangs down from the top bar. This is in keeping with the way bees build wax in a natural cavity.

The hive body of a common style of a top-bar hive is often shaped like an inverted trapezoid. Unlike the Langstroth design, this style of a top-bar hive is expanded horizontally, not vertically. The top-bar design is a single, much longer box, with the bars hanging in parallel. This common style is sometimes referred to as a horizontal top bar hive or hTBH.

Because top bars are used as opposed to frames, the honey is usually extracted by crushing and straining rather than centrifuging. Because the bees have to rebuild their comb after the honey is harvested, a top-bar hive yields a beeswax harvest in addition to honey. The bees store most of their honey separately from the areas where they are raising the brood. For this reason, bees are not killed when harvesting from a top-bar hive.

Variations:

  • Dartington long deep (DLD) hive: It can take up to 24 14 × 12 inch frames. It is possible to have two colonies in the brood box as there is an entrance at either end. It has half-size honey supers, which take six frames that are lighter than full supers and are correspondingly easier to lift. The Dartington was originally developed by Robin Dartington so that he could keep bees on his London rooftop.
  • Beehaus: A proprietary design for a beehive launched in 2009 based on the Dartington long deep. It is a hybrid of the top-bar hive and a Langstroth hive.

Long box hive

The long box hive is a single story hive utilizing fully enclosed frames (per the dimensions of Langstroth hives or deeper by variation) but is worked horizontally in the manner of Kenya/Tanzanian top-bar hives. This non-stacked style had higher popularity a century ago in the Southeast United States but faded from use due to lack of portability. With the recent popularity of horizontal top-bar hives, the long box hive is gaining renewed but limited utilization. Alternative names are "new idea hive", "single story hive", "Poppleton hive", or simply "long hive".

Symbolism

Coat of arms of Börger
 
A doorknob of a Mormon temple

The beehive is a commonly used symbol in various human cultures. In Europe, it was used by the Romans as well as in heraldry. Most heraldic representation of beehives is in the form of a skep. Bees (and beehives) have some symbols often associated with them though it is not universal:

So much has been written upon the habits and virtues of bees, that it is unnecessary to enlarge upon the subject .... Suffice it to say, that they imply industry, wealth, bounty, and wisdom in the bearer.

— William Newton

In modern times, it is a key symbol in Freemasonry. In masonic lectures, it represents industry and co-operation, and as a metaphor cautioning against intellectual laziness, warning that "he that will so demean himself as not to be endeavoring to add to the common stock of knowledge and understanding, maybe deemed a drone in the hive of nature, a useless member of society, and unworthy of our protection as Masons."

The beehive appears on the 3rd Degree emblems on the Tracing Board of Royal Cumberland No. 41, Bath and is explained as such:

The Beehive teaches us that as we are born into the world rational and intelligent beings, so ought we also to be industrious ones, and not stand idly by or gaze with listless indifference on even the meanest of our fellow creatures in a state of distress if it is in our power to help them without detriment to ourselves or our connections; the constant practice, – of this virtue is enjoined on all created beings, from the highest seraph in heaven to the meanest reptile that crawls in the dust.

— Explanation on the 8th century ritual

The beehive is also used with similar meaning by The Church of Jesus Christ of Latter-day Saints, or Mormons. From Mormon usage it has become one of the State symbols of Utah).

Relocation and destruction

Relocation

Beekeepers and companies may remove unwanted honey bee nests from structures to relocate them into an artificial hive. This process is called a "cut out".

Destruction

Animal destruction

Black bears destroy hives in their quest for honey and protein rich larvae. Grizzly bears will also eat beehives and are harder to dissuade from taking several beehives.

Hives erected by humans as a defense for their crops against elephants are sometimes destroyed by elephants. These hives are hung on a single metal wire that encircles the crop field of some farms in African elephant territory. The installation is called a BeeHive Fence and was conceived by Lucy King.

Human destruction

Humans have historically destroyed nests and hives of honey-producing bee species in order to obtain honey and beeswax and other bee products.

Humans may also determine that a beehive must be destroyed in the interest of public safety or in the interest of preventing the spread of bee diseases. The U.S. state of Florida destroyed the hives of Africanized honey bees, in 1999. The state of Alaska has issued regulations governing the treatment of diseased beehives via burning followed by burial, fumigation using ethylene oxide or other approved gases, sterilization by treatment with lye, or by scorching. In New Zealand and the United Kingdom, the treatment of hives infected with the disease American foulbrood with antibiotics is prohibited, and beekeepers are required by law to destroy such colonies and hives with fire.

Pesticides in the United States

From Wikipedia, the free encyclopedia
 

Pesticides in the United States are used predominantly by the agricultural sector, but approximately a quarter of them are used in houses, yards, parks, golf courses, and swimming pools.

Use

Atrazine

Atrazine is the second-most commonly used herbicide in the United States after glyphosate, with application of approximately 76,000,000 pounds (34,000 t) of the active ingredient in 1997.

The U.S. EPA said in the 2003 Interim Reregistration Eligibility Decision, "The total or national economic impact resulting from the loss of atrazine to control grass and broadleaf weeds in corn, sorghum and sugar cane would be in excess of $2 billion per year if atrazine were unavailable to growers." In the same report, it added the "yield loss plus increased herbicide cost may result in an average estimated loss of $28 per acre" if atrazine were unavailable to corn farmers.

In 2006, the EPA concluded that the triazine herbicides posed "no harm that would result to the general U.S. population, infants, children or other... consumers."

EPA concluded, in 2007, that atrazine does not adversely affect amphibian gonadal development based on a review of laboratory and field studies, including studies submitted by the registrant and studies published in the scientific literature.

In 2009, Paul Winchester, a professor of pediatrics at the Indiana University School of Medicine, wrote a paper that was published in Acta Paediatrica reviewing national records for thirty million births, found that children conceived between April and July, when the concentration of atrazine, mixed with other pesticides, in water is highest, were more likely to have genital birth defects.

A 2010 study, conducted by the U.S. Geological Survey, observed substantial adverse reproductive effects on fish from atrazine exposure at concentrations below the USEPA water-quality guideline.

In 2014, New Yorker writer Rachel Aviv reported that atrazine manufacturer Syngenta might have been orchestrating an attack on the "scientific credibility" of not just Tyrone Hayes, the lead critic of atrazine use, but other scientists as well, whose studies have shown atrazine to have adverse effects on the environment and/or human and animal health.

DDT

The use of DDT in the United States is banned, except for a limited exemption for public health uses. The ban, enacted in 1972, is due in a large part to the influence of the book, Silent Spring, written by Rachel Carson. The ban on DDT is cited by scientists as a major factor in the comeback of the bald eagle in the continental United States.

Regulation

The Federal Insecticide, Fungicide, and Rodenticide Act (FIFRA) was first passed in 1947, giving the United States Department of Agriculture responsibility for regulating pesticides. In 1972, FIFRA underwent a major revision and transferred responsibility of pesticide regulation to the Environmental Protection Agency and shifted emphasis to protection of the environment and public health.

Issues

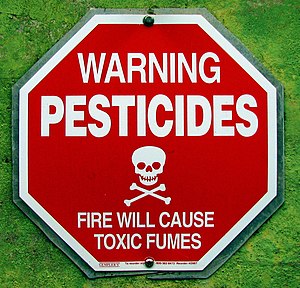
Placard against pesticides on a window.

Pesticides were found to pollute every stream and more than 90% of wells sampled in a study by the US Geological Survey. Pesticide residues have also been found in rain and groundwater.

United States agricultural workers experience 10,000 cases or more of physician-diagnosed pesticide poisoning annually.

The National Academy of Sciences estimates that between 4,000 and 20,000 cases of cancer are caused per year by the allowed amounts of pesticide residues in food.

Effects on biota

Resistance

Pesticide resistance has evolved in insect and plant populations in the United States. Some insects and plants have evolved resistance to multiple pesticides.

Birds

The USDA and USFWS estimate that more than 67 million birds are killed by pesticides each year in the U.S.

Fish

The United States Department of Agriculture and the United States Fish and Wildlife Service estimate that between 6 and 14 million fish are killed by pesticides each year in the U.S.

Amphibians

U.S. scientists have found that some pesticides used in farming disrupt the nervous systems of frogs, and that use of these pesticides is correlated with a decline in the population of frogs in the Sierra Nevada.

Some scientists believe that certain common pesticides already exist at levels capable of killing amphibians in California. They warn that the breakdown products of these pesticides may be 10 to 100 times more toxic to amphibians than the original pesticides. Direct contact of sprays of some pesticides (either by drift from nearby applications or accidental or deliberate sprays) may be highly lethal to amphibians.

Being downwind from agricultural land on which pesticides are used has been linked to the decline in population of threatened frog species in California.

In Minnesota, pesticide use has been linked causally to congenital deformities in frogs such as eye, mouth, and limb malformations. Researchers in California found that similar deformities in frogs in the U.S. and Canada may have been caused by breakdown products from pesticides whose use is categorized as not posing a threat.

Pesticide residue in food

The Pesticide Data Program, a program started by the United States Department of Agriculture is the largest tester of pesticide residues on food sold in the United States. It began in 1991 and tests food for the presence of various pesticides and if they exceed EPA tolerance levels for samples collected close to the point of consumption. Their most recent summary results are from the 2016 where more than 99% of samples were well below EPA tolerance levels. Tolerance violations were detected in 0.46 percent samples tested out of 10,365 samples. Of the 48 samples, 26 were domestic, 20 were of foreign origin, and 2 were of unknown origin.

Health effects of pesticides

From Wikipedia, the free encyclopedia
 
Pesticide toxicity
Warning2Pesticides.jpg

Health effects of pesticides may be acute or delayed in those who are exposed. A 2007 systematic review found that "most studies on non-Hodgkin lymphoma and leukemia showed positive associations with pesticide exposure" and thus concluded that cosmetic use of pesticides should be decreased. Strong evidence also exists for other negative outcomes from pesticide exposure including neurological problems, birth defects, fetal death, and neurodevelopmental disorder.

According to The Stockholm Convention on Persistent Organic Pollutants (2001), 9 of the 12 most dangerous and persistent chemicals were pesticides, so many have now been withdrawn from use.

Acute effects

Acute health problems may occur in workers that handle pesticides, such as abdominal pain, dizziness, headaches, nausea, vomiting, as well as skin and eye problems. In China, an estimated half-million people are poisoned by pesticides each year, 500 of whom die. Pyrethrins, insecticides commonly used in common bug killers, can cause a potentially deadly condition if breathed in.

Long-term effects

Cancer

Many studies have examined the effects of pesticide exposure on the risk of cancer. Associations have been found with: leukemia, lymphoma, brain, kidney, breast, prostate, pancreas, liver, lung, and skin cancers. This increased risk occurs with both residential and occupational exposures. Increased rates of cancer have been found among farm workers who apply these chemicals. A mother's occupational exposure to pesticides during pregnancy is associated with an increases in her child's risk of leukemia, Wilms' tumor, and brain cancer. Exposure to insecticides within the home and herbicides outside is associated with blood cancers in children.

Neurological

Evidence links pesticide exposure to worsened neurological outcomes.

The United States Environmental Protection Agency finished a 10-year review of the organophosphate pesticides following the 1996 Food Quality Protection Act, but did little to account for developmental neurotoxic effects, drawing strong criticism from within the agency and from outside researchers. Comparable studies have not been done with newer pesticides that are replacing organophosphates.

Reproductive effects

Strong evidence links pesticide exposure to birth defects, fetal death and altered fetal growth. Agent Orange, a 50:50 mixture of 2,4,5-T and 2,4-D, has been associated with bad health and genetic effects in Malaya and Vietnam. It was also found that offspring that were at some point exposed to pesticides had a low birth weight and had developmental defects.

Fertility

A number of pesticides including dibromochlorophane and 2,4-D has been associated with impaired fertility in males. Pesticide exposure resulted in reduced fertility in males, genetic alterations in sperm, a reduced number of sperm, damage to germinal epithelium and altered hormone function.

Other

Some studies have found increased risks of dermatitis in those exposed.

Additionally, studies have indicated that pesticide exposure is associated with long-term respiratory problems. Summaries of peer-reviewed research have examined the link between pesticide exposure and neurologic outcomes and cancer, perhaps the two most significant things resulting in organophosphate-exposed workers.

According to researchers from the National Institutes of Health (NIH), licensed pesticide applicators who used chlorinated pesticides on more than 100 days in their lifetime were at greater risk of diabetes. One study found that associations between specific pesticides and incident diabetes ranged from a 20 percent to a 200 percent increase in risk. New cases of diabetes were reported by 3.4 percent of those in the lowest pesticide use category compared with 4.6 percent of those in the highest category. Risks were greater when users of specific pesticides were compared with applicators who never applied that chemical.

Route of exposure

People can be exposed to pesticides by a number of different routes including: occupation, in the home, at school and in their food.

There are concerns that pesticides used to control pests on food crops are dangerous to people who consume those foods. These concerns are one reason for the organic food movement. Many food crops, including fruits and vegetables, contain pesticide residues after being washed or peeled. Chemicals that are no longer used but that are resistant to breakdown for long periods may remain in soil and water and thus in food.

The United Nations Codex Alimentarius Commission has recommended international standards for maximum residue limits (MRLs), for individual pesticides in food.

In the EU, MRLs are set by DG-SANCO.

In the United States, levels of residues that remain on foods are limited to tolerance levels that are established by the U.S. Environmental Protection Agency and are considered safe. The EPA sets the tolerances based on the toxicity of the pesticide and its breakdown products, the amount and frequency of pesticide application, and how much of the pesticide (i.e., the residue) remains in or on food by the time it is marketed and prepared. Tolerance levels are obtained using scientific risk assessments that pesticide manufacturers are required to produce by conducting toxicological studies, exposure modeling and residue studies before a particular pesticide can be registered, however, the effects are tested for single pesticides, and there is little information on possible synergistic effects of exposure to multiple pesticide traces in the air, food and water.

Strawberries and tomatoes are the two crops with the most intensive use of soil fumigants. They are particularly vulnerable to several types of diseases, insects, mites, and parasitic worms. In 2003, in California alone, 3.7 million pounds (1,700 metric tons) of metham sodium were used on tomatoes. In recent years other farmers have demonstrated that it is possible to produce strawberries and tomatoes without the use of harmful chemicals and in a cost-effective way.

Exposure routes other than consuming food that contains residues, in particular pesticide drift, are potentially significant to the general public.

Some pesticides can remain in the environment for prolonged periods of time. For example, most people in the United States still have detectable levels of DDT in their bodies even though it was banned in the US in 1972.

Prevention

Pesticides exposure cannot be studied in placebo controlled trials as this would be unethical. A definitive cause effect relationship therefore cannot be established. Consistent evidence can and has been gathered through other study designs. The precautionary principle is thus frequently used in environmental law such that absolute proof is not required before efforts to decrease exposure to potential toxins are enacted.

The American Medical Association recommend limiting exposure to pesticides. They came to this conclusion due to the fact that surveillance systems currently in place are inadequate to determine problems related to exposure. The utility of applicator certification and public notification programs are also of unknown value in their ability to prevent adverse outcomes.

Epidemiology

The World Health Organization and the UN Environment Programme estimate that each year, 3 million workers in agriculture in the developing world experience severe poisoning from pesticides, about 18,000 of whom die. According to one study, as many as 25 million workers in developing countries may suffer mild pesticide poisoning yearly. Detectable levels of 50 different pesticides were found in the blood of a representative sample of the U.S. population.

Research conflicts of interest

Concerns regarding conflict of interests regarding the research base have been raised. After his death Richard Doll of the Imperial Cancer Research Fund in England was found to have undisclosed ties to industry funding.

Other animals

A number of pesticides including the neonicotinoids clothianidin, dinotefuran, imidacloprid are toxic to bees. Exposure to pesticides may be one of the contributory factors to colony collapse disorder. A study in North Carolina indicated that more than 30 percent of the quail tested were made sick by one aerial insecticide application. Once sick, wild birds may neglect their young, abandon their nests, and become more susceptible to predators or disease.

Carbon footprint

From Wikipedia, the free encyclopedia

A carbon footprint is the total greenhouse gas (GHG) emissions caused by an individual, event, organization, service, or product, expressed as carbon dioxide equivalent. Greenhouse gases, including the carbon-containing gases carbon dioxide and methane, can be emitted through the burning of fossil fuels, land clearance and the production and consumption of food, manufactured goods, materials, wood, roads, buildings, transportation and other services. The term was popularized by a $250 million advertising campaign by the oil and gas company BP in an attempt to move public attention away from restricting the activities of fossil fuel companies and onto individual responsibility for solving climate change.

In most cases, the total carbon footprint cannot be calculated exactly because of inadequate knowledge of and data about the complex interactions between contributing processes, including the influence of natural processes that store or release carbon dioxide. For this reason, Wright, Kemp, and Williams proposed the following definition of a carbon footprint:

A measure of the total amount of carbon dioxide (CO2) and methane (CH4) emissions of a defined population, system or activity, considering all relevant sources, sinks and storage within the spatial and temporal boundary of the population, system or activity of interest. Calculated as carbon dioxide equivalent using the relevant 100-year global warming potential (GWP100).

The global average annual carbon footprint per person in 2014 was about 5 tonnes CO2eq.

Background

Human activities are one of the main causes of greenhouse gas emissions. These increase the earth's temperature and are emitted from fossil fuel usage in electricity and other byproducts of manufacturing. The major effects of such practices mainly consist of climate changes, such as extreme precipitation and acidification and warming of oceans. Climate change has been occurring since the start of the Industrial Revolution in the 1820s. Due to humans' heavy reliance on fossil fuels, energy usage, and constant deforestation, the amount of greenhouse gas in the atmosphere is increasing, which makes reducing a greenhouse gas footprint harder to achieve. However, there are several ways to reduce one's greenhouse gas footprint, choosing more energy-efficient eating habits, using more energy efficient household appliances, increase usage of fuel efficient cars, and saving electricity.

Greenhouse gases (GHGs) are gases that increase the temperature of the Earth due to their absorption of infrared radiation. Although some emissions are natural, the rate of which they are being produced has increased because of humans. These gases are emitted from fossil fuel usage in electricity, in heat and transportation, as well as being emitted as byproducts of manufacturing. The most common GHGs are carbon dioxide (CO2), methane (CH4), nitrous oxide (N2O), and many fluorinated gases. A greenhouse gas footprint is the numerical quantity of these gases that a single entity emits. The calculations can be computed ranging from a single person to the entire world.

Measuring carbon footprints

An individual's, nation's, or organization's carbon footprint can be measured by undertaking a GHG emissions assessment, a life cycle assessment, or other calculative activities denoted as carbon accounting. Once the size of a carbon footprint is known, a strategy can be devised to reduce it, for example, by technological developments, energy efficiency improvements, better process and product management, changed Green Public or Private Procurement (GPP), carbon capture, consumption strategies, carbon offsetting and others.

For calculating personal carbon footprints, several free online carbon footprint calculators exist including a few supported by publicly available peer-reviewed data and calculations including the University of California, Berkeley's CoolClimate Network research consortium and CarbonStory. These websites ask you to answer more or less detailed questions about your diet, transportation choices, home size, shopping and recreational activities, usage of electricity, heating, and heavy appliances such as dryers and refrigerators, and so on. The website then estimates your carbon footprint based on your answers to these questions. A systematic literature review was conducted to objectively determine the best way to calculate individual/household carbon footprints. This review identified 13 calculation principles and subsequently used the same principles to evaluate the 15 most popular online carbon footprint calculators. A recent study's results by Carnegie Mellon's Christopher Weber found that the calculation of carbon footprints for products is often filled with large uncertainties. The variables of owning electronic goods such as the production, shipment, and previous technology used to make that product, can make it difficult to create an accurate carbon footprint. It is important to question, and address the accuracy of Carbon Footprint techniques, especially due to its overwhelming popularity.

Calculating the carbon footprint of industry, product, or service is a complex task. One tool industry uses Life-cycle assessment (LCA), where carbon footprint may be one of many factors taken into consideration when assessing a product or service. The International Organization for Standardization has a standard called ISO 14040:2006 that has the framework for conducting an LCA study. ISO 14060 family of standards provides further sophisticated tools for quantifying, monitoring, reporting and validating or verifying of GHG emissions and removals. Another method is through the Greenhouse Gas Protocol, a set of standards for tracking greenhouse gas emissions (GHG) across scope 1, 2 and 3 emissions within the value chain.

Predicting the carbon footprint of a process is also possible through estimations using the above standards. By using Emission intensities/Carbon intensities and the estimated annual use of fuel, chemical, or other inputs, the carbon footprint can be determined while a process is being planned/designed.

Origin of the concept

The concept and name of the carbon footprint derive from the ecological footprint concept, which was developed by William E. Rees and Mathis Wackernagel in the 1990s. While carbon footprints are usually reported in tons of emissions (CO2-equivalent) per year, ecological footprints are usually reported in comparison to what the planet can renew. This assesses the number of "earths" that would be required if everyone on the planet consumed resources at the same level as the person calculating their ecological footprint. The carbon footprint is one part of the ecological footprint. Carbon footprints are more focused than ecological footprints since they measure merely emissions of gases that cause climate change into the atmosphere.

Carbon footprint is one of a family of footprint indicators, which also include ecological footprints, water footprints and land footprints.

The carbon part was popularized by a large campaign of BP in 2005, designed by Ogilvy . The deceptive PR campaign instructed individuals to calculate their personal footprints and provided ways for people to lower their own impact, while BP itself continued to extract just as much fossil fuels. The use of household carbon footprint calculators was called "effective propaganda" as strategic communication to shift responsibility of climate change-causing pollution away from the corporations and institutions that created a society where carbon emissions are unavoidable and onto personal lifestyle choices.

Direct carbon emissions

Direct or 'scope 1' carbon emissions come from sources that are directly from the site that is producing a product or delivering a service. An example for industry would be the emissions related to burning a fuel on site. On the individual level, emissions from personal vehicles or gas burning stoves would fall under scope 1.

Indirect carbon emissions

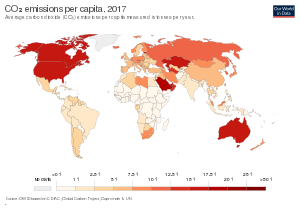
Consumption-based CO₂ emissions per capita, 2017

Indirect carbon emissions are emissions from sources upstream or downstream from the process being studied, also known as scope 2 or scope 3 emissions.

Examples of upstream, indirect carbon emissions may include:

  • Transportation of materials/fuels
  • Any energy used outside of the production facility
  • Wastes produced outside of the production facility

Examples of downstream, indirect carbon emissions may include:

  • Any end-of-life process or treatments
  • Product and waste transportation
  • Emissions associated with selling the product

Scope 2 emissions are the other indirect related to purchased electricity, heat, and/or steam used on site. Scope 3 emissions are all other indirect emissions derived from the activities of an organisation but from sources which they do not own or control.

Reporting

In the US, the EPA has broken down electricity emission factors by state.

In the UK, DEFRA provides emission factors going back to 2002 covering scope 1, 2 and 3. DEFRA no longer provide international emission factors and refer visitors to the IEA who provide free highlights and paid for details covering Scope 1 and 2.

Reducing carbon footprints

Ways to reduce personal carbon footprint

A July 2017 study published in Environmental Research Letters found that the most significant way individuals could mitigate their own carbon footprint is to have one less child ("an average for developed countries of 58.6 tonnes CO2-equivalent (tCO2e) emission reductions per year"), followed by living car-free (2.4 tonnes CO2-equivalent per year), forgoing air travel (1.6 tonnes CO2-equivalent per trans-Atlantic trip) and adopting a plant-based diet (0.8 tonnes CO2-equivalent per year). The study also found that most government resources on climate change focus on actions that have a relatively modest effect on greenhouse gas emissions, and concludes that "a US family who chooses to have one fewer child would provide the same level of emissions reductions as 684 teenagers who choose to adopt comprehensive recycling for the rest of their lives".

An option is to drive less. Walking, biking, carpooling, mass transportation and combining trips result in burning less fuel and releasing fewer emissions into the atmosphere.

The choice of diet is a major influence on a person's carbon footprint. Animal sources of protein (especially red meat), rice (typically produced in high methane-emitting paddies), foods transported long-distance or via fuel-inefficient transport (e.g., highly perishable produce flown long-distance) and heavily processed and packaged foods are among the major contributors to a high carbon diet. Scientists at the University of Chicago have estimated "that the average American diet – which derives 28% of its calories from animal foods – is responsible for approximately one and a half more tonnes of greenhouse gasses – as CO
2
equivalents – per person, per year than a fully plant-based, or vegan, diet." Their calculations suggest that even replacing one third of the animal protein in the average American's diet with plant protein (e.g., beans, grains) can reduce the diet's carbon footprint by half a tonne. Exchanging two-thirds of the animal protein with plant protein is roughly equivalent to switching from a Toyota Camry to a Prius. Finally, throwing food out not only adds its associated carbon emissions to a person or household's footprint, but it also adds the emissions of transporting the wasted food to the garbage dump and the emissions of food decomposition, mostly in the form of the highly potent greenhouse gas, methane.

Options to reduce the carbon footprint of humans include Reduce, Reuse, Recycle, Refuse. This can be done by using reusable items such as thermoses for daily coffee or plastic containers for water and other cold beverages rather than disposable ones. If that option isn't available, it is best to properly recycle the disposable items after use. When one household recycles at least half of their household waste, they can save 1.2 tons of carbon dioxide annually.

Another option for reducing the carbon footprint of humans is to use less air conditioning and heating in the home. By adding insulation to the walls and attic of one's home, and installing weather stripping, or caulking around doors and windows one can lower their heating costs more than 25 percent. Similarly, one can very inexpensively upgrade the "insulation" (clothing) worn by residents of the home. For example, it's estimated that wearing a base layer of long underwear with top and bottom, made from a lightweight, super-insulating fabric like microfleece, can conserve as much body heat as a full set of clothing, allowing a person to remain warm with the thermostat lowered by over 5 °C. These measures all help because they reduce the amount of energy needed to heat and cool the house. One can also turn down the heat while sleeping at night or away during the day, and keep temperatures moderate at all times. Setting the thermostat just 2 degrees lower in winter and higher in summer could save about 1 ton of carbon dioxide each year.

The carbon handprint movement emphasizes individual forms of carbon offsetting, like using more public transportation or planting trees in deforested regions, to reduce one's carbon footprint and increase their "handprint." The Handprint is being used around the world to strengthen action towards the fulfillment of the UN Sustainable Development Goals.

Ways to reduce industry's carbon footprint

The most powerful industrial climate actions are: refrigerant management (90 billion tonnes of CO2e 2017–2050, since refrigerants have thousands of times the warming potential of CO2); land-based wind turbines for electricity (85 billion); reduced food waste (71 billion); and restoring tropical forests by ending use of the land for other purposes (61 billion). They calculate benefits cumulatively to 2050, rather than annually, because industrial actions have long lead times.

A product, service, or company's carbon footprint can be affected by several factors including, but not limited to:

  • Energy sources
  • Offsite electricity generation
  • Materials

These factors can also change with location or industry. However, there are some general steps that can be taken to reduce carbon footprint on a larger scale.

In 2016, the EIA reported that in the US electricity is responsible for roughly 37% of Carbon Dioxide emissions, making it a potential target for reductions. Possibly the cheapest way to do this is through energy efficiency improvements. The ACEEE reported that energy efficiency has the potential to save the US over 800 billion kWh per year, based on 2015 data. Some potential options to increase energy efficiency include, but are not limited to:

  • Waste heat recovery systems
  • Insulation for large buildings and combustion chambers
  • Technology upgrades, ie different light sources, lower consumption machines

Carbon Footprints from energy consumption can be reduced through the development of alternative energy projects, such as solar and wind energy, which are renewable resources.

Reforestation, the restocking of existing forests or woodlands that have previously been depleted, is an example of Carbon Offsetting, the counteracting of carbon dioxide emissions with an equivalent reduction of carbon dioxide in the atmosphere. Carbon offsetting can reduce a companies overall carbon footprint by offering a carbon credit.

A life cycle or supply chain carbon footprint study can provide useful data which will help the business to identify specific and critical areas for improvement. By calculating or predicting a process’ carbon footprint high emissions areas can be identified and steps can be taken to reduce in those areas.

Schemes to reduce carbon emissions: Kyoto Protocol, carbon offsetting, and certificates

Carbon dioxide emissions into the atmosphere, and the emissions of other GHGs, are often associated with the burning of fossil fuels, like natural gas, crude oil and coal. While this is harmful to the environment, carbon offsets can be purchased in an attempt to make up for these harmful effects.

The Kyoto Protocol defines legally binding targets and timetables for cutting the GHG emissions of industrialized countries that ratified the Kyoto Protocol. Accordingly, from an economic or market perspective, one has to distinguish between a mandatory market and a voluntary market. Typical for both markets is the trade with emission certificates:

Mandatory market mechanisms

To reach the goals defined in the Kyoto Protocol, with the least economical costs, the following flexible mechanisms were introduced for the mandatory market:

The CDM and JI mechanisms requirements for projects which create a supply of emission reduction instruments, while Emissions Trading allows those instruments to be sold on international markets.

The CERs and ERUs can then be sold through Emissions Trading. The demand for the CERs and ERUs being traded is driven by:

  • Shortfalls in national emission reduction obligations under the Kyoto Protocol.
  • Shortfalls amongst entities obligated under local emissions reduction schemes.

Nations which have failed to deliver their Kyoto emissions reductions obligations can enter Emissions Trading to purchase CERs and ERUs to cover their treaty shortfalls. Nations and groups of nations can also create local emission reduction schemes which place mandatory carbon dioxide emission targets on entities within their national boundaries. If the rules of a scheme allow, the obligated entities may be able to cover all or some of any reduction shortfalls by purchasing CERs and ERUs through Emissions Trading. While local emissions reduction schemes have no status under the Kyoto Protocol itself, they play a prominent role in creating the demand for CERs and ERUs, stimulating Emissions Trading and setting a market price for emissions.

A well-known mandatory local emissions trading scheme is the EU Emissions Trading Scheme (EU ETS).

New changes are being made to the trading schemes. The EU Emissions Trading Scheme is set to make some new changes within the next year. The new changes will target the emissions produced by flight travel in and out of the European Union.

Other nations are scheduled to start participating in Emissions Trading Schemes within the next few years. These nations include China, India and the United States.

Voluntary market mechanisms

In contrast to the strict rules set out for the mandatory market, the voluntary market provides companies with different options to acquire emissions reductions. A solution, comparable with those developed for the mandatory market, has been developed for the voluntary market, the Verified Emission Reductions (VER). This measure has the great advantage that the projects/activities are managed according to the quality standards set out for CDM/JI projects but the certificates provided are not registered by the governments of the host countries or the Executive Board of the UNO. As such, high quality VERs can be acquired at lower costs for the same project quality. However, at present VERs can not be used in mandatory market.

The voluntary market in North America is divided between members of the Chicago Climate Exchange and the Over The Counter (OTC) market. The Chicago Climate Exchange is a voluntary yet legally binding cap-and-trade emission scheme whereby members commit to the capped emission reductions and must purchase allowances from other members or offset excess emissions. The OTC market does not involve a legally binding scheme and a wide array of buyers from the public and private spheres, as well as special events that want to go carbon neutral. Being carbon neutral refers to achieving net zero carbon emissions by balancing a measured amount of carbon released with an equivalent amount sequestered or offset, or buying enough carbon credits to make up the difference.

There are project developers, wholesalers, brokers, and retailers, as well as carbon funds, in the voluntary market. Some businesses and nonprofits in the voluntary market encompass more than just one of the activities listed above. A report by Ecosystem Marketplace shows that carbon offset prices increase as it moves along the supply chain—from project developer to retailer.

While some mandatory emission reduction schemes exclude forest projects, these projects flourish in the voluntary markets. A major criticism concerns the imprecise nature of GHG sequestration quantification methodologies for forestry projects. However, others note the community co-benefits that forestry projects foster. Project types in the voluntary market range from avoided deforestation, afforestation/reforestation, industrial gas sequestration, increased energy efficiency, fuel switching, methane capture from coal plants and livestock, and even renewable energy. Renewable Energy Certificates (RECs) sold on the voluntary market are quite controversial due to additionality concerns. Industrial Gas projects receive criticism because such projects only apply to large industrial plants that already have high fixed costs. Siphoning off industrial gas for sequestration is considered picking the low hanging fruit; which is why credits generated from industrial gas projects are the cheapest in the voluntary market.

The size and activity of the voluntary carbon market are difficult to measure. The most comprehensive report on the voluntary carbon markets to date was released by Ecosystem Marketplace and New Carbon Finance in July 2007.

ÆON of Japan is firstly approved by the Japanese authority to indicate a carbon footprint on three private brand goods in October 2009.

Average carbon footprint per person by country

CO₂ emissions per person by country, 2017 (Our World in Data).

According to The World Bank, the global average carbon footprint in 2014 was 4.97 metric tons CO2/cap. The EU average for 2007 was about 13.8 tons CO2e/cap, whereas for the U.S., Luxembourg and Australia it was over 25 tons CO2e/cap. In 2017, the average for the USA was about 20 metric tons CO2e.

Mobility (driving, flying & small amount from public transit), shelter (electricity, heating, construction) and food are the most important consumption categories determining the carbon footprint of a person. In the EU, the carbon footprint of mobility is evenly split between direct emissions (e.g. from driving private cars) and emissions embodied in purchased products related to mobility (air transport service, emissions occurring during the production of cars and during the extraction of fuel).

The carbon footprint of U.S. households is about 5 times greater than the global average. For most U.S. households the single most important action to reduce their carbon footprint is driving less or switching to a more efficient vehicle.

The carbon footprints of energy

Three studies concluded that hydroelectric, wind, and nuclear power produced the least CO2 per kilowatt-hour of any other electricity sources. These figures do not allow for emissions due to accidents or terrorism. Wind power and solar power, emit no carbon from the operation, but do leave a footprint during construction phase and maintenance during operation. Hydropower from reservoirs also has large footprints from initial removal of vegetation and ongoing methane (stream detritus decays anaerobically to methane in bottom of reservoir, rather than aerobically to CO2 if it had stayed in an unrestricted stream).

Electricity generated, which is about half the world's man-made CO2 output. The CO2 footprint for heat is equally significant and research shows that using waste heat from power generation in combined heat and power district heating, chp/dh has the lowest carbon footprint, much lower than micro-power or heat pumps.

Coal production has been refined to greatly reduce carbon emissions; since the 1980s, the amount of energy used to produce a ton of steel has decreased by 50%.

Passenger transport

This section gives representative figures for the carbon footprint of the fuel burned by different transport types (not including the carbon footprints of the vehicles or related infrastructure themselves). The precise figures vary according to a wide range of factors.

Flight

Some representative figures for CO2 emissions are provided by LIPASTO's survey of average direct emissions (not accounting for high-altitude radiative effects) of airliners expressed as CO2 and CO2 equivalent per passenger kilometre:

  • Domestic, short distance, less than 463 km (288 mi): 257 g/km CO2 or 259 g/km (14.7 oz/mile) CO2e
  • Long-distance flights: 113 g/km CO2 or 114 g/km (6.5 oz/mile) CO2e

However, emissions per unit distance travelled is not necessarily the best indicator for the carbon footprint of air travel, because the distances covered are commonly longer than by other modes of travel. It is the total emissions for a trip that matters for a carbon footprint, not merely the rate of emissions. For example, because air travel makes rapid long-distance travel feasible, a holiday destination may be chosen that is much more distant than if another mode of travel were used.

Road

CO2 emissions per passenger-kilometre (pkm) for all road travel for 2011 in Europe as provided by the European Environment Agency:

  • 109 g/km CO2 (Figure 2)

For vehicles, average figures for CO2 emissions per kilometer for road travel for 2013 in Europe, normalized to the NEDC test cycle, are provided by the International Council on Clean Transportation:

Average figures for the United States are provided by the US Environmental Protection Agency, based on the EPA Federal Test Procedure, for the following categories:

  • Passenger cars: 200 g CO2/km (322 g/mi)
  • Trucks: 280 g CO2/km (450 g/mi)
  • Combined: 229 g CO2/km (369 g/mi)

The carbon footprints of products

Several organizations offer footprint calculators for public and corporate use, and several organizations have calculated carbon footprints of products. The US Environmental Protection Agency has addressed paper, plastic (candy wrappers), glass, cans, computers, carpet and tires. Australia has addressed lumber and other building materials. Academics in Australia, Korea and the US have addressed paved roads. Companies, nonprofits and academics have addressed mailing letters and packages. Carnegie Mellon University has estimated the CO2 footprints of 46 large sectors of the economy in each of eight countries. Carnegie Mellon, Sweden and the Carbon Trust have addressed foods at home and in restaurants.

The Carbon Trust has worked with UK manufacturers on foods, shirts and detergents, introducing a CO2 label in March 2007. The label is intended to comply with a new British Publicly Available Specification (i.e. not a standard), PAS 2050, and is being actively piloted by The Carbon Trust and various industrial partners. As of August 2012 The Carbon Trust state they have measured 27,000 certifiable product carbon footprints.

Evaluating the package of some products is key to figuring out the carbon footprint. The key way to determine a carbon footprint is to look at the materials used to make the item. For example, a juice carton is made of an aseptic carton, a beer can is made of aluminum, and some water bottles either made of glass or plastic. The larger the size, the larger the footprint will be.

Food

In a 2014 study by Scarborough et al., the real-life diets of British people were surveyed and their dietary greenhouse gas footprints estimated. Average dietary greenhouse-gas emissions per day (in kilograms of carbon dioxide equivalent) were:

  • 7.19 for high meat-eaters
  • 5.63 for medium meat-eaters
  • 4.67 for low meat-eaters
  • 3.91 for fish-eaters
  • 3.81 for vegetarians
  • 2.89 for vegans

Textiles

The precise carbon footprint of different textiles varies considerably according to a wide range of factors. However, studies of textile production in Europe suggest the following carbon dioxide equivalent emissions footprints per kilo of textile at the point of purchase by a consumer:

  • Cotton: 8
  • Nylon: 5.43
  • PET (e.g. synthetic fleece): 5.55
  • Wool: 5.48

Accounting for durability and energy required to wash and dry textile products, synthetic fabrics generally have a substantially lower carbon footprint than natural ones.

Materials

The carbon footprint of materials (also known as embodied carbon) varies widely. The carbon footprint of many common materials can be found in the Inventory of Carbon & Energy database, the GREET databases and models, and LCA databases via openLCA Nexus. The carbon footprint of any manufactured product should be verified by a third-party.

Cement

Cement production gives a major contribution to CO2 emissions.

Causes

Power plant releasing smoke that contains greenhouse gas

Although some production of greenhouse gases is natural, human activity has increased the production substantially. Major industrial sources of greenhouse gasses are power plants, residential buildings, and road transportation, as well as energy industry processes and losses, iron and steel manufacturing, coal mining, and chemical and petrochemical industries. Changes in the environment also contribute the increase in greenhouse gas emission such as, deforestation, forest degradation and land use, livestock, agricultural soils and water, and wastewater. China is the largest contributor of greenhouse gas, causing up 30% of the total emissions. The United States contributes 15%, followed by the EU with 9%, then India with 7%, Russia with 5%, Japan with 4%, and other miscellaneous countries making up the remaining 30%.

Although carbon dioxide (CO2) is the most prevalent gas, it is not the most damaging. Carbon dioxide is essential to life because animals release it during cellular respiration when they breathe and plants use it for photosynthesis. Carbon dioxide is released naturally by decomposition, ocean release and respiration. Humans contribute an increase of carbon dioxide emissions by burning fossil fuels, deforestation, and cement production.

Methane (CH4) is largely released by coal, oil, and natural gas industries. Although methane is not mass-produced like carbon dioxide, it is still very prevalent. Methane is more harmful than carbon dioxide because it traps heat better than CO2. Methane is a main component in natural gas. Recently industries as well as consumers have been using natural gas because they believe that it is better for the environment since it contains less CO2. However, this is not the case because methane is actually more harmful to the environment.

Nitrous oxide (N2O) is released by fuel combustion, most of which comes from coal fired power plants, agricultural and industrial activities.

Fluorinated gases include hydroflucarbons (HFCs), perfluorocarbons (PFCs), sulfur hexafluoride (SF6), and nitrogen trifluoride (NF3). These gases have no natural source and are solely products of human activity. The biggest cause of these sources is the usage of ozone depleting substances; such as refrigerants, aerosol, propellants, foam blowing agents, solvents, and fire retardants.

The production of all of these gases contributes to one's GHG footprint. The more that these gases are produced, the higher the GHG footprint.

Rise in greenhouse gas over time

Global annual greenhouse gas emissions (CO2) from fossil energy sources, over time for the six top emitting countries and confederations

Since the Industrial Revolution, greenhouse gas emissions have increased immensely. As of 2017, the carbon dioxide (CO2) levels are 142%, of what they were pre-industrial revolution. Methane is up 253% and nitrous oxide is 121% of pre-industrial levels. The energy driven consumption of fossil fuels has made GHG emissions rapidly increase, causing the Earth's temperature to rise. In the past 250 years, human activity such as, burning fossil fuels and cutting down carbon-absorbing forests, have contributed greatly to this increase. In the last 25 years alone, emissions have increased by more than 33%, most of which comes from carbon dioxide, accounting for three-fourths of this increase.

Solutions

How to reduce GHGs

Reduction of carbon dioxide

In order to decrease CO2 emissions, the reliance of fossil fuels must be lowered. These fuels produce much CO2 across all forms of their usage. Alternatively, renewable sources are cleaner for the environment. Capturing CO2 from power plants will also reduce emissions.

Household energy conservation measures include increasing insulation in construction, using fuel-efficient vehicles and ENERGY STAR appliances, and unplugging electrical items when not in use.

Reduction of methane

Reducing methane gas emissions can be accomplished in several ways. Capturing CH4 emissions from coal mines and landfills, are two ways of reducing these emissions. Manure management and livestock operations is another possible solution. Motor vehicles use fossil fuels, which produces CO2, but fossil fuels also produce CH4 as a byproduct. Thus, better technology for these vehicles to avoid leakage would be very beneficial.

Reduction of nitrous oxide

Nitrous oxide (N2O) is often given off as a byproduct in various ways. Nylon production and fossil fuel usage are two ways that N2O is given off as a byproduct. Thus, improving technology for nylon production and the gathering of fossil fuels would greatly reduce nitrous oxide emissions. Also, many fertilizers have a nitrogenous base. A decrease in usage of these fertilizers, or changing their components, are more ways to reduce N2O emissions.

Reduction of fluorinated gases

Although fluorinated gases are not produced on a massive scale, they have the worst effect on the environment. A reduction of fluorinated gas emissions can be done in many ways. Many industries that emit these gases can capture or recycle them. These same industries can also invest in more advanced technology that will not produce these gases. A reduction of leakage within power grids and motor vehicles will also decrease the emissions of fluorinated gases. There are also many air conditioning systems that emit fluorinated gases, thus an update in technology would decrease these emissions.

Everyday life changes

There are many simple changes that can be made to the everyday lifestyle of a person that would reduce their GHG footprint. Reducing energy consumption within a household can include lowering one's dependence on air conditioning and heating, using CFL light bulbs, choosing ENERGY STAR appliances, recycling, using cold water to wash clothes, and avoiding a dryer. Another adjustment would be to use a motor vehicle that is fuel-efficient as well as reducing reliance on motor vehicles. Motor vehicles produce many GHGs, thus an adjustment to one's usage will greatly affect a GHG footprint.

Operator (computer programming)

From Wikipedia, the free encyclopedia https://en.wikipedia.org/wiki/Operator_(computer_programmin...