Search This Blog

Friday, October 12, 2018

Water quality

From Wikipedia, the free encyclopedia
A rosette sampler is used for collecting water samples in deep water, such as the Great Lakes or oceans, for water quality testing.

Water quality refers to the chemical, physical, biological, and radiological characteristics of water. It is a measure of the condition of water relative to the requirements of one or more biotic species and or to any human need or purpose. It is most frequently used by reference to a set of standards against which compliance, generally achieved through treatment of the water, can be assessed. The most common standards used to assess water quality relate to health of ecosystems, safety of human contact, and drinking water.

Standards

In the setting of standards, agencies make political and technical/scientific decisions about how the water will be used. In the case of natural water bodies, they also make some reasonable estimate of pristine conditions. Natural water bodies will vary in response to environmental conditions. Environmental scientists work to understand how these systems function, which in turn helps to identify the sources and fates of contaminants. Environmental lawyers and policymakers work to define legislation with the intention that water is maintained at an appropriate quality for its identified use.

The vast majority of surface water on the Earth is neither potable nor toxic. This remains true when seawater in the oceans (which is too salty to drink) is not counted. Another general perception of water quality is that of a simple property that tells whether water is polluted or not. In fact, water quality is a complex subject, in part because water is a complex medium intrinsically tied to the ecology of the Earth. Industrial and commercial activities (e.g. manufacturing, mining, construction, transport) are a major cause of water pollution as are runoff from agricultural areas, urban runoff and discharge of treated and untreated sewage.

Categories

The parameters for water quality are determined by the intended use. Work in the area of water quality tends to be focused on water that is treated for human consumption, industrial use, or in the environment.

Human consumption

Contaminants that may be in untreated water include microorganisms such as viruses, protozoa and bacteria; inorganic contaminants such as salts and metals; organic chemical contaminants from industrial processes and petroleum use; pesticides and herbicides; and radioactive contaminants. Water quality depends on the local geology and ecosystem, as well as human uses such as sewage dispersion, industrial pollution, use of water bodies as a heat sink, and overuse (which may lower the level of the water).

The United States Environmental Protection Agency (EPA) limits the amounts of certain contaminants in tap water provided by US public water systems. The Safe Drinking Water Act authorizes EPA to issue two types of standards:
  • primary standards regulate substances that potentially affect human health;
  • secondary standards prescribe aesthetic qualities, those that affect taste, odor, or appearance.
The U.S. Food and Drug Administration (FDA) regulations establish limits for contaminants in bottled water that must provide the same protection for public health. Drinking water, including bottled water, may reasonably be expected to contain at least small amounts of some contaminants. The presence of these contaminants does not necessarily indicate that the water poses a health risk.

In urbanized areas around the world, water purification technology is used in municipal water systems to remove contaminants from the source water (surface water or groundwater) before it is distributed to homes, businesses, schools and other recipients. Water drawn directly from a stream, lake, or aquifer and that has no treatment will be of uncertain quality.

Industrial and domestic use

Dissolved minerals may affect suitability of water for a range of industrial and domestic purposes. The most familiar of these is probably the presence of ions of calcium (Ca2+) and magnesium (Mg2+) which interfere with the cleaning action of soap, and can form hard sulfate and soft carbonate deposits in water heaters or boilers. Hard water may be softened to remove these ions. The softening process often substitutes sodium cations. Hard water may be preferable to soft water for human consumption, since health problems have been associated with excess sodium and with calcium and magnesium deficiencies. Softening decreases nutrition and may increase cleaning effectiveness. Various industries' wastes and effluents can also pollute the water quality in receiving bodies of water.

Environmental water quality

Urban runoff discharging to coastal waters

Environmental water quality, also called ambient water quality, relates to water bodies such as lakes, rivers, and oceans. Water quality standards for surface waters vary significantly due to different environmental conditions, ecosystems, and intended human uses. Toxic substances and high populations of certain microorganisms can present a health hazard for non-drinking purposes such as irrigation, swimming, fishing, rafting, boating, and industrial uses. These conditions may also affect wildlife, which use the water for drinking or as a habitat. Modern water quality laws generally specify protection of fisheries and recreational use and require, as a minimum, retention of current quality standards.

Satirical cartoon by William Heath, showing a woman observing monsters in a drop of London water (at the time of the Commission on the London Water Supply report, 1828)

There is some desire among the public to return water bodies to pristine, or pre-industrial conditions. Most current environmental laws focus on the designation of particular uses of a water body. In some countries these designations allow for some water contamination as long as the particular type of contamination is not harmful to the designated uses. Given the landscape changes (e.g., land development, urbanization, clearcutting in forested areas) in the watersheds of many freshwater bodies, returning to pristine conditions would be a significant challenge. In these cases, environmental scientists focus on achieving goals for maintaining healthy ecosystems and may concentrate on the protection of populations of endangered species and protecting human health.

Sampling and measurement

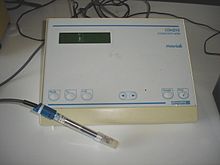
The complexity of water quality as a subject is reflected in the many types of measurements of water quality indicators. The most accurate measurements of water quality are made on-site, because water exists in equilibrium with its surroundings. Measurements commonly made on-site and in direct contact with the water source in question include temperature, pH, dissolved oxygen, conductivity, oxygen reduction potential (ORP), turbidity, and Secchi disk depth.

Sample collection

An automated sampling station installed along the East Branch Milwaukee River, New Fane, Wisconsin. The cover of the 24-bottle autosampler (center) is partially raised, showing the sample bottles inside. The autosampler was programmed to collect samples at time intervals, or proportionate to flow over a specified period. The data logger (white cabinet) recorded temperature, specific conductance, and dissolved oxygen levels.

More complex measurements are often made in a laboratory requiring a water sample to be collected, preserved, transported, and analyzed at another location. The process of water sampling introduces two significant problems:
  • The first problem is the extent to which the sample may be representative of the water source of interest. Many water sources vary with time and with location. The measurement of interest may vary seasonally or from day to night or in response to some activity of man or natural populations of aquatic plants and animals. The measurement of interest may vary with distances from the water boundary with overlying atmosphere and underlying or confining soil. The sampler must determine if a single time and location meets the needs of the investigation, or if the water use of interest can be satisfactorily assessed by averaged values with time and location, or if critical maxima and minima require individual measurements over a range of times, locations or events. The sample collection procedure must assure correct weighting of individual sampling times and locations where averaging is appropriate. Where critical maximum or minimum values exist, statistical methods must be applied to observed variation to determine an adequate number of samples to assess probability of exceeding those critical values.
  • The second problem occurs as the sample is removed from the water source and begins to establish chemical equilibrium with its new surroundings – the sample container. Sample containers must be made of materials with minimal reactivity with substances to be measured; and pre-cleaning of sample containers is important. The water sample may dissolve part of the sample container and any residue on that container, or chemicals dissolved in the water sample may sorb onto the sample container and remain there when the water is poured out for analysis. Similar physical and chemical interactions may take place with any pumps, piping, or intermediate devices used to transfer the water sample into the sample container. Water collected from depths below the surface will normally be held at the reduced pressure of the atmosphere; so gas dissolved in the water may escape into unfilled space at the top of the container. Atmospheric gas present in that air space may also dissolve into the water sample. Other chemical reaction equilibria may change if the water sample changes temperature. Finely divided solid particles formerly suspended by water turbulence may settle to the bottom of the sample container, or a solid phase may form from biological growth or chemical precipitation. Microorganisms within the water sample may biochemically alter concentrations of oxygen, carbon dioxide, and organic compounds. Changing carbon dioxide concentrations may alter pH and change solubility of chemicals of interest. These problems are of special concern during measurement of chemicals assumed to be significant at very low concentrations.
Filtering a manually collected water sample (grab sample) for analysis

Sample preservation may partially resolve the second problem. A common procedure is keeping samples cold to slow the rate of chemical reactions and phase change, and analyzing the sample as soon as possible; but this merely minimizes the changes rather than preventing them. A useful procedure for determining influence of sample containers during delay between sample collection and analysis involves preparation for two artificial samples in advance of the sampling event. One sample container is filled with water known from previous analysis to contain no detectable amount of the chemical of interest. This sample, called a "blank", is opened for exposure to the atmosphere when the sample of interest is collected, then resealed and transported to the laboratory with the sample for analysis to determine if sample holding procedures introduced any measurable amount of the chemical of interest. The second artificial sample is collected with the sample of interest, but then "spiked" with a measured additional amount of the chemical of interest at the time of collection. The blank and spiked samples are carried with the sample of interest and analyzed by the same methods at the same times to determine any changes indicating gains or losses during the elapsed time between collection and analysis.

Testing in response to natural disasters and other emergencies

Inevitably after events such as earthquakes and tsunamis, there is an immediate response by the aid agencies as relief operations get underway to try and restore basic infrastructure and provide the basic fundamental items that are necessary for survival and subsequent recovery. Access to clean drinking water and adequate sanitation is a priority at times like this. The threat of disease increases hugely due to the large numbers of people living close together, often in squalid conditions, and without proper sanitation.

After a natural disaster, as far as water quality testing is concerned there are widespread views on the best course of action to take and a variety of methods can be employed. The key basic water quality parameters that need to be addressed in an emergency are bacteriological indicators of fecal contamination, free chlorine residual, pH, turbidity and possibly conductivity/total dissolved solids. There are a number of portable water test kits on the market widely used by aid and relief agencies for carrying out such testing.

After major natural disasters, a considerable length of time might pass before water quality returns to pre-disaster levels. For example, following the 2004 Indian Ocean tsunami the Colombo-based International Water Management Institute (IWMI) monitored the effects of saltwater and concluded that the wells recovered to pre-tsunami drinking water quality one and a half years after the event. IWMI developed protocols for cleaning wells contaminated by saltwater; these were subsequently officially endorsed by the World Health Organization as part of its series of Emergency Guidelines.

Chemical analysis

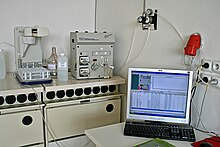
A gas chromatograph-
mass spectrometer
measures pesticides and other organic pollutants

The simplest methods of chemical analysis are those measuring chemical elements without respect to their form. Elemental analysis for oxygen, as an example, would indicate a concentration of 890 g/L (grams per litre) of water sample because oxygen (O) has 89% mass of the water molecule (H2O). The method selected to measure dissolved oxygen should differentiate between diatomic oxygen and oxygen combined with other elements. The comparative simplicity of elemental analysis has produced a large amount of sample data and water quality criteria for elements sometimes identified as heavy metals. Water analysis for heavy metals must consider soil particles suspended in the water sample. These suspended soil particles may contain measurable amounts of metal. Although the particles are not dissolved in the water, they may be consumed by people drinking the water. Adding acid to a water sample to prevent loss of dissolved metals onto the sample container may dissolve more metals from suspended soil particles. Filtration of soil particles from the water sample before acid addition, however, may cause loss of dissolved metals onto the filter. The complexities of differentiating similar organic molecules are even more challenging.

Atomic fluorescence spectroscopy is used to measure mercury and other heavy metals

Making these complex measurements can be expensive. Because direct measurements of water quality can be expensive, ongoing monitoring programs are typically conducted by government agencies. However, there are local volunteer programs and resources available for some general assessment. Tools available to the general public include on-site test kits, commonly used for home fish tanks, and biological assessment procedures.

Real-time monitoring

Although water quality is usually sampled and analyzed at laboratories, nowadays, citizens demand real-time information about the water they are drinking. During the last years, several companies are deploying worldwide real-time remote monitoring systems for measuring water pH, turbidity or dissolved oxygen levels.

Drinking water indicators


The following is a list of indicators often measured by situational category:

Environmental indicators

Physical indicators

Chemical indicators

Biological indicators

Biological monitoring metrics have been developed in many places, and one widely used measure is the presence and abundance of members of the insect orders Ephemeroptera, Plecoptera and Trichoptera (common names are, respectively, mayfly, stonefly and caddisfly). EPT indexes will naturally vary from region to region, but generally, within a region, the greater the number of taxa from these orders, the better the water quality. Organisations in the United States, such as EPA. offer guidance on developing a monitoring program and identifying members of these and other aquatic insect orders. Many US wastewater dischargers (e.g., factories, power plants, refineries, mines, municipal sewage treatment plants) are required to conduct periodic whole effluent toxicity (WET) tests.

Individuals interested in monitoring water quality who cannot afford or manage lab scale analysis can also use biological indicators to get a general reading of water quality. One example is the IOWATER volunteer water monitoring program of Iowa, which includes a benthic macroinvertebrate indicator key.

Bivalve molluscs are largely used as bioindicators to monitor the health of aquatic environments in both fresh water and the marine environments. Their population status or structure, physiology, behaviour or the level of contamination with elements or compounds can indicate the state of contamination status of the ecosystem. They are particularly useful since they are sessile so that they are representative of the environment where they are sampled or placed. A typical project is the U.S. Mussel Watch Programme, but today they are used worldwide.

The Southern African Scoring System (SASS) method is a biological water quality monitoring system based on the presence of benthic macroinvertebrates. The SASS aquatic biomonitoring tool has been refined over the past 30 years and is now on the fifth version (SASS5) which has been specifically modified in accordance with international standards, namely the ISO/IEC 17025 protocol. The SASS5 method is used by the South African Department of Water Affairs as a standard method for River Health Assessment, which feeds the national River Health Programme and the national Rivers Database.

Standards and reports

International

  • The World Health Organisation (WHO) has published guidelines for drinking-water quality (GDWQ) in 2011.
  • The International Organization for Standardization (ISO) published regulation of water quality in the section of ICS 13.060, ranging from water sampling, drinking water, industrial class water, sewage, and examination of water for chemical, physical or biological properties. ICS 91.140.60 covers the standards of water supply systems.

National specifications for ambient water and drinking water

European Union

The water policy of the European Union is primarily codified in three directives:

India

South Africa

Water quality guidelines for South Africa are grouped according to potential user types (e.g. domestic, industrial) in the 1996 Water Quality Guidelines. Drinking water quality is subject to the South African National Standard (SANS) 241 Drinking Water Specification.

United Kingdom

In England and Wales acceptable levels for drinking water supply are listed in the "Water Supply (Water Quality) Regulations 2000."

United States

In the United States, Water Quality Standards are defined by state agencies for various water bodies, guided by the desired uses for the water body (e.g., fish habitat, drinking water supply, recreational use). The Clean Water Act (CWA) requires each governing jurisdiction (states, territories, and covered tribal entities) to submit a set of biennial reports on the quality of water in their area. These reports are known as the 303(d) and 305(b) reports, named for their respective CWA provisions, and are submitted to, and approved by, EPA. These reports are completed by the governing jurisdiction, typically a state environmental agency. EPA recommends that each state submit a single "Integrated Report" comprising its list of impaired waters and the status of all water bodies in the state. The National Water Quality Inventory Report to Congress is a general report on water quality, providing overall information about the number of miles of streams and rivers and their aggregate condition. The CWA requires states to adopt standards for each of the possible designated uses that they assign to their waters. Should evidence suggest or document that a stream, river or lake has failed to meet the water quality criteria for one or more of its designated uses, it is placed on a list of impaired waters. Once a state has placed a water body on this list, it must develop a management plan establishing Total Maximum Daily Loads (TMDLs) for the pollutant(s) impairing the use of the water. These TMDLs establish the reductions needed to fully support the designated uses.

Drinking water standards, which are applicable to public water systems, are issued by EPA under the Safe Drinking Water Act.

Nutrient pollution

From Wikipedia, the free encyclopedia
 
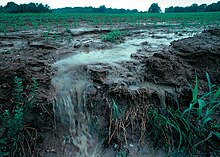
Nutrient pollution caused by Surface runoff of soil and fertilizer during a rain storm

Nutrient pollution, a form of water pollution, refers to contamination by excessive inputs of nutrients. It is a primary cause of eutrophication of surface waters, in which excess nutrients, usually nitrogen or phosphorus, stimulate algal growth. Sources of nutrient pollution include surface runoff from farm fields and pastures, discharges from septic tanks and feedlots, and emissions from combustion. Excess nutrients have been summarized as potentially leading to:
  • Population effects: excess growth of algae (blooms);
  • Community effects: species composition shifts (dominant taxa);
  • Ecological effects: food web changes, light limitation;
  • Biogeochemical effects: excess organic carbon (eutrophication); dissolved oxygen deficits (environmental hypoxia); toxin production;
  • Human health effects: excess nitrate in drinking water (blue baby syndrome); disinfection by-products in drinking water;
  • Biodiversity effects: excessive algae blooms (biodiversity loss).
In a 2011 United States Environmental Protection Agency (EPA) report, the agency's Science Advisory Board succinctly stated: “Excess reactive nitrogen compounds in the environment are associated with many large-scale environmental concerns, including eutrophication of surface waters, toxic algae blooms, hypoxia, acid rain, nitrogen saturation in forests, and global warming.”

Sources

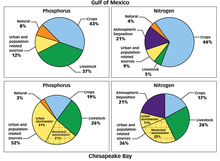
Agriculture is the major source of nutrient pollution in the Gulf of Mexico. In the Chesapeake Bay, agriculture is a major source, along with urban areas and atmospheric deposition.

Nitrogen

Use of synthetic fertilizers, burning of fossil fuels, and agricultural animal production, especially concentrated animal feeding operations (CAFO), have added large quantities of reactive nitrogen to the biosphere.

Phosphorus

Phosphorus polllution is caused by excessive use of fertilizers and manure, particularly when compounded by soil erosion. Phosphorus is also discharged by municipal sewage treatment plants and some industries.

Land uses

The principal source(s) of nutrient pollution in an individual watershed depend on the prevailing land uses. The sources may be point sources, nonpoint sources, or both:
  • Agriculture: animal production or crops
  • Urban/suburban: stormwater runoff from roads and parking lots; excessive fertilzer use on lawns; municipal sewage treatment plants; motor vehicle emissions
  • Industrial: air pollution emissions (e.g. electric power plants), wastewater discharges from various industries.
Nutrient pollution from some air pollution sources may occur independently of the local land uses, due to long-range transport of air pollutants from distant sources.

Mitigation of nutrient pollutant discharges

United States

Agricultural nonpoint source (NPS) pollution is the largest source of water quality impairments throughout the U.S., based on surveys by state environmental agencies. NPS pollution is not subject to discharge permits under the federal Clean Water Act (CWA). EPA and states have used grants, partnerships and demonstration projects to create incentives for farmers to adjust their practices and reduce surface runoff.

Discharge permits

Many point source dischargers in the U.S., while not necessarily the largest sources of nutrients in their respective watersheds, are required to comply with nutrient effluent limitations in their permits, which are issued through the National Pollutant Discharge Elimination System (NPDES), pursuant to the CWA. Some large municipal sewage treatment plants, such as the Blue Plains Advanced Wastewater Treatment Plant in Washington, D.C. have installed biological nutrient removal (BNR) systems to comply with regulatory requirements. Other municipalities have made adjustments to the operational practices of their existing secondary treatment systems to control nutrients.

Discharges from large livestock facilities (CAFO) are also regulated by NPDES permits. Surface runoff from farm fields, the principal source of nutrients in many watersheds, is classified as NPS pollution and is not regulated by NPDES permits.

TMDL program

A Total Maximum Daily Load (TMDL) is a regulatory plan that prescribes the maximum amount of a pollutant (including nutrients) that a body of water can receive while still meeting CWA water quality standards. Specifically, Section 303 of the Act requires each state to generate a TMDL report for each body of water impaired by pollutants. TMDL reports identify pollutant levels and strategies to accomplish pollutant reduction goals. EPA has described TMDLs as establishing a "pollutant budget" with allocations to each of the pollutant's sources. For many coastal water bodies, the main pollutant issue is excess nutrients, also termed nutrient over-enrichment.

A TMDL can prescribe the minimum level of dissolved oxygen (DO) available in a body of water, which is directly related to nutrient levels. In 2010, 18 percent of TMDLs nationwide were related to nutrient levels including organic enrichment/oxygen depletion, noxious plants, algal growth, and ammonia.

TMDLs identify all point source and nonpoint source pollutants within a watershed. To implement TMDLs with point sources, wasteload allocations are incorporated into their NPDES permits. NPS discharges are generally in a voluntary compliance scenario.

In Long Island Sound, the TMDL development process enabled the Connecticut Department of Energy and Environmental Protection and the New York State Department of Environmental Conservation to incorporate a 58.5 percent nitrogen reduction target into a regulatory and legal framework.

Nutrient remediation

Mussels are examples of organisms that act as nutrient bioextractors

Innovative solutions have been conceived to deal with nutrient pollution in aquatic systems by altering or enhancing natural processes to shift nutrient effects away from detrimental ecological impacts. Nutrient remediation is a form of environmental remediation, but concerns only biologically active nutrients such as nitrogen and phosphorus. “Remediation” refers to the removal of pollution or contaminants, generally for the protection of human health. In environmental remediation nutrient removal technologies include biofiltration, which uses living material to capture and biologically degrade pollutants. Examples include green belts, riparian areas, natural and constructed wetlands, and treatment ponds. These areas most commonly capture anthropogenic discharges such as wastewater, stormwater runoff, or sewage treatment, for land reclamation after mining, refinery activity, or land development. Biofiltration utilizes biological assimilation to capture, absorb, and eventually incorporate the pollutants (including nutrients) into living tissue. Another form of nutrient removal is bioremediation, which uses microorganisms to remove pollutants. Bioremediation can occur on its own as natural attenuation or intrinsic bioremediation or can be encouraged by the addition of fertilizers, a strategy called biostimulation.

Nutrient bioextraction is bioremediation involving cultured plants and animals. Nutrient bioextraction or bioharvesting is the practice of farming and harvesting shellfish and seaweed for the purpose of removing nitrogen and other nutrients from natural water bodies. It has been suggested that nitrogen removal by oyster reefs could generate net benefits for sources facing nitrogen emission restrictions, similar to other nutrient trading scenarios. Specifically, if oysters maintain nitrogen levels in estuaries below thresholds that would lead to the imposition of emission limits, oysters effectively save the sources the compliance costs they otherwise would incur. Several studies have shown that oysters and mussels have the capacity to dramatically impact nitrogen levels in estuaries. Additionally, studies have demonstrated seaweed's potential to improve nitrogen levels.

History of nutrient policy in the United States

The basic requirements for states to develop nutrient criteria and standards were mandated in the 1972 Clean Water Act. Implementing this water quality program has been a major scientific, technical and resource-intensive challenge for both EPA and the states, and development is continuing well into the 21st century.

EPA published a wastewater management regulation in 1978 to begin to address the national nitrogen pollution problem, which had been increasing for decades. In 1998, the agency published a National Nutrient Strategy with a focus on developing nutrient criteria.

Between 2000 and 2010 EPA published federal-level nutrient criteria for rivers/streams, lakes/reservoirs, estuaries and wetlands; and related guidance. "Ecoregional" nutrient criteria for 14 ecoregions across the U.S. were included in these publications. While states may directly adopt the EPA-published criteria, in many cases the states need to modfiy the criteria to reflect site-specific conditions. In 2004, EPA stated its expectations for numeric criteria (as opposed to less-specific narrative criteria) for total nitrogen (TN), total phosphorus (TP), chlorophyll a(chl-a), and clarity, and established "mutually-agreed upon plans" for state criteria development. In 2007, the agency stated that progress among the states on developing nutrient criteria had been uneven. EPA reiterated its expectations for numeric criteria and promised its support for state efforts to develop their own criteria.

In 2008 EPA published a progress report on state efforts to develop nutrient standards. A majority of states had not developed numeric nutrient criteria for rivers and streams; lakes and reservoirs; wetlands and estuaries (for those states that have estuaries). In the same year, EPA also established a Nutrient Innovations Task Group (NITG), composed of state and EPA experts, to monitor and evaluate the progress of reducing nutrient pollution. In 2009 the NTIG issued a report, "An Urgent Call to Action," expesssing concern that water quality continued to deteriorate nationwide due to increasing nutrient pollution, and recommending more vigorous development of nutrient standards by the states.

In 2011 EPA reiterated the need for states to fully develop their nutrient standards, noting that drinking water violations for nitrates had doubled in eight years, that half of all streams nationwide had medium to high levels of nitrogen and phosphorus, and harmful algal blooms were increasing. The agency set out a framework for states to develop priorities and watershed-level goals for reductions of nutrients.

Nutrient trading

After the EPA had introduced watershed-based NPDES permitting in 2007, interest in nutrient removal and achieving regional TMDLs led to the development of nutrient trading schemes. Nutrient trading is a type of water quality trading, a market-based policy instrument used to improve or maintain water quality. Water quality trading arose around 2005 and is based on the fact that different pollution sources in a watershed can face very different costs to control the same pollutant. Water quality trading involves the voluntary exchange of pollution reduction credits from sources with low costs of pollution control to those with high costs of pollution control, and the same principles apply to nutrient water quality trading. The underlying principle is “polluter pays”, usually linked with a regulatory driver for participating is the trading program.

A 2013 Forest Trends report summarized water quality trading programs and found three main types of funders: beneficiaries of watershed protection, polluters compensating for their impacts and ‘public good payers’ that may not directly benefit, but fund the pollution reduction credits on behalf of a government or NGO. As of 2013, payments were overwhelmingly initiated by public good payers like governments and NGOs.

Nutrient source apportionment

Nutrient source apportionment is used to estimate the nutrient load from various sectors entering water bodies, following attenuation or treatment. Agriculture is typically the principal source of nitrogen in water bodies in Europe, whereas in many countries households and industries tend to be the dominant contributors of phosphorus. Where water quality is impacted by excess nutrients, load source apportionment models can support the proportional and pragmatic management of water resources by identifying the pollution sources. There are two broad approaches to load apportionment modelling, (i) load-orientated approaches which apportion origin based on in-stream monitoring data and (ii) source-orientated approaches where amounts of diffuse, or nonpoint source pollution, emissions are calculated using models typically based on export coefficients from catchments with similar characteristics. For example, the Source Load Apportionment Model (SLAM) takes the latter approach, estimating the relative contribution of sources of nitrogen and phosphorus to surface waters in Irish catchments without in-stream monitoring data by integrating information on point discharges (urban wastewater, industry and septic tank systems), diffuse sources (pasture, arable, forestry, etc.), and catchment data, including hydrogeological characteristics.

Eutrophication

From Wikipedia, the free encyclopedia
The eutrophication of the Potomac River is evident from the bright green water, caused by a dense bloom of cyanobacteria.

Eutrophication (from Greek eutrophos, "well-nourished"), or hypertrophication, is when a body of water becomes overly enriched with minerals and nutrients that induce excessive growth of plants and algae. This process may result in oxygen depletion of the water body. One example is the "bloom" or great increase of phytoplankton in a water body as a response to increased levels of nutrients. Eutrophication is almost always induced by the discharge of nitrate or phosphate-containing detergents, fertilizers, or sewage into an aquatic system.

Mechanism of eutrophication

Eutrophication arises from the oversupply of nutrients, which leads to overgrowth of plants and algae. After such organisms die, the bacterial degradation of their biomass consumes the oxygen in the water, thereby creating the state of hypoxia.

According to Ullmann's Encyclopedia, "the primary limiting factor for eutrophication is phosphate." The availability of phosphorus generally promotes excessive plant growth and decay, favouring simple algae and plankton over other more complicated plants, and causes a severe reduction in water quality. Phosphorus is a necessary nutrient for plants to live, and is the limiting factor for plant growth in many freshwater ecosystems. Phosphate adheres tightly to soil, so it is mainly transported by erosion. Once translocated to lakes, the extraction of phosphate into water is slow, hence the difficulty of reversing the effects of eutrophication. However, numerous literature report that nitrogen is the primary limiting nutrient for the accumulation of algal biomass.

The sources of these excess phosphates are phosphates in detergent, industrial/domestic run-offs, and fertilizers. With the phasing out of phosphate-containing detergents in the 1970s, industrial/domestic run-off and agriculture have emerged as the dominant contributors to eutrophication.

Sodium triphosphate, once a component of many detergents, was a major contributor to eutrophication.
1. Excess nutrients are applied to the soil. 2. Some nutrients leach into the soil where they can remain for years. Eventually, they get drained into the water body. 3. Some nutrients run off over the ground into the body of water. 4. The excess nutrients cause an algal bloom. 5. The algal bloom blocks the light of the sun from reaching the bottom of the water body. 6. The plants beneath the algal bloom die because they cannot get sunlight to photosynthesize. 7. Eventually, the algal bloom dies and sinks to the bottom of the lake. Bacteria begins to decompose the remains, using up oxygen for respiration. 8. The decomposition causes the water to become depleted of oxygen. Larger life forms, such as fish, suffocate to death. This body of water can no longer support life.

Cultural eutrophication

Cultural eutrophication is the process that speeds up natural eutrophication because of human activity. Due to clearing of land and building of towns and cities, land runoff is accelerated and more nutrients such as phosphates and nitrate are supplied to lakes and rivers, and then to coastal estuaries and bays. Extra nutrients are also supplied by treatment plants, golf courses, fertilizers, farms (including fish farms), as well as untreated sewage in many countries.

Lakes and rivers

Eutrophication in a canal

When algae die, they decompose and the nutrients contained in that organic matter are converted into inorganic form by microorganisms. This decomposition process consumes oxygen, which reduces the concentration of dissolved oxygen. The depleted oxygen levels in turn may lead to fish kills and a range of other effects reducing biodiversity. Nutrients may become concentrated in an anoxic zone and may only be made available again during autumn turn-over or in conditions of turbulent flow.

Enhanced growth of aquatic vegetation or phytoplankton and algal blooms disrupts normal functioning of the ecosystem, causing a variety of problems such as a lack of oxygen needed for fish and shellfish to survive. The water becomes cloudy, typically coloured a shade of green, yellow, brown, or red. Eutrophication also decreases the value of rivers, lakes and aesthetic enjoyment. Health problems can occur where eutrophic conditions interfere with drinking water treatment.

Human activities can accelerate the rate at which nutrients enter ecosystems. Runoff from agriculture and development, pollution from septic systems and sewers, sewage sludge spreading, and other human-related activities increase the flow of both inorganic nutrients and organic substances into ecosystems. Elevated levels of atmospheric compounds of nitrogen can increase nitrogen availability. Phosphorus is often regarded as the main culprit in cases of eutrophication in lakes subjected to "point source" pollution from sewage pipes. The concentration of algae and the trophic state of lakes correspond well to phosphorus levels in water. Studies conducted in the Experimental Lakes Area in Ontario have shown a relationship between the addition of phosphorus and the rate of eutrophication. Humankind has increased the rate of phosphorus cycling on Earth by four times, mainly due to agricultural fertilizer production and application. Between 1950 and 1995, an estimated 600,000,000 tonnes of phosphorus was applied to Earth's surface, primarily on croplands. Policy changes to control point sources of phosphorus have resulted in rapid control of eutrophication.

Natural eutrophication

Although eutrophication is commonly caused by human activities, it can also be a natural process, particularly in lakes. Eutrophy occurs in many lakes in temperate grasslands, for instance. Paleolimnologists now recognise that climate change, geology, and other external influences are critical in regulating the natural productivity of lakes. Some lakes also demonstrate the reverse process (meiotrophication), becoming less nutrient rich with time. The main difference between natural and anthropogenic eutrophication is that the natural process is very slow, occurring on geological time scales.

Ocean waters

Eutrophication is a common phenomenon in coastal waters. In contrast to freshwater systems, nitrogen is more commonly the key limiting nutrient of marine waters; thus, nitrogen levels have greater importance to understanding eutrophication problems in salt water. Estuaries tend to be naturally eutrophic because land-derived nutrients are concentrated where run-off enters a confined channel. Upwelling in coastal systems also promotes increased productivity by conveying deep, nutrient-rich waters to the surface, where the nutrients can be assimilated by algae. Examples of anthropogenic sources of nitrogen-rich pollution include seacage fish farming and discharges of ammonia from the production of coke from coal.

The World Resources Institute has identified 375 hypoxic coastal zones in the world, concentrated in coastal areas in Western Europe, the Eastern and Southern coasts of the US, and East Asia, particularly Japan.

In addition to runoff from land, fish farming wastes and industrial ammonia discharges, atmospheric fixed nitrogen can enter the open ocean. A study in 2008 found that this could account for around one third of the ocean's external (non-recycled) nitrogen supply, and up to 3% of the annual new marine biological production. It has been suggested that accumulating reactive nitrogen in the environment may prove as serious as putting carbon dioxide in the atmosphere.

Terrestrial ecosystems

Terrestrial ecosystems are subject to similarly adverse impacts from eutrophication. Increased nitrates in soil are frequently undesirable for plants. Many terrestrial plant species are endangered as a result of soil eutrophication, such as the majority of orchid species in Europe. Meadows, forests, and bogs are characterized by low nutrient content and slowly growing species adapted to those levels, so they can be overgrown by faster growing and more competitive species. In meadows, tall grasses that can take advantage of higher nitrogen levels may change the area so that natural species may be lost. Species-rich fens can be overtaken by reed or reedgrass species. Forest undergrowth affected by run-off from a nearby fertilized field can be turned into a nettle and bramble thicket.

Chemical forms of nitrogen are most often of concern with regard to eutrophication, because plants have high nitrogen requirements so that additions of nitrogen compounds will stimulate plant growth. Nitrogen is not readily available in soil because N2, a gaseous form of nitrogen, is very stable and unavailable directly to higher plants. Terrestrial ecosystems rely on microbial nitrogen fixation to convert N2 into other forms such as nitrates. However, there is a limit to how much nitrogen can be utilized. Ecosystems receiving more nitrogen than the plants require are called nitrogen-saturated. Saturated terrestrial ecosystems then can contribute both inorganic and organic nitrogen to freshwater, coastal, and marine eutrophication, where nitrogen is also typically a limiting nutrient. This is also the case with increased levels of phosphorus. However, because phosphorus is generally much less soluble than nitrogen, it is leached from the soil at a much slower rate than nitrogen. Consequently, phosphorus is much more important as a limiting nutrient in aquatic systems.

Ecological effects

Eutrophication is apparent as increased turbidity in the northern part of the Caspian Sea, imaged from orbit.

Eutrophication was recognized as a water pollution problem in European and North American lakes and reservoirs in the mid-20th century. Since then, it has become more widespread. Surveys showed that 54% of lakes in Asia are eutrophic; in Europe, 53%; in North America, 48%; in South America, 41%; and in Africa, 28%. In South Africa, a study by the CSIR using remote sensing has shown more than 60% of the dams surveyed were eutrophic. Some South African scientists believe that this figure might be higher with the main source being dysfunctional sewage works that produce more than 4 billion liters a day of untreated, or at best partially treated, sewage effluent that discharges into rivers and dams.

Many ecological effects can arise from stimulating primary production, but there are three particularly troubling ecological impacts: decreased biodiversity, changes in species composition and dominance, and toxicity effects.

Decreased biodiversity

When an ecosystem experiences an increase in nutrients, primary producers reap the benefits first. In aquatic ecosystems, species such as algae experience a population increase (called an algal bloom). Algal blooms limit the sunlight available to bottom-dwelling organisms and cause wide swings in the amount of dissolved oxygen in the water. Oxygen is required by all aerobically respiring plants and animals and it is replenished in daylight by photosynthesizing plants and algae. Under eutrophic conditions, dissolved oxygen greatly increases during the day, but is greatly reduced after dark by the respiring algae and by microorganisms that feed on the increasing mass of dead algae. When dissolved oxygen levels decline to hypoxic levels, fish and other marine animals suffocate. As a result, creatures such as fish, shrimp, and especially immobile bottom dwellers die off. In extreme cases, anaerobic conditions ensue, promoting growth of bacteria such as Clostridium botulinum that produces toxins deadly to birds and mammals. Zones where this occurs are known as dead zones.

New species invasion

Eutrophication may cause competitive release by making abundant a normally limiting nutrient. This process causes shifts in the species composition of ecosystems. For instance, an increase in nitrogen might allow new, competitive species to invade and out-compete original inhabitant species. This has been shown to occur in New England salt marshes. In Europe and Asia, the common carp frequently lives in naturally Eutrophic or Hypereutrophic areas, and is adapted to living in such conditions. The eutrophication of areas outside its natural range partially explain the fish's success in colonising these areas after being introduced.

Toxicity

Some algal blooms, otherwise called "nuisance algae" or "harmful algal blooms", are toxic to plants and animals. Toxic compounds they produce can make their way up the food chain, resulting in animal mortality. Freshwater algal blooms can pose a threat to livestock. When the algae die or are eaten, neuro- and hepatotoxins are released which can kill animals and may pose a threat to humans. An example of algal toxins working their way into humans is the case of shellfish poisoning. Biotoxins created during algal blooms are taken up by shellfish (mussels, oysters), leading to these human foods acquiring the toxicity and poisoning humans. Examples include paralytic, neurotoxic, and diarrhoetic shellfish poisoning. Other marine animals can be vectors for such toxins, as in the case of ciguatera, where it is typically a predator fish that accumulates the toxin and then poisons humans.

Sources of high nutrient runoff

Characteristics of point and nonpoint sources of chemical inputs ( modified from Novonty and Olem 1994)
Point sources
  • Wastewater effluent (municipal and industrial)
  • Runoff and leachate from waste disposal systems
  • Runoff and infiltration from animal feedlots
  • Runoff from mines, oil fields, unsewered industrial sites
  • Overflows of combined storm and sanitary sewers
  • Runoff from construction sites less than 20,000 m² (220,000 ft²)
  • Untreated sewage

Nonpoint sources

  • Runoff from agriculture due to fertilizers and pesticides /irrigation
  • Runoff from pasture and range
  • Urban runoff from unsewered areas
  • Septic tank leachate
  • Runoff from construction sites >20,000 m²
  • Runoff from abandoned mines
  • Atmospheric deposition over a water surface
  • Other land activities generating contaminants
In order to gauge how to best prevent eutrophication from occurring, specific sources that contribute to nutrient loading must be identified. There are two common sources of nutrients and organic matter: point and nonpoint sources.

Point sources

Point sources are directly attributable to one influence. In point sources the nutrient waste travels directly from source to water. Point sources are relatively easy to regulate.

Nonpoint sources

Nonpoint source pollution (also known as 'diffuse' or 'runoff' pollution) is that which comes from ill-defined and diffuse sources. Nonpoint sources are difficult to regulate and usually vary spatially and temporally (with season, precipitation, and other irregular events).

It has been shown that nitrogen transport is correlated with various indices of human activity in watersheds, including the amount of development. Ploughing in agriculture and development are activities that contribute most to nutrient loading. There are three reasons that nonpoint sources are especially troublesome:

Soil retention

Nutrients from human activities tend to accumulate in soils and remain there for years. It has been shown that the amount of phosphorus lost to surface waters increases linearly with the amount of phosphorus in the soil. Thus much of the nutrient loading in soil eventually makes its way to water. Nitrogen, similarly, has a turnover time of decades.

Runoff to surface water

Nutrients from human activities tend to travel from land to either surface or ground water. Nitrogen in particular is removed through storm drains, sewage pipes, and other forms of surface runoff. Nutrient losses in runoff and leachate are often associated with agriculture. Modern agriculture often involves the application of nutrients onto fields in order to maximise production. However, farmers frequently apply more nutrients than are taken up by crops or pastures. Regulations aimed at minimising nutrient exports from agriculture are typically far less stringent than those placed on sewage treatment plants and other point source polluters. It should be also noted that lakes within forested land are also under surface runoff influences. Runoff can wash out the mineral nitrogen and phosphorus from detritus and in consequence supply the water bodies leading to slow, natural eutrophication.

Atmospheric deposition

Nitrogen is released into the air because of ammonia volatilization and nitrous oxide production. The combustion of fossil fuels is a large human-initiated contributor to atmospheric nitrogen pollution. Atmospheric nitrogen reaches the ground by two different processes, the first being wet deposition such as rain or snow, and the second being dry deposition which is particles and gases found in the air. Atmospheric deposition (e.g., in the form of acid rain) can also affect nutrient concentration in water, especially in highly industrialized regions.

Other causes

Any factor that causes increased nutrient concentrations can potentially lead to eutrophication. In modeling eutrophication, the rate of water renewal plays a critical role; stagnant water is allowed to collect more nutrients than bodies with replenished water supplies. It has also been shown that the drying of wetlands causes an increase in nutrient concentration and subsequent eutrophication blooms.

Prevention and reversal

Eutrophication poses a problem not only to ecosystems, but to humans as well. Reducing eutrophication should be a key concern when considering future policy, and a sustainable solution for everyone, including farmers and ranchers, seems feasible. While eutrophication does pose problems, humans should be aware that natural runoff (which causes algal blooms in the wild) is common in ecosystems and should thus not reverse nutrient concentrations beyond normal levels. Cleanup measures have been mostly, but not completely, successful. Finnish phosphorus removal measures started in the mid-1970s and have targeted rivers and lakes polluted by industrial and municipal discharges. These efforts have had a 90% removal efficiency. Still, some targeted point sources did not show a decrease in runoff despite reduction efforts.

Shellfish in estuaries: unique solutions

One proposed solution to eutrophication in estuaries is to restore shellfish populations, such as oysters and mussels. Oyster reefs remove nitrogen from the water column and filter out suspended solids, subsequently reducing the likelihood or extent of harmful algal blooms or anoxic conditions. Filter feeding activity is considered beneficial to water quality by controlling phytoplankton density and sequestering nutrients, which can be removed from the system through shellfish harvest, buried in the sediments, or lost through denitrification. Foundational work toward the idea of improving marine water quality through shellfish cultivation was conducted by Odd Lindahl et al., using mussels in Sweden. In the United States, shellfish restoration projects have been conducted on the East, West and Gulf coasts.

Minimizing nonpoint pollution: future work

Nonpoint pollution is the most difficult source of nutrients to manage. The literature suggests, though, that when these sources are controlled, eutrophication decreases. The following steps are recommended to minimize the amount of pollution that can enter aquatic ecosystems from ambiguous sources.

Riparian buffer zones

Studies show that intercepting non-point pollution between the source and the water is a successful means of prevention. Riparian buffer zones are interfaces between a flowing body of water and land, and have been created near waterways in an attempt to filter pollutants; sediment and nutrients are deposited here instead of in water. Creating buffer zones near farms and roads is another possible way to prevent nutrients from traveling too far. Still, studies have shown that the effects of atmospheric nitrogen pollution can reach far past the buffer zone. This suggests that the most effective means of prevention is from the primary source.

Prevention policy

Laws regulating the discharge and treatment of sewage have led to dramatic nutrient reductions to surrounding ecosystems, but it is generally agreed that a policy regulating agricultural use of fertilizer and animal waste must be imposed. In Japan the amount of nitrogen produced by livestock is adequate to serve the fertilizer needs for the agriculture industry. Thus, it is not unreasonable to command livestock owners to clean up animal waste—which when left stagnant will leach into ground water.

Policy concerning the prevention and reduction of eutrophication can be broken down into four sectors: Technologies, public participation, economic instruments, and cooperation. The term technology is used loosely, referring to a more widespread use of existing methods rather than an appropriation of new technologies. As mentioned before, nonpoint sources of pollution are the primary contributors to eutrophication, and their effects can be easily minimized through common agricultural practices. Reducing the amount of pollutants that reach a watershed can be achieved through the protection of its forest cover, reducing the amount of erosion leeching into a watershed. Also, through the efficient, controlled use of land using sustainable agricultural practices to minimize land degradation, the amount of soil runoff and nitrogen-based fertilizers reaching a watershed can be reduced. Waste disposal technology constitutes another factor in eutrophication prevention. Because a major contributor to the nonpoint source nutrient loading of water bodies is untreated domestic sewage, it is necessary to provide treatment facilities to highly urbanized areas, particularly those in underdeveloped nations, in which treatment of domestic waste water is a scarcity. The technology to safely and efficiently reuse waste water, both from domestic and industrial sources, should be a primary concern for policy regarding eutrophication.

The role of the public is a major factor for the effective prevention of eutrophication. In order for a policy to have any effect, the public must be aware of their contribution to the problem, and ways in which they can reduce their effects. Programs instituted to promote participation in the recycling and elimination of wastes, as well as education on the issue of rational water use are necessary to protect water quality within urbanized areas and adjacent water bodies.

Economic instruments, "which include, among others, property rights, water markets, fiscal and financial instruments, charge systems and liability systems, are gradually becoming a substantive component of the management tool set used for pollution control and water allocation decisions." Incentives for those who practice clean, renewable, water management technologies are an effective means of encouraging pollution prevention. By internalizing the costs associated with the negative effects on the environment, governments are able to encourage a cleaner water management.

Because a body of water can have an effect on a range of people reaching far beyond that of the watershed, cooperation between different organizations is necessary to prevent the intrusion of contaminants that can lead to eutrophication. Agencies ranging from state governments to those of water resource management and non-governmental organizations, going as low as the local population, are responsible for preventing eutrophication of water bodies. In the United States, the most well known inter-state effort to prevent eutrophication is the Chesapeake Bay.

Nitrogen testing and modeling

Soil Nitrogen Testing (N-Testing) is a technique that helps farmers optimize the amount of fertilizer applied to crops. By testing fields with this method, farmers saw a decrease in fertilizer application costs, a decrease in nitrogen lost to surrounding sources, or both. By testing the soil and modeling the bare minimum amount of fertilizer are needed, farmers reap economic benefits while reducing pollution.

Organic farming

There has been a study that found that organically fertilized fields "significantly reduce harmful nitrate leaching" over conventionally fertilized fields. However, a more recent study found that eutrophication impacts are in some cases higher from organic production than they are from conventional production.

Dredging

Dredging helps in reduction of soil contamination that was caused by sewage sludge (like fecal sludge), wilted plants, or chemical spill.

Bokashi

Bokashi is a modern method of eutrophication prevention to decrease smell and toxic materials. Bokashi (ぼかし) is Japanese for "shading off" or "gradation." It derives from the practice of Japanese farmers centuries ago of covering food waste with rich, local soil that contained the microorganisms that would ferment the waste. After a few weeks, they would bury the waste. Bokashi balls used in water pollution are made up of soil (either clay or loam or mixture of both), water, molasses, and antimicrobial solution; antimicrobial solution is used to kill germs (either bacteria or fungi), that cause foul odor, and algae.

Lie point symmetry

From Wikipedia, the free encyclopedia https://en.wikipedia.org/wiki/Lie_point_symmetry     ...