Search This Blog

Wednesday, September 16, 2020

Herbig–Haro object

From Wikipedia, the free encyclopedia
 
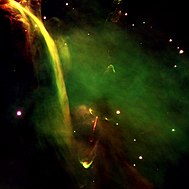
HH 24 is located in the Orion B molecular cloud
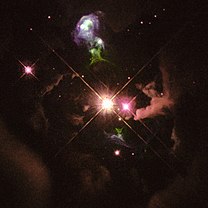
HH 32 looks like a star due to its intense brightness. The surrounding gas appears like clouds around a full moon.
Hubble Space Telescope images of HH 24 (left) and HH 32 (right; top) – colourful nebulae are typical of Herbig–Haro objects

Herbig–Haro (HH) objects are bright patches of nebulosity associated with newborn stars. They are formed when narrow jets of partially ionised gas ejected by stars collide with nearby clouds of gas and dust at several hundred kilometres per second. Herbig–Haro objects are commonly found in star-forming regions, and several are often seen around a single star, aligned with its rotational axis. Most of them lie within about one parsec (3.26 light-years) of the source, although some have been observed several parsecs away. HH objects are transient phenomena that last around a few tens of thousands of years. They can change visibly over timescales of a few years as they move rapidly away from their parent star into the gas clouds of interstellar space (the interstellar medium or ISM). Hubble Space Telescope observations have revealed the complex evolution of HH objects over the period of a few years, as parts of the nebula fade while others brighten as they collide with the clumpy material of the interstellar medium.

First observed in the late 19th century by Sherburne Wesley Burnham, Herbig–Haro objects were recognised as a distinct type of emission nebula in the 1940s. The first astronomers to study them in detail were George Herbig and Guillermo Haro, after whom they have been named. Herbig and Haro were working independently on studies of star formation when they first analysed the objects, and recognised that they were a by-product of the star formation process. Although HH objects are a visible wavelength phenomena, many remain invisible at these wavelengths due to dust and gas, and can only be detected at infrared wavelengths. Such objects, when observed in near infrared, are called molecular hydrogen emission-line objects (MHOs).

Discovery and history of observations

The first HH object was observed in the late 19th century by Sherburne Wesley Burnham, when he observed the star T Tauri with the 36-inch (910 mm) refracting telescope at Lick Observatory and noted a small patch of nebulosity nearby. It was thought to be an emission nebula, later becoming known as Burnham's Nebula, and was not recognized as a distinct class of object. T Tauri was found to be a very young and variable star, and is the prototype of the class of similar objects known as T Tauri stars which have yet to reach a state of hydrostatic equilibrium between gravitational collapse and energy generation through nuclear fusion at their centres. Fifty years after Burnham's discovery, several similar nebulae were discovered with almost star-like appearance. Both Haro and Herbig made independent observations of several of these objects in the Orion Nebula during the 1940s. Herbig also looked at Burnham's Nebula and found it displayed an unusual electromagnetic spectrum, with prominent emission lines of hydrogen, sulfur and oxygen. Haro found that all the objects of this type were invisible in infrared light.

Following their independent discoveries, Herbig and Haro met at an astronomy conference in Tucson, Arizona in December 1949. Herbig had initially paid little attention to the objects he had discovered, being primarily concerned with the nearby stars, but on hearing Haro's findings he carried out more detailed studies of them. The Soviet astronomer Viktor Ambartsumian gave the objects their name (Herbig–Haro objects, normally shortened to HH objects), and based on their occurrence near young stars (a few hundred thousand years old), suggested they might represent an early stage in the formation of T Tauri stars. Studies of the HH objects showed they were highly ionised, and early theorists speculated that they were reflection nebulae containing low-luminosity hot stars deep inside. But the absence of infrared radiation from the nebulae meant there could not be stars within them, as these would have emitted abundant infrared light. In 1975 American astronomer R. D. Schwartz theorized that winds from T Tauri stars produce shocks in the ambient medium on encounter, resulting in generation of visible light. With the discovery of the first proto-stellar jet in HH 46/47, it became clear that HH objects are indeed shock-induced phenomena with shocks being driven by a collimated jet from protostars.

Formation

Illustration depicting two arrows of matter moving outwards in opposite directions from a star-disk system, and creating bright emission caps at the ends, where they collide with the surrounding medium
Yellow-green emission cap produced by red jet from a star in a deep green nebula
HH objects are formed when accreted material is ejected by a protostar as ionized gas along the star's axis of rotation, as exemplified by HH 34 (right).

Stars form by gravitational collapse of interstellar gas clouds. As the collapse increases the density, radiative energy loss decreases due to increased opacity. This raises the temperature of the cloud which prevents further collapse, and a hydrostatic equilibrium is established. Gas continues to fall towards the core in a rotating disk. The core of this system is called a protostar. Some of the accreting material is ejected out along the star's axis of rotation in two jets of partially ionised gas (plasma). The mechanism for producing these collimated bipolar jets is not entirely understood, but it is believed that interaction between the accretion disk and the stellar magnetic field accelerates some of the accreting material from within a few astronomical units of the star away from the disk plane. At these distances the outflow is divergent, fanning out at an angle in the range of 10−30°, but it becomes increasingly collimated at distances of tens to hundreds of astronomical units from the source, as its expansion is constrained. The jets also carry away the excess angular momentum resulting from accretion of material onto the star, which would otherwise cause the star to rotate too rapidly and disintegrate. When these jets collide with the interstellar medium, they give rise to the small patches of bright emission which comprise HH objects.

Properties

Plot of light intensity vs wavelength featuring several dips, caused by absorption of light emitted from the star by the molecules in surrounding medium
Infrared spectrum of HH 46/47 obtained by the Spitzer Space Telescope, showing the medium in immediate vicinity of the star being silicate-rich

Electromagnetic emission from HH objects is caused when their associated shock waves collide with the interstellar medium, creating what is called the "terminal working surfaces". The spectrum is continuous, but also has intense emission lines of neutral and ionized species. Spectroscopic observations of HH objects' doppler shifts indicate velocities of several hundred kilometers per second, but the emission lines in those spectra are weaker than what would be expected from such high-speed collisions. This suggests that some of the material they are colliding with is also moving along the beam, although at a lower speed. Spectroscopic observations of HH objects show they are moving away from the source stars at speeds of several hundred kilometres per second. In recent years, the high optical resolution of the Hubble Space Telescope has revealed the proper motion (movement along the sky plane) of many HH objects in observations spaced several years apart. As they move away from the parent star, HH objects evolve significantly, varying in brightness on timescales of a few years. Individual compact knots or clumps within an object may brighten and fade or disappear entirely, while new knots have been seen to appear. These arise likely because of the precession of their jets, along with the pulsating and intermittent eruptions from their parent stars. Faster jets catch up with earlier slower jets, creating the so-called "internal working surfaces", where streams of gas collide and generate shock waves and consequent emissions.

The total mass being ejected by stars to form typical HH objects is estimated to be of the order of 10−8 to 10−6 M per year, a very small amount of material compared to the mass of the stars themselves but amounting to about 1–10% of the total mass accreted by the source stars in a year. Mass loss tends to decrease with increasing age of the source. The temperatures observed in HH objects are typically about 9,000–12,000 K, similar to those found in other ionized nebulae such as H II regions and planetary nebulae. Densities, on the other hand, are higher than in other nebulae, ranging from a few thousand to a few tens of thousands of particles per cm3, compared to a few thousand particles per cm3 in most H II regions and planetary nebulae.

Densities also decrease as the source evolves over time. HH objects consist mostly of hydrogen and helium, which account for about 75% and 24% of their mass respectively. Around 1% of the mass of HH objects is made up of heavier chemical elements, including oxygen, sulfur, nitrogen, iron, calcium and magnesium. Abundances of these elements, determined from emission lines of respective ions, are generally similar to their cosmic abundances. Many chemical compounds found in the surrounding interstellar medium, but not present in the source material, such as metal hydrides, are believed to have been produced by shock-induced chemical reactions. Around 20–30% of the gas in HH objects is ionized near the source star, but this proportion decreases at increasing distances. This implies the material is ionized in the polar jet, and recombines as it moves away from the star, rather than being ionized by later collisions. Shocking at the end of the jet can re-ionise some material, giving rise to bright "caps".

Numbers and distribution

Blue- and orange-appearing turbulent caps of emission
HH 2 (lower right), HH 34 (lower left), and HH 47 (top) were numbered in order of their discovery; it is estimated that there are up to 150,000 such objects in the Milky Way.

HH objects are named approximately in order of their identification; HH 1/2 being the earliest such objects to be identified. More than a thousand individual objects are now known. They are always present in star-forming H II regions, and are often found in large groups. They are typically observed near Bok globules (dark nebulae which contain very young stars) and often emanate from them. Several HH objects have been seen near a single energy source, forming a string of objects along the line of the polar axis of the parent star. The number of known HH objects has increased rapidly over the last few years, but that is a very small proportion of the estimated up to 150,000 in the Milky Way, the vast majority of which are too far away to be resolved. Most HH objects lie within about one parsec of their parent star. Many, however, are seen several parsecs away.

HH 46/47 is located about 450 parsecs (1,500 light-years) away from the Sun and is powered by a class I protostar binary. The bipolar jet is slamming into the surrounding medium at a velocity of 300 kilometers per second, producing two emission caps about 2.6 parsecs (8.5 light-years) apart. Jet outflow is accompanied by a 0.3 parsecs (0.98 light-years) long molecular gas outflow which is swept up by the jet itself. Infrared studies by Spitzer Space Telescope have revealed a variety of chemical compounds in the molecular outflow, including water (ice), methanol, methane, carbon dioxide (dry ice) and various silicates. Located around 460 parsecs (1,500 light-years) away in the Orion A molecular cloud, HH 34 is produced by a highly collimated bipolar jet powered by a class I protostar. Matter in the jet is moving at about 220 kilometers per second. Two bright bow shocks, separated by about 0.44 parsecs (1.4 light-years), are present on the opposite sides of the source, followed by series of fainter ones at larger distances, making the whole complex about 3 parsecs (9.8 light-years) long. The jet is surrounded by a 0.3 parsecs (0.98 light-years) long weak molecular outflow near the source.

Source stars

Thirteen-year timelapse of material ejecting from a class I protostar, forming the Herbig–Haro object HH 34

The stars from which HH jets are emitted are all very young stars, a few tens of thousands to about a million years old. The youngest of these are still protostars in the process of collecting from their surrounding gases. Astronomers divide these stars into classes 0, I, II and III, according to how much infrared radiation the stars emit. A greater amount of infrared radiation implies a larger amount of cooler material surrounding the star, which indicates it is still coalescing. The numbering of the classes arises because class 0 objects (the youngest) were not discovered until classes I, II and III had already been defined.

Class 0 objects are only a few thousand years old; so young that they are not yet undergoing nuclear fusion reactions at their centres. Instead, they are powered only by the gravitational potential energy released as material falls onto them. They mostly contain molecular outflows with low velocities (less than a hundred kilometres per second) and weak emissions in the outflows. Nuclear fusion has begun in the cores of Class I objects, but gas and dust are still falling onto their surfaces from the surrounding nebula, and most of their luminosity is accounted for by gravitational energy. They are generally still shrouded in dense clouds of dust and gas, which obscure all their visible light and as a result can only be observed at infrared and radio wavelengths. Outflows from this class are dominated by ionized species and velocities can range up to 400 kilometres per second. The in-fall of gas and dust has largely finished in Class II objects (Classical T Tauri stars), but they are still surrounded by disks of dust and gas, and produce weak outflows of low luminosity. Class III objects (Weak-line T Tauri stars) have only trace remnants of their original accretion disk.

About 80% of the stars giving rise to HH objects are binary or multiple systems (two or more stars orbiting each other), which is a much higher proportion than that found for low mass stars on the main sequence. This may indicate that binary systems are more likely to generate the jets which give rise to HH objects, and evidence suggests the largest HH outflows might be formed when multiple–star systems disintegrate. It is thought that most stars originate from multiple star systems, but that a sizable fraction of these systems are disrupted before their stars reach the main sequence due to gravitational interactions with nearby stars and dense clouds of gas.

Around proto-brown dwarfs

The first and currently only (as of May 2017) large-scale Herbig-Haro object around a proto-brown dwarf is HH 1165, which is connected to the proto-brown dwarf Mayrit 1701117. HH 1165 has a length of 0.8 light-years (0.26 parsec) and is located in the vicinity of the sigma Orionis cluster. Previously only small mini-jets (≤0.03 parsec) were found around proto-brown dwarfs.

Infrared counterparts

HH objects associated with very young stars or very massive protostars are often hidden from view at optical wavelengths by the cloud of gas and dust from which they form. The intervening material can diminish the visual magnitude by factors of tens or even hundreds at optical wavelengths. Such deeply embedded objects can only be observed at infrared or radio wavelengths, usually in the frequencies of hot molecular hydrogen or warm carbon monoxide emission. In recent years, infrared images have revealed dozens of examples of "infrared HH objects". Most look like bow waves (similar to the waves at the head of a ship), and so are usually referred to as molecular "bow shocks". The physics of infrared bow shocks can be understood in much the same way as that of HH objects, since these objects are essentially the same – supersonic shocks driven by collimated jets from the opposite poles of a protostar. It is only the conditions in the jet and surrounding cloud that are different, causing infrared emission from molecules rather than optical emission from atoms and ions. In 2009 the acronym "MHO", for Molecular Hydrogen emission-line Object, was approved for such objects, detected in near infrared, by the International Astronomical Union Working Group on Designations, and has been entered into their on-line Reference Dictionary of Nomenclature of Celestial Objects. The MHO catalog contains over 2000 objects.

Orion Molecular Cloud Complex

From Wikipedia, the free encyclopedia
 
Orion Molecular Cloud Complex
Molecular cloud
Molecular cloud complex
Orion Head to Toe.jpg
Part of the Orion Molecular Cloud Complex, with the Great Nebula in Orion near the center, along with the Belt of Orion, and Barnard's Loop curling around the image
Observation data: J2000.0 epoch
Right ascension 05h 35.3m
Declination−05° 23′
ConstellationOrion

DesignationsOrion Complex, Orion Cloud Complex, Orion Molecular Cloud Complex

The Orion Molecular Cloud Complex (or, simply, the Orion Complex) is a star forming region with stellar ages ranging up to 12 Myr. Two giant molecular clouds are a part of it, Orion A and Orion B. The stars currently forming within the Complex are located within these clouds. A number of other somewhat older stars no longer associated with the molecular gas are also part of the Complex, most notably the Orion's Belt (Orion OB1b), as well as the dispersed population north of it (Orion OB1a). Near the head of Orion there is also a population of young stars that is centered on Meissa. The Complex is between 1 000 and 1 400 light-years away, and hundreds of light-years across.

The Orion Complex is one of the most active regions of nearby stellar formation visible in the night sky, and is home to both protoplanetary discs and very young stars. Much of it is bright in infrared wavelengths due to the heat-intensive processes involved in stellar formation, though the complex contains dark nebulae, emission nebulae, reflection nebulae, and H II regions. The presence of ripples on the surface of Orion's Molecular Clouds was discovered in 2010. The ripples are a result of the expansion of the nebulae gas over pre-existing molecular gas.

The Orion Complex includes a large group of bright nebulae, dark clouds in the Orion constellation. Several nebulae can be observed through binoculars and small telescopes, and some parts (such as the Orion Nebula) are visible to the naked eye.

Nebulae within the complex

A labeled map of the Orion Molecular Cloud, with the images taken by IRAS and various telescopes that mapped CO in this part of the sky

The following is a list of notable regions within the larger Complex:

A more complete list can be found for example in Maddalena et al. (1986) Table 1

Individual components

Young stars in Orion A and Orion B molecular clouds. The clouds were imaged by Herschel and the newborn stars were imaged by ALMA and the VLA.

Orion A

The giant molecular cloud Orion A is the most active star-forming region in the local neighbourhood of the sun. In the last few million years about 3000 young stellar objects were formed in this region, including about 190 protostars and about 2600 pre-main sequence stars. The Orion A cloud has a mass in the order of 105 M. The stars in Orion A do not have the same distance to us. The "head" of the cloud, which also contains the Orion Nebula is about 1300 light-years (400 parsec) away from the sun. The "tail" however is up to 1530 light-years (470 parsec) away from the sun. The Orion A cloud is therefore longer than the projected length of 130 light-years (40 parsec) and has a true length of 290 light-years (90 parsec).

Orion B

Orion B is about 1370 light-years (420 parsec) distant to Earth. It has a size of about 1.5 kpc² and a mass in the order of 105 M. It contains several star forming regions with the star cluster inside the Flame Nebula being the largest cluster.

Orion OB1 association

The Orion OB1 association represents different stellar populations that are superimposed along our line of sight. The oldest group with 8-10 million years is Orion OB1a, northwest of Orion's Belt, and the youngest group with less than 2 million years is Orion OB1d, which contains the Orion Nebula cluster and NGC 2024.

Lambda Orionis molecular ring

The Lambda Orionis ring is a large molecular ring, centered around Lambda Orioinis (Meissa). It was suggested that this ring formed after a supernova happened inside the central star-forming region that once surrounded the Lambda Orionis Cluster, dispersing the material into the ring seen today. Star-formation is still continuing in regions of the ring.

Superbubble

Parts of the Orion-Eridanus superbubble were first seen as Barnard's Loop in Hydrogen-alpha images that warp around the eastern portion of Orion. The other part of the superbubble that is seen in H-alpha is the Eridanus Loop. The walls of the entire bubble are seen in far-infrared and HI. Some features of the Eridanus Loop might be as close as 590 light-years (180 parsec) to the sun.

Gallery

Minute and second of arc

From Wikipedia, the free encyclopedia
 
Arcminute
Arcminute and football.png
An illustration of the size of an arcminute (not to scale). A standard association football (soccer) ball (with a diameter of 22 cm or 8.7 in) subtends an angle of 1 arcminute at a distance of approximately 756 m (827 yd).
General information
Unit systemNon-SI units mentioned in the SI
Unit ofAngle
Symbol or arcmin 
In unitsDimensionless with an arc length of approx. ≈ 0.2909/1000 of the radius, i.e. 0.2909 mm/m
Conversions
1 in ...... is equal to ...
   degrees   1/60° = 0.016°
   arcseconds   60″
   radians   π/10800 ≈ 0.000290888 rad
   milliradians   π·1000/10800 ≈ 0.2909 mrad
   gons   600/9g = 66.6g
   turns   1/21600

A minute of arc, arcminute (arcmin), arc minute, or minute arc, denoted by the symbol , is a unit of angular measurement equal to 1/60 of one degree. Since one degree is 1/360 of a turn (or complete rotation), one minute of arc is 1/21600 of a turn. The nautical mile was originally defined as a minute of latitude on a hypothetical spherical Earth, so the actual Earth circumference is very near 21 600 nautical miles. A minute of arc is π/10800 of a radian.

A second of arc, arcsecond (arcsec), or arc second, denoted by the symbol , is 1/60 of an arcminute, 1/3600 of a degree, 1/1296000 of a turn, and π/648000 (about 1/206264.8) of a radian.

These units originated in Babylonian astronomy as sexagesimal subdivisions of the degree; they are used in fields that involve very small angles, such as astronomy, optometry, ophthalmology, optics, navigation, land surveying, and marksmanship.

To express even smaller angles, standard SI prefixes can be employed; the milliarcsecond (mas) and microarcsecond (μas), for instance, are commonly used in astronomy.

The number of square arcminutes in a complete sphere is 148510660 square arcminutes (the surface area of a unit sphere in square units, divided by the solid angle area subtended by a square arcminute (also in square units), so that the final result is a dimensionless number).

The fact that the terms "minute" and "second" also denote units of time derives from Babylonian astronomy, where the corresponding time-related terms denoted the duration of the Sun's apparent motion of one minute or one second of arc, respectively, through the ecliptic. In present terms, the Babylonian degree of time was four minutes long, so the "minute" of time was four seconds long and the "second" 1/15 of a second.

Symbols and abbreviations

The prime symbol (′) (U+2032) designates the arcminute, though a single quote (') (U+0027) is commonly used where only ASCII characters are permitted. One arcminute is thus written as 1′. It is also abbreviated as arcmin or amin or, less commonly, the prime with a circumflex over it ().

Similarly, double prime (″) (U+2033) designates the arcsecond, though a double quote (") (U+0022) is commonly used where only ASCII characters are permitted. One arcsecond is thus written as 1″. It is also abbreviated as arcsec or asec.

Sexagesimal system of angular measurement
Unit Value Symbol Abbreviations In radians, approx.
Degree 1/360 turn ° Degree deg 17.4532925 mrad
Arcminute 1/60 degree Prime arcmin, amin, am, , MOA 290.8882087 μrad
Arcsecond 1/60 arcminute = 1/3600 degree Double prime arcsec, asec, as 4.8481368 μrad
Milliarcsecond 0.001 arcsecond = 1/3600000 degree

mas 4.8481368 nrad
Microarcsecond 0.001 mas = 0.000001 arcsecond

μas 4.8481368 prad

In celestial navigation, seconds of arc are rarely used in calculations, the preference usually being for degrees, minutes and decimals of a minute, for example, written as 42° 25.32′ or 42° 25.322′. This notation has been carried over into marine GPS receivers, which normally display latitude and longitude in the latter format by default.

Common examples

The full moon's average apparent size is about 31 arcminutes (or 0.52°).

An arcminute is approximately the resolution of the human eye.

An arcsecond is approximately the angle subtended by a U.S. dime coin (18 mm) at a distance of 4 kilometres (about 2.5 mi). An arcsecond is also the angle subtended by

  • an object of diameter 725.27 km at a distance of one astronomical unit,
  • an object of diameter 45866916 km at one light-year,
  • an object of diameter one astronomical unit (149597870.7 km) at a distance of one parsec, per the definition of the latter.

A milliarcsecond is about the size of a dime atop the Eiffel Tower, as seen from New York City.

A microarcsecond is about the size of a period at the end of a sentence in the Apollo mission manuals left on the Moon as seen from Earth.

A nanoarcsecond is about the size of a penny on Neptune's moon Triton as observed from Earth.

Also notable examples of size in arcseconds are:

Uses

Astronomy

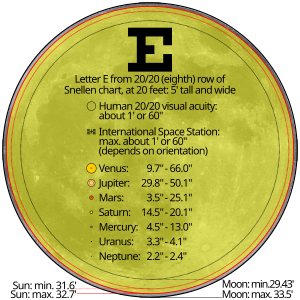
Comparison of angular diameter of the Sun, Moon, planets and the International Space Station. True representation of the sizes is achieved when the image is viewed at a distance of 103 times the width of the "Moon: max." circle. For example, if the "Moon: max." circle is 10 cm wide on a computer display, viewing it from 10.3 m (11.3 yards) away will show true representation of the sizes.

Since antiquity, the arcminute and arcsecond have been used in astronomy: in the ecliptic coordinate system as latitude (β) and longitude (λ); in the horizon system as altitude (Alt) and azimuth (Az); and in the equatorial coordinate system as declination (δ). All are measured in degrees, arcminutes and arcseconds. The principal exception is right ascension (RA) in equatorial coordinates, which is measured in time units of hours, minutes, and seconds.

The arcsecond is also often used to describe small astronomical angles such as the angular diameters of planets (e.g. the angular diameter of Venus which varies between 10″ and 60″), the proper motion of stars, the separation of components of binary star systems, and parallax, the small change of position of a star in the course of a year, or of a solar system body as the Earth rotates. These small angles may also be written in milliarcseconds (mas), or thousandths of an arcsecond. The unit of distance, the parsec, named from the parallax of one arc second, was developed for such parallax measurements. It is the distance at which the mean radius of the Earth's orbit (more precisely, one astronomical unit) would subtend an angle of one arcsecond.

The ESA astrometric satellite Gaia, launched in 2013, can approximate star positions to 7 microarcseconds (µas).

Milky Way’s central region with an angular resolution of 0.2 arcseconds.

Apart from the Sun, the star with the largest angular diameter from Earth is R Doradus, a red giant with a diameter of 0.05 arcsecond. Because of the effects of atmospheric blurring, ground-based telescopes will smear the image of a star to an angular diameter of about 0.5 arcsecond; in poor conditions this increases to 1.5 arcseconds or even more. The dwarf planet Pluto has proven difficult to resolve because its angular diameter is about 0.1 arcsecond.

Space telescopes are not affected by the Earth's atmosphere but are diffraction limited. For example, the Hubble Space Telescope can reach an angular size of stars down to about 0.1″. Techniques exist for improving seeing on the ground. Adaptive optics, for example, can produce images around 0.05 arcsecond on a 10 m class telescope.

Cartography

Minutes (′) and seconds (″) of arc are also used in cartography and navigation. At sea level one minute of arc along the equator or a meridian (indeed, any great circle) equals exactly one geographical mile along the Earth's equator or approximately one nautical mile (1,852 metres; 1.151 miles). A second of arc, one sixtieth of this amount, is roughly 30 metres (98 feet). The exact distance varies along meridian arcs because the figure of the Earth is slightly oblate (bulges a third of a percent at the equator).

Positions are traditionally given using degrees, minutes, and seconds of arcs for latitude, the arc north or south of the equator, and for longitude, the arc east or west of the Prime Meridian. Any position on or above the Earth's reference ellipsoid can be precisely given with this method. However, when it is inconvenient to use base-60 for minutes and seconds, positions are frequently expressed as decimal fractional degrees to an equal amount of precision. Degrees given to three decimal places (1/1000 of a degree) have about 1/4 the precision of degrees-minutes-seconds (1/3600 of a degree) and specify locations within about 120 metres (390 feet). For navigational purposes positions are given in degrees and decimal minutes, for instance The Needles lighthouse is at 50º 39.734’N 001º 35.500’W.

Property cadastral surveying

Related to cartography, property boundary surveying using the metes and bounds system relies on fractions of a degree to describe property lines' angles in reference to cardinal directions. A boundary "mete" is described with a beginning reference point, the cardinal direction North or South followed by an angle less than 90 degrees and a second cardinal direction, and a linear distance. The boundary runs the specified linear distance from the beginning point, the direction of the distance being determined by rotating the first cardinal direction the specified angle toward the second cardinal direction. For example, North 65° 39′ 18″ West 85.69 feet would describe a line running from the starting point 85.69 feet in a direction 65° 39′ 18″ (or 65.655°) away from north toward the west.

Firearms

Example ballistic table for a given 7.62×51mm NATO load. Bullet drop and wind drift are shown both in mrad and minute of angle.

The arcminute is commonly found in the firearms industry and literature, particularly concerning the precision of rifles, though the industry refers to it as minute of angle (MOA). It is especially popular as a unit of measurement with shooters familiar with the imperial measurement system because 1 MOA subtends a circle with a diameter of 1.047 inches (which is often rounded to just 1 inch) at 100 yards (2.908 cm at 100 m), a traditional distance on American target ranges. The subtension is linear with the distance, for example, at 500 yards, 1 MOA subtends 5.235 inches, and at 1000 yards 1 MOA subtends 10.47 inches. Since many modern telescopic sights are adjustable in half (1/2), quarter (1/4) or eighth (1/8) MOA increments, also known as clicks, zeroing and adjustments are made by counting 2, 4 and 8 clicks per MOA respectively.

For example, if the point of impact is 3 inches high and 1.5 inches left of the point of aim at 100 yards (which for instance could be measured by using a spotting scope with a calibrated reticle), the scope needs to be adjusted 3 MOA down, and 1.5 MOA right. Such adjustments are trivial when the scope's adjustment dials have a MOA scale printed on them, and even figuring the right number of clicks is relatively easy on scopes that click in fractions of MOA. This makes zeroing and adjustments much easier:

  • To adjust a ​12 MOA scope 3 MOA down and 1.5 MOA right, the scope needs to be adjusted 3 × 2 = 6 clicks down and 1.5 x 2 = 3 clicks right
  • To adjust a ​14 MOA scope 3 MOA down and 1.5 MOA right, the scope needs to be adjusted 3 x 4 = 12 clicks down and 1.5 × 4 = 6 clicks right
  • To adjust a ​18 MOA scope 3 MOA down and 1.5 MOA right, the scope needs to be adjusted 3 x 8 = 24 clicks down and 1.5 × 8 = 12 clicks right

Another common system of measurement in firearm scopes is the milliradian (mrad). Zeroing an mrad based scope is easy for users familiar with base ten systems. The most common adjustment value in mrad based scopes is 1/10 mrad (which approximates ​13 MOA).

  • To adjust a 1/10 mrad scope 0.9 mrad down and 0.4 mrad right, the scope needs to be adjusted 9 clicks down and 4 clicks right (which equals approximately 3 and 1.5 MOA respectively).

One thing to be aware of is that some MOA scopes, including some higher-end models, are calibrated such that an adjustment of 1 MOA on the scope knobs corresponds to exactly 1 inch of impact adjustment on a target at 100 yards, rather than the mathematically correct 1.047". This is commonly known as the Shooter's MOA (SMOA) or Inches Per Hundred Yards (IPHY). While the difference between one true MOA and one SMOA is less than half of an inch even at 1000 yards, this error compounds significantly on longer range shots that may require adjustment upwards of 20–30 MOA to compensate for the bullet drop. If a shot requires an adjustment of 20 MOA or more, the difference between true MOA and SMOA will add up to 1 inch or more. In competitive target shooting, this might mean the difference between a hit and a miss.

The physical group size equivalent to m minutes of arc can be calculated as follows: group size = tan(m/60) × distance. In the example previously given, for 1 minute of arc, and substituting 3,600 inches for 100 yards, 3,600 tan(1/60) ≈ 1.047 inches. In metric units 1 MOA at 100 metres ≈ 2.908 centimetres.

Sometimes, a precision-oriented firearm's performance will be measured in MOA. This simply means that under ideal conditions (i.e. no wind, high-grade ammo, clean barrel, and a stable mounting platform such as a vise or a benchrest used to eliminate shooter error), the gun is capable of producing a group of shots whose center points (center-to-center) fit into a circle, the average diameter of circles in several groups can be subtended by that amount of arc. For example, a 1 MOA rifle should be capable, under ideal conditions, of repeatably shooting 1-inch groups at 100 yards. Most higher-end rifles are warrantied by their manufacturer to shoot under a given MOA threshold (typically 1 MOA or better) with specific ammunition and no error on the shooter's part. For example, Remington's M24 Sniper Weapon System is required to shoot 0.8 MOA or better, or be rejected from sale by quality control.

Rifle manufacturers and gun magazines often refer to this capability as sub-MOA, meaning a gun consistently shooting groups under 1 MOA. This means that a single group of 3 to 5 shots at 100 yards, or the average of several groups, will measure less than 1 MOA between the two furthest shots in the group, i.e. all shots fall within 1 MOA. If larger samples are taken (i.e., more shots per group) then group size typically increases, however this will ultimately average out. If a rifle was truly a 1 MOA rifle, it would be just as likely that two consecutive shots land exactly on top of each other as that they land 1 MOA apart. For 5-shot groups, based on 95% confidence, a rifle that normally shoots 1 MOA can be expected to shoot groups between 0.58 MOA and 1.47 MOA, although the majority of these groups will be under 1 MOA. What this means in practice is if a rifle that shoots 1-inch groups on average at 100 yards shoots a group measuring 0.7 inches followed by a group that is 1.3 inches, this is not statistically abnormal.

The Metric System counterpart of the MOA is the milliradian or mrad, being equal to one 1000th of the target range, laid out on a circle that has the observer as centre and the target range as radius. The number of milliradians on a full such circle therefore always is equal to 2 × π × 1000, regardless the target range. Therefore, 1 MOA ≈ 0.2909 mrad. This means that an object which spans 1 mrad on the reticle is at a range that is in metres equal to the object's size in millimetres (e.g. an object of 100 mm @ 1 mrad is 100 metres away). So there is no conversion factor required, contrary to the MOA system. A reticle with markings (hashes or dots) spaced with a one mrad apart (or a fraction of a mrad) are collectively called a mrad reticle. If the markings are round they are called mil-dots.

In the table below conversions from mrad to metric values are exact (e.g. 0.1 mrad equals exactly 10 mm at 100 metres), while conversions of minutes of arc to both metric and imperial values are approximate.

Comparison of milliradian (mrad) and minute of arc (MOA).
 
Conversion between common sight adjustments based on milliradian and minute of arc
Angle
adjustment
per click
Minutes
of arc
Milli-
radians
At 100 m At 100 yd
mm cm in in
112 0.083′ 0.024 mrad 2.42 mm 0.242 cm 0.0958 in 0.087 in
0.2510 mrad 0.086′ 0.025 mrad 2.5 mm 0.25 cm 0.0985 in 0.09 in
18 0.125′ 0.036 mrad 3.64 mm 0.36 cm 0.144 in 0.131 in
16 0.167′ 0.0485 mrad 4.85 mm 0.485 cm 0.192 in 0.175 in
0.510 mrad 0.172′ 0.05 mrad 5 mm 0.5 cm 0.197 in 0.18 in
14 0.25′ 0.073 mrad 7.27 mm 0.73 cm 0.29 in 0.26 in
110 mrad 0.344′ 0.1 mrad 10 mm 1 cm 0.39 in 0.36 in
12 0.5′ 0.145 mrad 14.54 mm 1.45 cm 0.57 in 0.52 in
1.510 mrad 0.516′ 0.15 mrad 15 mm 1.5 cm 0.59 in 0.54 in
210 mrad 0.688′ 0.2 mrad 20 mm 2 cm 0.79 in 0.72 in
1′ 1.0′ 0.291 mrad 29.1 mm 2.91 cm 1.15 in 1.047 in
1 mrad 3.438′ 1 mrad 100 mm 10 cm 3.9 in 3.6 in
  • 1′ at 100 yards is about 1.047 inches
  • 1′ ≈ 0.291 mrad (or 29.1 mm at 100 m, approximately 30 mm at 100 m)
  • 1 mrad ≈ 3.44′, so 1/10 mrad ≈ 1/3
  • 0.1 mrad equals exactly 1 cm at 100 m, or approximately 0.36 inches at 100 yards

Human vision

In humans, 20/20 vision is the ability to resolve a spatial pattern separated by a visual angle of one minute of arc. A 20/20 letter subtends 5 minutes of arc total.

Materials

The deviation from parallelism between two surfaces, for instance in optical engineering, is usually measured in arcminutes or arcseconds. In addition, arcseconds are sometimes used in rocking curve (ω-scan) x ray diffraction measurements of high-quality epitaxial thin films.

Manufacturing

Some measurement devices make use of arcminutes and arcseconds to measure angles when the object being measured is too small for direct visual inspection. For instance, a toolmaker's optical comparator will often include an option to measure in "minutes and seconds".


Neurosurgery

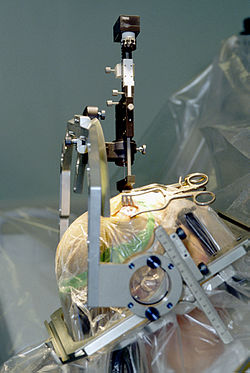
From Wikipedia, the free encyclopedia https://en.wikipedia.org/wiki/Neurosurg...