Search This Blog

Monday, March 25, 2024

Signal-to-noise ratio

From Wikipedia, the free encyclopedia
https://en.wikipedia.org/wiki/Signal-to-noise_ratio

Signal-to-noise ratio (SNR or S/N) is a measure used in science and engineering that compares the level of a desired signal to the level of background noise. SNR is defined as the ratio of signal power to noise power, often expressed in decibels. A ratio higher than 1:1 (greater than 0 dB) indicates more signal than noise.

SNR is an important parameter that affects the performance and quality of systems that process or transmit signals, such as communication systems, audio systems, radar systems, imaging systems, and data acquisition systems. A high SNR means that the signal is clear and easy to detect or interpret, while a low SNR means that the signal is corrupted or obscured by noise and may be difficult to distinguish or recover. SNR can be improved by various methods, such as increasing the signal strength, reducing the noise level, filtering out unwanted noise, or using error correction techniques.

SNR also determines the maximum possible amount of data that can be transmitted reliably over a given channel, which depends on its bandwidth and SNR. This relationship is described by the Shannon–Hartley theorem, which is a fundamental law of information theory.

SNR can be calculated using different formulas depending on how the signal and noise are measured and defined. The most common way to express SNR is in decibels, which is a logarithmic scale that makes it easier to compare large or small values. Other definitions of SNR may use different factors or bases for the logarithm, depending on the context and application.

Definition

Signal-to-noise ratio is defined as the ratio of the power of a signal (meaningful input) to the power of background noise (meaningless or unwanted input):

where P is average power. Both signal and noise power must be measured at the same or equivalent points in a system, and within the same system bandwidth.

Depending on whether the signal is a constant (s) or a random variable (S), the signal-to-noise ratio for random noise N becomes:

where E refers to the expected value, i.e. in this case the mean square of N, or

If the noise has expected value of zero, as is common, the denominator is its variance, the square of its standard deviation σN.


The signal and the noise must be measured the same way, for example as voltages across the same impedance. The root mean squares can alternatively be used in the ratio:

where A is root mean square (RMS) amplitude (for example, RMS voltage).

Decibels

Because many signals have a very wide dynamic range, signals are often expressed using the logarithmic decibel scale. Based upon the definition of decibel, signal and noise may be expressed in decibels (dB) as

and

In a similar manner, SNR may be expressed in decibels as

Using the definition of SNR

Using the quotient rule for logarithms

Substituting the definitions of SNR, signal, and noise in decibels into the above equation results in an important formula for calculating the signal to noise ratio in decibels, when the signal and noise are also in decibels:

In the above formula, P is measured in units of power, such as watts (W) or milliwatts (mW), and the signal-to-noise ratio is a pure number.

However, when the signal and noise are measured in volts (V) or amperes (A), which are measures of amplitude, they must first be squared to obtain a quantity proportional to power, as shown below:

Dynamic range

The concepts of signal-to-noise ratio and dynamic range are closely related. Dynamic range measures the ratio between the strongest un-distorted signal on a channel and the minimum discernible signal, which for most purposes is the noise level. SNR measures the ratio between an arbitrary signal level (not necessarily the most powerful signal possible) and noise. Measuring signal-to-noise ratios requires the selection of a representative or reference signal. In audio engineering, the reference signal is usually a sine wave at a standardized nominal or alignment level, such as 1 kHz at +4 dBu (1.228 VRMS).

SNR is usually taken to indicate an average signal-to-noise ratio, as it is possible that instantaneous signal-to-noise ratios will be considerably different. The concept can be understood as normalizing the noise level to 1 (0 dB) and measuring how far the signal 'stands out'.

Difference from conventional power

In physics, the average power of an AC signal is defined as the average value of voltage times current; for resistive (non-reactive) circuits, where voltage and current are in phase, this is equivalent to the product of the rms voltage and current:

But in signal processing and communication, one usually assumes that   so that factor is usually not included while measuring power or energy of a signal. This may cause some confusion among readers, but the resistance factor is not significant for typical operations performed in signal processing, or for computing power ratios. For most cases, the power of a signal would be considered to be simply

Alternative definition

An alternative definition of SNR is as the reciprocal of the coefficient of variation, i.e., the ratio of mean to standard deviation of a signal or measurement:

where is the signal mean or expected value and is the standard deviation of the noise, or an estimate thereof. Notice that such an alternative definition is only useful for variables that are always non-negative (such as photon counts and luminance), and it is only an approximation since . It is commonly used in image processing, where the SNR of an image is usually calculated as the ratio of the mean pixel value to the standard deviation of the pixel values over a given neighborhood.

Sometimes SNR is defined as the square of the alternative definition above, in which case it is equivalent to the more common definition:

This definition is closely related to the sensitivity index or d', when assuming that the signal has two states separated by signal amplitude , and the noise standard deviation does not change between the two states.

The Rose criterion (named after Albert Rose) states that an SNR of at least 5 is needed to be able to distinguish image features with certainty. An SNR less than 5 means less than 100% certainty in identifying image details.

Yet another alternative, very specific, and distinct definition of SNR is employed to characterize sensitivity of imaging systems; see Signal-to-noise ratio (imaging).

Related measures are the "contrast ratio" and the "contrast-to-noise ratio".

Modulation system measurements

Amplitude modulation

Channel signal-to-noise ratio is given by

where W is the bandwidth and is modulation index

Output signal-to-noise ratio (of AM receiver) is given by

Frequency modulation

Channel signal-to-noise ratio is given by

Output signal-to-noise ratio is given by

Noise reduction

Recording from a thermogravimetric analysis device with poor mechanical isolation; the middle of the plot shows lower noise due to reduced human activity at night.

All real measurements are disturbed by noise. This includes electronic noise, but can also include external events that affect the measured phenomenon — wind, vibrations, the gravitational attraction of the moon, variations of temperature, variations of humidity, etc., depending on what is measured and of the sensitivity of the device. It is often possible to reduce the noise by controlling the environment.

Internal electronic noise of measurement systems can be reduced through the use of low-noise amplifiers.

When the characteristics of the noise are known and are different from the signal, it is possible to use a filter to reduce the noise. For example, a lock-in amplifier can extract a narrow bandwidth signal from broadband noise a million times stronger.

When the signal is constant or periodic and the noise is random, it is possible to enhance the SNR by averaging the measurements. In this case the noise goes down as the square root of the number of averaged samples.

Digital signals

When a measurement is digitized, the number of bits used to represent the measurement determines the maximum possible signal-to-noise ratio. This is because the minimum possible noise level is the error caused by the quantization of the signal, sometimes called quantization noise. This noise level is non-linear and signal-dependent; different calculations exist for different signal models. Quantization noise is modeled as an analog error signal summed with the signal before quantization ("additive noise").

This theoretical maximum SNR assumes a perfect input signal. If the input signal is already noisy (as is usually the case), the signal's noise may be larger than the quantization noise. Real analog-to-digital converters also have other sources of noise that further decrease the SNR compared to the theoretical maximum from the idealized quantization noise, including the intentional addition of dither.

Although noise levels in a digital system can be expressed using SNR, it is more common to use Eb/No, the energy per bit per noise power spectral density.

The modulation error ratio (MER) is a measure of the SNR in a digitally modulated signal.

Fixed point

For n-bit integers with equal distance between quantization levels (uniform quantization) the dynamic range (DR) is also determined.

Assuming a uniform distribution of input signal values, the quantization noise is a uniformly distributed random signal with a peak-to-peak amplitude of one quantization level, making the amplitude ratio 2n/1. The formula is then:

This relationship is the origin of statements like "16-bit audio has a dynamic range of 96 dB". Each extra quantization bit increases the dynamic range by roughly 6 dB.

Assuming a full-scale sine wave signal (that is, the quantizer is designed such that it has the same minimum and maximum values as the input signal), the quantization noise approximates a sawtooth wave with peak-to-peak amplitude of one quantization level and uniform distribution. In this case, the SNR is approximately

Floating point

Floating-point numbers provide a way to trade off signal-to-noise ratio for an increase in dynamic range. For n bit floating-point numbers, with n-m bits in the mantissa and m bits in the exponent:

Note that the dynamic range is much larger than fixed-point, but at a cost of a worse signal-to-noise ratio. This makes floating-point preferable in situations where the dynamic range is large or unpredictable. Fixed-point's simpler implementations can be used with no signal quality disadvantage in systems where dynamic range is less than 6.02m. The very large dynamic range of floating-point can be a disadvantage, since it requires more forethought in designing algorithms.

Optical signals

Optical signals have a carrier frequency (about 200 THz and more) that is much higher than the modulation frequency. This way the noise covers a bandwidth that is much wider than the signal itself. The resulting signal influence relies mainly on the filtering of the noise. To describe the signal quality without taking the receiver into account, the optical SNR (OSNR) is used. The OSNR is the ratio between the signal power and the noise power in a given bandwidth. Most commonly a reference bandwidth of 0.1 nm is used. This bandwidth is independent of the modulation format, the frequency and the receiver. For instance an OSNR of 20 dB/0.1 nm could be given, even the signal of 40 GBit DPSK would not fit in this bandwidth. OSNR is measured with an optical spectrum analyzer.

Types and abbreviations

Signal to noise ratio may be abbreviated as SNR and less commonly as S/N. PSNR stands for peak signal-to-noise ratio. GSNR stands for geometric signal-to-noise ratio. SINR is the signal-to-interference-plus-noise ratio.

Other uses

While SNR is commonly quoted for electrical signals, it can be applied to any form of signal, for example isotope levels in an ice core, biochemical signaling between cells, or financial trading signals. The term is sometimes used metaphorically to refer to the ratio of useful information to false or irrelevant data in a conversation or exchange. For example, in online discussion forums and other online communities, off-topic posts and spam are regarded as noise that interferes with the signal of appropriate discussion.

SNR can also be applied in marketing and how business professionals manage information overload. Managing a healthy signal to noise ratio can help business executives improve their KPIs (Key Performance Indicators).

Similar Concepts

The signal-to-noise ratio is similar to Cohen's d given by the difference of estimated means divided by the standard deviation of the data and is related to the test statistic in the t-test

Pareidolia

From Wikipedia, the free encyclopedia
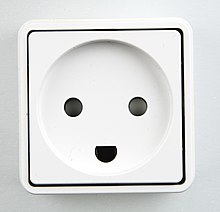
The Danish electrical outlet purportedly resembles a happy face.

Pareidolia (/ˌpærɪˈdliə, ˌpɛər-/; also US: /ˌpɛər-/) is the tendency for perception to impose a meaningful interpretation on a nebulous stimulus, usually visual, so that one detects an object, pattern, or meaning where there is none. Pareidolia is a type of apophenia.

Common examples include perceived images of animals, faces, or objects in cloud formations; seeing faces in inanimate objects; or lunar pareidolia like the Man in the Moon or the Moon rabbit. The concept of pareidolia may extend to include hidden messages in recorded music played in reverse or at higher- or lower-than-normal speeds, and hearing voices (mainly indistinct) or music in random noise, such as that produced by air conditioners or by fans.

Etymology

The word derives from the Greek words pará (παρά, "beside, alongside, instead [of]") and the noun eídōlon (εἴδωλον, "image, form, shape").

The German word Pareidolie was used in articles by Karl Ludwig Kahlbaum—for example in his 1866 paper "Die Sinnesdelierien" ("On Delusion of the Senses"). When Kahlbaum's paper was reviewed the following year (1867) in The Journal of Mental Science, Volume 13, Pareidolie was translated into English as "pareidolia", and noted to be synonymous with the terms "...changing hallucination, partial hallucination, [and] perception of secondary images."

Link to other conditions

Pareidolia is frequent among patients with Parkinson's disease and dementia with Lewy bodies. Pareidolia correlates with age but not autism traits.

Explanations

Pareidolia can cause people to interpret random images, or patterns of light and shadow, as faces. A 2009 magnetoencephalography study found that objects perceived as faces evoke an early (165 ms) activation of the fusiform face area at a time and location similar to that evoked by faces, whereas other common objects do not evoke such activation. This activation is similar to a slightly faster time (130 ms) that is seen for images of real faces. The authors suggest that face perception evoked by face-like objects is a relatively early process, and not a late cognitive reinterpretation phenomenon.

A functional magnetic resonance imaging (fMRI) study in 2011 similarly showed that repeated presentation of novel visual shapes that were interpreted as meaningful led to decreased fMRI responses for real objects. These results indicate that the interpretation of ambiguous stimuli depends upon processes similar to those elicited by known objects.

Pareidolia is the illusory facial recognition in faceless objects. Pareidolia was found to affect brain function and brain waves. In a 2022 study, EEG records show that responses in the frontal and occipitotemporal cortexes begin prior to when one recognizes faces and later when they are not recognized. By displaying these proactive brain waves, scientists can then have a basis for data rather than relying on people’s words. After a collection of the data, scientists can develop further information on the people’s words.

These studies help to explain why people generally identify a few lines and a circle as a "face" so quickly and without hesitation. Cognitive processes are activated by the "face-like" object which alerts the observer to both the emotional state and identity of the subject, even before the conscious mind begins to process or even receive the information. A "stick figure face", despite its simplicity, can convey mood information, and be drawn to indicate emotions such as happiness or anger. This robust and subtle capability is hypothesized to be the result of natural selection favoring people most able to quickly identify the mental state, for example, of threatening people, thus providing the individual an opportunity to flee or attack pre-emptively. This ability, though highly specialized for the processing and recognition of human emotions, also functions to determine the demeanor of wildlife.

Examples

Mimetoliths

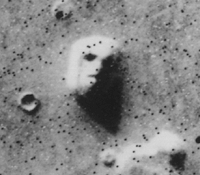
Satellite photograph of a mesa in the Cydonia region of Mars, often called the "Face on Mars" and cited as evidence of extraterrestrial habitation
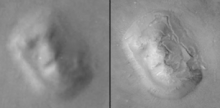
A more detailed photograph taken in different lighting in 2001 shows how it is a natural rock formation.

A mimetolithic pattern is a pattern created by rocks that may come to mimic recognizable forms through the random processes of formation, weathering and erosion. A well-known example is the Face on Mars, a rock formation on Mars that resembled a human face in certain satellite photos. Most mimetoliths are much larger than the subjects they resemble, such as a cliff profile which looks like a human face.

Picture jaspers exhibit combinations of patterns such as banding from flow or depositional patterns (from water or wind), or dendritic or color variations, resulting in what appear to be miniature scenes on a cut section, which is then used for jewelry.

Chert nodules, concretions, or pebbles may in certain cases be mistakenly identified as skeletal remains, egg fossils, or other antiquities of organic origin by amateur enthusiasts.

In the late 1970s and early 1980s, Japanese researcher Chonosuke Okamura self-published a series of reports titled Original Report of the Okamura Fossil Laboratory, in which he described tiny inclusions in polished limestone from the Silurian period (425 mya) as being preserved fossil remains of tiny humans, gorillas, dogs, dragons, dinosaurs and other organisms, all of them only millimeters long, leading him to claim, "There have been no changes in the bodies of mankind since the Silurian period... except for a growth in stature from 3.5 mm to 1,700 mm." Okamura's research earned him an Ig Nobel Prize (a parody of the Nobel Prizes) in biodiversity in 1996.

Some sources describe various mimetolithic features on Pluto, including a heart-shaped region.

Seeing shapes in cloud patterns is another example of this phenomenon. Rogowitz and Voss (1990) showed a relationship between seeing shapes in cloud patterns and fractal dimension. They varied the fractal dimension of the boundary contour from 1.2 to 1.8, and found that the lower the fractal dimension, the more likely people were to report seeing namable shapes of animals, faces, and fantasy creatures. 

Mars canals

Map of Martian "canals" by Percival Lowell

A notable example of pareidolia occurred in 1877, when observers using telescopes to view the surface of Mars thought that they saw faint straight lines, which were then interpreted by some as canals (see Martian canals). It was theorized that the canals were possibly created by sentient beings. This created a sensation. In the next few years better photographic techniques and stronger telescopes were developed and applied, which resulted in new images in which the faint lines disappeared, and the canal theory was debunked as an example of pareidolia.

Projective tests

The Rorschach inkblot test uses pareidolia in an attempt to gain insight into a person's mental state. The Rorschach is a projective test that elicits thoughts or feelings of respondents that are "projected" onto the ambiguous inkblot images. Rorschach inkblots have low-fractal-dimension boundary contours, which may elicit general shape naming behaviors, serving as the vehicle for projected meanings.

Banknotes

Owing to the way designs are engraved and printed, occurrences of pareidolia have occasionally been reported in banknotes.

One example is the 1954 Canadian Landscape Canadian dollar banknote series, known among collectors for the "Devil's Head" variety of the initial print runs. The obverse of the notes features what appears to be an exaggerated grinning face formed from patterns in the hair of Queen Elizabeth II. The phenomenon generated enough attention for revised designs to be issued in 1956 which removed the effect.

Literature

Renaissance authors have shown a particular interest in pareidolia. In William Shakespeare's play Hamlet, for example, the titular character points at the sky and "demonstrates" his supposed madness in this exchange with Polonius:

HAMLET
Do you see yonder cloud that's almost in the shape of a camel?
POLONIUS
By th'Mass and 'tis, like a camel indeed.
HAMLET
Methinks it is a weasel.
POLONIUS
It is backed like a weasel.
HAMLET
Or a whale.
POLONIUS
Very like a whale.

Nathaniel Hawthorne wrote a short story called The Great Stone Face in which a face seen in the side of a mountain is revered by a village.

Art

Renaissance artists often used pareidolia in paintings and drawings: Andrea Mantegna, Leonardo da Vinci, Giotto, Hans Holbein, Giuseppe Arcimboldo, and many more have shown images—often human faces—that due to pareidolia appear in objects or clouds.

The Jurist by Giuseppe Arcimboldo, 1566. What appears to be his face is a collection of fish and poultry, while his body is a collection of books dressed in a coat.

In his notebooks, Leonardo da Vinci wrote of pareidolia as a device for painters, writing:

If you look at any walls spotted with various stains or with a mixture of different kinds of stones, if you are about to invent some scene you will be able to see in it a resemblance to various different landscapes adorned with mountains, rivers, rocks, trees, plains, wide valleys, and various groups of hills. You will also be able to see divers combats and figures in quick movement, and strange expressions of faces, and outlandish costumes, and an infinite number of things which you can then reduce into separate and well conceived forms.

Salem by Sydney Curnow Vosper (1908), a painting notorious for the belief that the face of the devil was hidden in the main character's shawl

In twentieth century art Salem, a 1908 painting by Sydney Curnow Vosper, gained notoriety due to a rumour that it contained a hidden face, that of the devil. This led many commentators to visualize a demonic face depicted in the shawl of the main figure, despite the artist's denial that any faces had deliberately been painted into the shawl.

Surrealist artists such as Salvador Dalí would intentionally use pareidolia in their works, often in the form of a hidden face.

Architecture

Illusory woman in the Niğde Alaaddin Mosque portal

Two 13th-century edifices in Turkey display architectural use of shadows of stone carvings at the entrance. Outright pictures are avoided in Islam but tessellations and calligraphic pictures were allowed, so designed "accidental" silhouettes of carved stone tessellations became a creative escape.

  • Niğde Alaaddin Mosque in Niğde, Turkey (1223), with its "mukarnas" art where the shadows of three-dimensional ornamentation with stone masonry around the entrance form a chiaroscuro drawing of a woman's face with a crown and long hair appearing at a specific time, at some specific days of the year.
  • Divriği Great Mosque and Hospital in Sivas, Turkey (1229), shows shadows of the three-dimensional ornaments of both entrances of the mosque part, to cast a giant shadow of a praying man that changes pose as the sun moves, as if to illustrate what the purpose of the building is. Another detail is the difference in the impressions of the clothing of the two shadow-men indicating two different styles, possibly to tell who is to enter through which door.

Religion

There have been many instances of perceptions of religious imagery and themes, especially the faces of religious figures, in ordinary phenomena. Many involve images of Jesus, the Virgin Mary, the word Allah, or other religious phenomena: in September 2007 in Singapore, for example, a callus on a tree resembled a monkey, leading believers to pay homage to the "Monkey god" (either Sun Wukong or Hanuman) in the monkey tree phenomenon.

Publicity surrounding sightings of religious figures and other surprising images in ordinary objects has spawned a market for such items on online auctions like eBay. One famous instance was a grilled cheese sandwich with the face of the Virgin Mary.

During the September 11 attacks, television viewers supposedly saw the face of Satan in clouds of smoke billowing out of the World Trade Center after it was struck by the airplane. Another example of face recognition pareidolia originated in the fire at Notre Dame Cathedral, when a few observers claimed to see Jesus in the flames.

While attempting to validate the imprint of a crucified man on the Shroud of Turin as Jesus Christ, a variety of objects have been described as being visible on the linen. These objects include a number of plant species, a coin with Roman numerals, and multiple insect species. In an experimental setting using a picture of plain linen cloth, participants told that there could possibly be visible words in the cloth collectively saw 2 religious words, those told that the cloth was of some religious importance saw 12 religious words, and those who were also told that it was of religious importance, but also given suggestions of possible religious words, saw 37 religious words. The researchers posit that the reason the Shroud has been said to have so many different symbols and objects is because it was already deemed to have the imprint of Jesus Christ prior to the search for symbols and other imprints in the cloth, and therefore it was simply pareidolia at work.

Computer vision

Given an image of jellyfish swimming, the DeepDream program can be encouraged to "see" dogs.

Pareidolia can occur in computer vision, specifically in image recognition programs, in which vague clues can spuriously detect images or features. In the case of an artificial neural network, higher-level features correspond to more recognizable features, and enhancing these features brings out what the computer sees. These examples of pareidolia reflect the training set of images that the network has "seen" previously.

Striking visuals can be produced in this way, notably in the DeepDream software, which falsely detects and then exaggerates features such as eyes and faces in any image. The features can be further exaggerated by creating a feedback loop where the output is used as the input for the network. (The adjacent image was created by iterating the loop 50 times.) Additionally the output can be modified such as slightly zooming in to create an animation of the images perspective flying through the surrealistic imagery.

Auditory

In 1971 Konstantīns Raudive wrote Breakthrough, detailing what he believed was the discovery of electronic voice phenomena (EVP). EVP has been described as auditory pareidolia. Allegations of backmasking in popular music, in which a listener claims a message has been recorded backward onto a track meant to be played forward, have also been described as auditory pareidolia. In 1995, the psychologist Diana Deutsch invented an algorithm for producing phantom words and phrases with the sounds coming from two stereo loudspeakers, one to the listener's left and the other to his right, producing a phase offset in time between the speakers. After listening for a while, phantom words and phrases suddenly emerge, and these often appear to reflect what is on the listener's mind.

Deliberate practical use

Medical education, radiology images

Cross-section of male nematode worm Ascaris

Medical educators sometimes teach medical students and resident physicians (doctors in training) to use pareidolia and patternicity to learn to recognize human anatomy on radiology imaging studies.

Examples include assessing radiographs (X-ray images) of the human vertebral spine. Patrick Foye, M.D., professor of physical medicine and rehabilitation at Rutgers University, New Jersey Medical School, has written that pareidolia is used to teach medical trainees to assess for spinal fractures and spinal malignancies (cancers). When viewing spinal radiographs, normal bony anatomic structures resemble the face of an owl. (The spinal pedicles resemble an owl's eyes and the spinous process resembles an owl's beak.) But when cancer erodes the bony spinal pedicle, the radiographic appearance changes such that now that eye of the owl seems missing or closed, which is called the "winking owl sign". Another common pattern is a "Scottie dog sign" on a spinal X-ray.

In 2021, Foye again published in the medical literature on this topic, in a medical journal article called "Baby Yoda: Pareidolia and Patternicity in Sacral MRI and CT Scans". Here, he introduced a novel way of visualizing the sacrum when viewing MRI magnetic resonance imaging and CT scans (computed tomography scans). He noted that in certain image slices the human sacral anatomy resembles the face of "Baby Yoda" (also called Grogu), a fictional character from the television show The Mandalorian. Sacral openings for exiting nerves (sacral foramina) resemble Baby Yoda's eyes, while the sacral canal resembles Baby Yoda's mouth.

In popular culture

Many internet memes about Among Us exploit pareidolia, by showing everyday items that look similar to crewmates from the game.

In January 2017, an anonymous user placed an eBay auction of a Cheeto that looked like the gorilla Harambe. Bidding began at US$11.99, but the Cheeto was eventually sold for US$99,000.

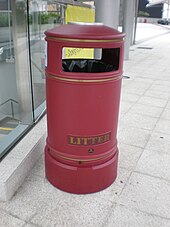
Starting from 2021, an internet meme emerged around Among Us, where users presented everyday items such as dogs, statues, garbage cans, big toes, and pictures of the Boomerang Nebula that looked like the game's "crewmate" protagonists. In May 2021, an eBay user named Tav listed a Chicken McNugget shaped like a crewmate from Among Us for online auction. The Chicken McNugget was sold for US$99,997 to an anonymous buyer.

Related phenomena

A shadow person (also known as a shadow figure, shadow being or black mass) is often attributed to pareidolia. It is the perception of a patch of shadow as a living, humanoid figure, particularly as interpreted by believers in the paranormal or supernatural as the presence of a spirit or other entity.

Pareidolia is also what some skeptics believe causes people to believe that they have seen ghosts.

Operator (computer programming)

From Wikipedia, the free encyclopedia https://en.wikipedia.org/wiki/Operator_(computer_programmin...