Search This Blog

Saturday, June 30, 2018

System dynamics

From Wikipedia, the free encyclopedia
 
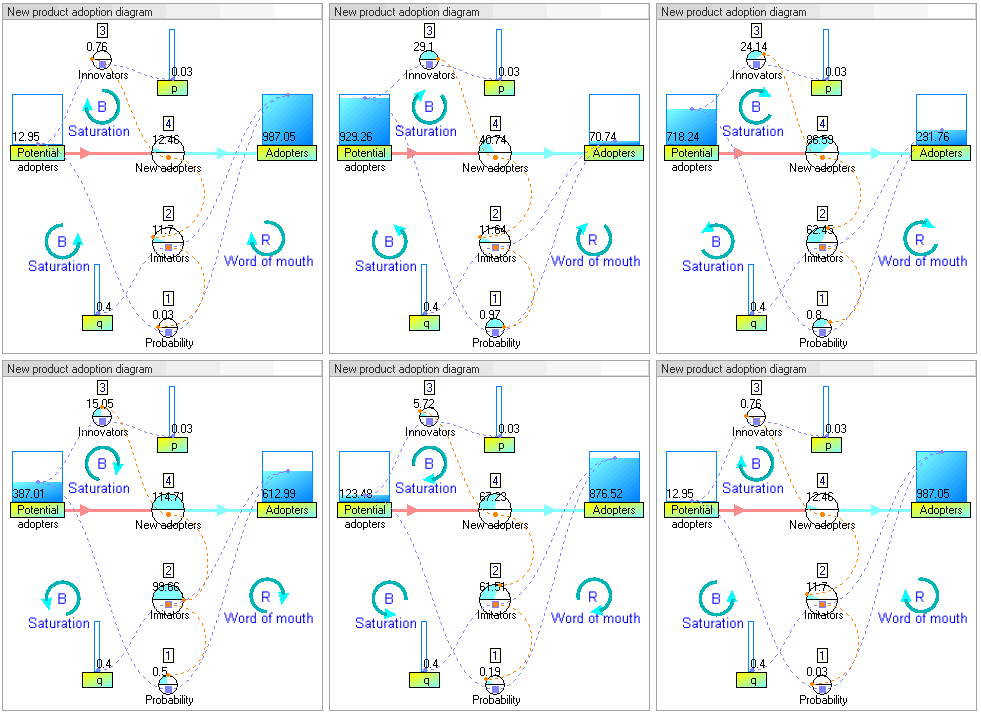
Dynamic stock and flow diagram of model New product adoption (model from article by John Sterman 2001)

System dynamics (SD) is an approach to understanding the nonlinear behaviour of complex systems over time using stocks, flows, internal feedback loops, table functions and time delays.

Overview

System dynamics is a methodology and mathematical modeling technique to frame, understand, and discuss complex issues and problems. Originally developed in the 1950s to help corporate managers improve their understanding of industrial processes, SD is currently being used throughout the public and private sector for policy analysis and design.[2]

Convenient graphical user interface (GUI) system dynamics software developed into user friendly versions by the 1990s and have been applied to diverse systems. SD models solve the problem of simultaneity (mutual causation) by updating all variables in small time increments with positive and negative feedbacks and time delays structuring the interactions and control. The best known SD model is probably the 1972 The Limits to Growth. This model forecast that exponential growth of population and capital, with finite resource sources and sinks and perception delays, would lead to economic collapse during the 21st century under a wide variety of growth scenarios.

System dynamics is an aspect of systems theory as a method to understand the dynamic behavior of complex systems. The basis of the method is the recognition that the structure of any system, the many circular, interlocking, sometimes time-delayed relationships among its components, is often just as important in determining its behavior as the individual components themselves. Examples are chaos theory and social dynamics. It is also claimed that because there are often properties-of-the-whole which cannot be found among the properties-of-the-elements, in some cases the behavior of the whole cannot be explained in terms of the behavior of the parts.

History

System dynamics was created during the mid-1950s[3] by Professor Jay Forrester of the Massachusetts Institute of Technology. In 1956, Forrester accepted a professorship in the newly formed MIT Sloan School of Management. His initial goal was to determine how his background in science and engineering could be brought to bear, in some useful way, on the core issues that determine the success or failure of corporations. Forrester's insights into the common foundations that underlie engineering, which led to the creation of system dynamics, were triggered, to a large degree, by his involvement with managers at General Electric (GE) during the mid-1950s. At that time, the managers at GE were perplexed because employment at their appliance plants in Kentucky exhibited a significant three-year cycle. The business cycle was judged to be an insufficient explanation for the employment instability. From hand simulations (or calculations) of the stock-flow-feedback structure of the GE plants, which included the existing corporate decision-making structure for hiring and layoffs, Forrester was able to show how the instability in GE employment was due to the internal structure of the firm and not to an external force such as the business cycle. These hand simulations were the start of the field of system dynamics.[2]

During the late 1950s and early 1960s, Forrester and a team of graduate students moved the emerging field of system dynamics from the hand-simulation stage to the formal computer modeling stage. Richard Bennett created the first system dynamics computer modeling language called SIMPLE (Simulation of Industrial Management Problems with Lots of Equations) in the spring of 1958. In 1959, Phyllis Fox and Alexander Pugh wrote the first version of DYNAMO (DYNAmic MOdels), an improved version of SIMPLE, and the system dynamics language became the industry standard for over thirty years. Forrester published the first, and still classic, book in the field titled Industrial Dynamics in 1961.[2]

From the late 1950s to the late 1960s, system dynamics was applied almost exclusively to corporate/managerial problems. In 1968, however, an unexpected occurrence caused the field to broaden beyond corporate modeling. John F. Collins, the former mayor of Boston, was appointed a visiting professor of Urban Affairs at MIT. The result of the Collins-Forrester collaboration was a book titled Urban Dynamics. The Urban Dynamics model presented in the book was the first major non-corporate application of system dynamics.[2]

The second major noncorporate application of system dynamics came shortly after the first. In 1970, Jay Forrester was invited by the Club of Rome to a meeting in Bern, Switzerland. The Club of Rome is an organization devoted to solving what its members describe as the "predicament of mankind"—that is, the global crisis that may appear sometime in the future, due to the demands being placed on the Earth's carrying capacity (its sources of renewable and nonrenewable resources and its sinks for the disposal of pollutants) by the world's exponentially growing population. At the Bern meeting, Forrester was asked if system dynamics could be used to address the predicament of mankind. His answer, of course, was that it could. On the plane back from the Bern meeting, Forrester created the first draft of a system dynamics model of the world's socioeconomic system. He called this model WORLD1. Upon his return to the United States, Forrester refined WORLD1 in preparation for a visit to MIT by members of the Club of Rome. Forrester called the refined version of the model WORLD2. Forrester published WORLD2 in a book titled World Dynamics.[2]

Topics in systems dynamics

The elements of system dynamics diagrams are feedback, accumulation of flows into stocks and time delays.

As an illustration of the use of system dynamics, imagine an organisation that plans to introduce an innovative new durable consumer product. The organisation needs to understand the possible market dynamics in order to design marketing and production plans.

Causal loop diagrams

In the system dynamics methodology, a problem or a system (e.g., ecosystem, political system or mechanical system) may be represented as a causal loop diagram.[4] A causal loop diagram is a simple map of a system with all its constituent components and their interactions. By capturing interactions and consequently the feedback loops (see figure below), a causal loop diagram reveals the structure of a system. By understanding the structure of a system, it becomes possible to ascertain a system’s behavior over a certain time period.[5]
The causal loop diagram of the new product introduction may look as follows:
Causal loop diagram of New product adoption model

There are two feedback loops in this diagram. The positive reinforcement (labeled R) loop on the right indicates that the more people have already adopted the new product, the stronger the word-of-mouth impact. There will be more references to the product, more demonstrations, and more reviews. This positive feedback should generate sales that continue to grow.

The second feedback loop on the left is negative reinforcement (or "balancing" and hence labeled B). Clearly, growth cannot continue forever, because as more and more people adopt, there remain fewer and fewer potential adopters.

Both feedback loops act simultaneously, but at different times they may have different strengths. Thus one might expect growing sales in the initial years, and then declining sales in the later years. However, in general a causal loop diagram does not specify the structure of a system sufficiently to permit determination of its behavior from the visual representation alone.[6]

Stock and flow diagrams

Causal loop diagrams aid in visualizing a system’s structure and behavior, and analyzing the system qualitatively. To perform a more detailed quantitative analysis, a causal loop diagram is transformed to a stock and flow diagram. A stock and flow model helps in studying and analyzing the system in a quantitative way; such models are usually built and simulated using computer software.
A stock is the term for any entity that accumulates or depletes over time. A flow is the rate of change in a stock.
A flow is the rate of accumulation of the stock

In our example, there are two stocks: Potential adopters and Adopters. There is one flow: New adopters. For every new adopter, the stock of potential adopters declines by one, and the stock of adopters increases by one.
Stock and flow diagram of New product adoption model

Equations

The real power of system dynamics is utilised through simulation. Although it is possible to perform the modeling in a spreadsheet, there are a variety of software packages that have been optimised for this.

The steps involved in a simulation are:
  • Define the problem boundary
  • Identify the most important stocks and flows that change these stock levels
  • Identify sources of information that impact the flows
  • Identify the main feedback loops
  • Draw a causal loop diagram that links the stocks, flows and sources of information
  • Write the equations that determine the flows
  • Estimate the parameters and initial conditions. These can be estimated using statistical methods, expert opinion, market research data or other relevant sources of information.[7]
  • Simulate the model and analyse results.
In this example, the equations that change the two stocks via the flow are:

\ {\mbox{Potential adopters}}=\int _{{0}}^{{t}}{\mbox{-New adopters }}\,dt
\ {\mbox{Adopters}}=\int _{{0}}^{{t}}{\mbox{New adopters }}\,dt

Equations in discrete time

List of all the equations in discrete time, in their order of execution in each year, for years 1 to 15 :

1)\ {\mbox{Probability that contact has not yet adopted}}={\mbox{Potential adopters}}/({\mbox{Potential adopters }}+{\mbox{ Adopters}})
2)\ {\mbox{Imitators}}=q\cdot {\mbox{Adopters}}\cdot {\mbox{Probability that contact has not yet adopted}}
3)\ {\mbox{Innovators}}=p\cdot {\mbox{Potential adopters}}
4)\ {\mbox{New adopters}}={\mbox{Innovators}}+{\mbox{Imitators}}
{\displaystyle 4.1)\ {\mbox{Potential adopters}}\ -={\mbox{New adopters }}}
{\displaystyle 4.2)\ {\mbox{Adopters}}\ +={\mbox{New adopters }}}
\ p=0.03
\ q=0.4

Dynamic simulation results

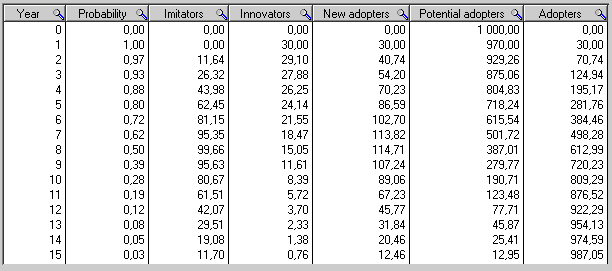
The dynamic simulation results show that the behaviour of the system would be to have growth in adopters that follows a classic s-curve shape.

The increase in adopters is very slow initially, then exponential growth for a period, followed ultimately by saturation.

Dynamic stock and flow diagram of New product adoption
model
 
Stocks and flows values for years = 0 to 15

Equations in continuous time

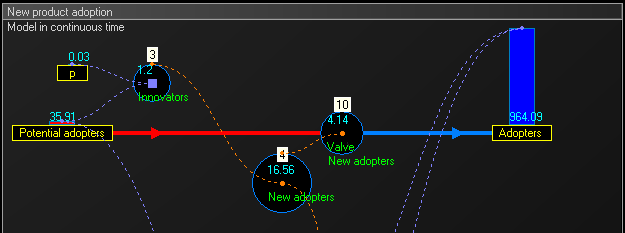
To get intermediate values and better accuracy, the model can run in continuous time: we multiply the number of units of time and we proportionally divide values that change stock levels. In this example we multiply the 15 years by 4 to obtain 60 trimesters, and we divide the value of the flow by 4.
Dividing the value is the simplest with the Euler method, but other methods could be employed instead, such as Runge–Kutta methods.

List of the equations in continuous time for trimesters = 1 to 60 :
  • They are the same equations as in the section Equation in discrete time above, except equations 4.1 and 4.2 replaced by following :
10)\ {\mbox{Valve New adopters}}\ ={\mbox{New adopters}}\cdot TimeStep
10.1)\ {\mbox{Potential adopters}}\ -={\mbox{Valve New adopters}}
10.2)\ {\mbox{Adopters}}\ +={\mbox{Valve New adopters }}
\ TimeStep=1/4
  • In the below stock and flow diagram, the intermediate flow 'Valve New adopters' calculates the equation :
\ {\mbox{Valve New adopters}}\ ={\mbox{New adopters }}\cdot TimeStep
Dynamic stock and flow diagram of New product adoption 
model in continuous time

Application

System dynamics has found application in a wide range of areas, for example population, ecological and economic systems, which usually interact strongly with each other.

System dynamics have various "back of the envelope" management applications. They are a potent tool to:
  • Teach system thinking reflexes to persons being coached
  • Analyze and compare assumptions and mental models about the way things work
  • Gain qualitative insight into the workings of a system or the consequences of a decision
  • Recognize archetypes of dysfunctional systems in everyday practice
Computer software is used to simulate a system dynamics model of the situation being studied. Running "what if" simulations to test certain policies on such a model can greatly aid in understanding how the system changes over time. System dynamics is very similar to systems thinking and constructs the same causal loop diagrams of systems with feedback. However, system dynamics typically goes further and utilises simulation to study the behaviour of systems and the impact of alternative policies.[8]

System dynamics has been used to investigate resource dependencies, and resulting problems, in product development.[9][10]

A system dynamics approach to macroeconomics, known as Minsky, has been developed by the economist Steve Keen.[11] This has been used to successfully model world economic behaviour from the apparent stability of the Great Moderation to the sudden unexpected Financial crisis of 2007–08.

Example

Causal loop diagram of a model examining the growth or
decline of a life insurance company.[12]

The figure above is a causal loop diagram of a system dynamics model created to examine forces that may be responsible for the growth or decline of life insurance companies in the United Kingdom. A number of this figure's features are worth mentioning. The first is that the model's negative feedback loops are identified by C's, which stand for Counteracting loops. The second is that double slashes are used to indicate places where there is a significant delay between causes (i.e., variables at the tails of arrows) and effects (i.e., variables at the heads of arrows). This is a common causal loop diagramming convention in system dynamics. Third, is that thicker lines are used to identify the feedback loops and links that author wishes the audience to focus on. This is also a common system dynamics diagramming convention. Last, it is clear that a decision maker would find it impossible to think through the dynamic behavior inherent in the model, from inspection of the figure alone.

Volatility, uncertainty, complexity and ambiguity

From Wikipedia, the free encyclopedia
 
VUCA is an acronym used to describe or to reflect on the volatility, uncertainty, complexity and ambiguity of general conditions and situations. The U.S. Army War College introduced the concept of VUCA to describe the more volatile, uncertain, complex and ambiguous multilateral world perceived as resulting from the end of the Cold War in the early 1990s. The common usage of the term "VUCA" began in the 1990s and derives from military vocabulary. It has subsequently taken root in emerging ideas in strategic leadership that apply in a wide range of organizations, from for-profit corporations to education.

Meaning

The deeper meaning of each element of VUCA serves to enhance the strategic significance of VUCA foresight and insight as well as the behaviour of groups and individuals in organizations.[4] It discusses systemic failures[5] and behavioural failures,[5] which are characteristic of organisational failure.
  • V = Volatility. The nature and dynamics of change, and the nature and speed of change forces and change catalysts.
  • U = Uncertainty. The lack of predictability, the prospects for surprise, and the sense of awareness and understanding of issues and events.
  • C = Complexity. The multiplex of forces, the confounding of issues, no cause-and-effect chain and confusion that surrounds organization.
  • A = Ambiguity. The haziness of reality, the potential for misreads, and the mixed meanings of conditions; cause-and-effect confusion.
These elements present the context in which organizations view their current and future state. They present boundaries for planning and policy management. They come together in ways that either confound decisions or sharpen the capacity to look ahead, plan ahead and move ahead. VUCA sets the stage for managing and leading.

The particular meaning and relevance of VUCA often relates to how people view the conditions under which they make decisions, plan forward, manage risks, foster change and solve problems. In general, the premises of VUCA tend to shape an organization's capacity to:
  1. Anticipate the Issues that Shape
  2. Understand the Consequences of Issues and Actions
  3. Appreciate the Interdependence of Variables
  4. Prepare for Alternative Realities and Challenges
  5. Interpret and Address Relevant Opportunities
For most contemporary organizations – business, the military, education, government and others – VUCA is a practical code for awareness and readiness. Beyond the simple acronym is a body of knowledge that deals with learning models for VUCA preparedness, anticipation, evolution and intervention.[6]

Themes

Failure in itself is not a catastrophe, but failure to learn from failure definitely is. It is not enough to train leaders in core competencies without identifying the key factors that inhibit their using the resilience and adaptability that are vital in order to distinguish potential leaders from mediocre managers. Anticipating change as a result of VUCA is one outcome of resilient leadership.[5] The capacity of individuals and organizations to deal with VUCA can be measured with a number of engagement themes:
  1. Knowledge Management and Sense-Making
  2. Planning and Readiness Considerations
  3. Process Management and Resource Systems
  4. Functional Responsiveness and Impact Models
  5. Recovery Systems and Forward Practices
  6. Systemic failures[5]
  7. Behavioural failures[5]
At some level, the capacity for VUCA management and leadership hinges on enterprise value systems, assumptions and natural goals. A "prepared and resolved" enterprise[2] is engaged with a strategic agenda that is aware of and empowered by VUCA forces.

The capacity for VUCA leadership in strategic and operating terms depends on a well-developed mindset for gauging the technical, social, political, market and economic realities of the environment in which people work. Working with deeper smarts about the elements of VUCA may be a driver for survival and sustainability in an otherwise complicated world.[7]

Psychometrics[8] which measure fluid intelligence by tracking information processing when faced with unfamiliar, dynamic and vague data can predict cognitive performance in VUCA environments

Social Categorization

Volatility

Volatility is the "V" component of VUCA. This refers to the different situational social-categorization of people due to specific traits or reactions that stand out during that particular situation. When people react/act based on a specific situation, there is a possibility that the public categorizes them into a different group than they were in a previous situation. These people might respond differently to individual situations due to social or environmental cues. The idea that situational occurrences cause certain social categorization is known as volatility and is one of the main aspects of the self-categorization theory.[9]

Sociologists use volatility to understand better how stereotypes and social-categorization is impacted based on the situation at hand as well as any outside forces that may lead people to perceive others differently. Volatility is the changing dynamic of social-categorization in a set of environmental situations. The dynamic can change due to any shift in a situation, whether it is social, technical, biological or anything of the like. Studies have been conducted, but it has proven difficult to find the specific component that causes the change in situational social-categorization.[10]

There are two separate components that connect people to social identities. The first social cue is normative fit. This describes the degree that a person relates to the stereotypes and norms that others associate with their specific identity. For example, when a Hispanic woman is cleaning the house, most of the time, people connect gender stereotypes with this situation, while her ethnicity isn’t concerned, but when this same woman eats an enchilada, ethnicity stereotypes surface while her gender isn’t concerned.[9] The second social cue is comparative fit. This is when a specific characteristic or trait of a person is prominent in certain situations when compared to other people. For example, as mentioned by Bodenhausen and Peery, when there is one woman in a room full of men.[9] She sticks out because she is the only one of her gender compared to many others of the opposite gender. However, all of the men are clumped together because they don't have any specific traits that stands out among the rest of them. Comparative fit shows that people categorize others based on the comparative social context. In a certain situation, specific characteristics are made obvious due to the fact that others around that individual don’t possess that characteristic. However, in other situations, this characteristic may be the norm and wouldn’t be a key characteristic in the categorization process.[9]

People can also be less criticizing of the same person during different situations. For example, when looking at an African American man on the street of a low-income neighborhood and when looking at the same man inside a school of a high-income neighborhood, people will be less judgmental when seeing him in the school. Nothing else has changed about this man, other than his location.[9] When individuals are spotted in certain social contexts, the basic-level categories are forgotten and the more partial categories are brought to light. This really helps to describe the problems of situational social-categorization and how stereotypes can shift the perspectives of those around an individual.[9]

Uncertainty

Uncertainty in the VUCA framework is almost just as it sounds: when the availability or predictability of information in events is unknown. Uncertainty often occurs in volatile environments that are complex in structure involving unanticipated interactions that are significant in uncertainty. Uncertainty may occur in the intention to imply causation or correlation between the events of a social perceiver and a target. Situations where there is either a lack of information to prove why a perception is in occurrence or informational availability but lack of causation are where uncertainty is salient [9].

The uncertainty component of the framework serves as a grey area and is compensated by the use of social categorization and/or stereotypes. Social categorization can be described as a collection of people that have no interaction but tend to share similar characteristics with one another. People have a tendency to engage in social categorization, especially when there is a lack of information surrounding the event. Literature suggests that there are default categories that tend to be assumed in the absence of any clear data when referring to someone's gender or race in the essence of a discussion [9].

Often times individuals associate the use of general references (e.g. people, they, them, a group) with the male gender, meaning people = male. This instance often occurs when there is not enough information to clearly distinguish someone's gender. For example, when discussing a written piece of information most people will assume the author is a male. If an author’s name is not available (lack of information) it is difficult to determine the gender of the author through the context of whatever was written. People will automatically label the author as a male without having any prior basis of gender, placing the author in a social category. This social categorization happens in this example, but people will also assume someone is a male if the gender is not known in many other situations as well.

Social categorization occurs in the realm of not only gender but also race. Default assumptions can be made, like in gender, to the race of an individual or a group of people based on prior known stereotypes. For example, race-occupation combinations such as a basketball player or a golf player will receive race assumptions. Without any information of the individual's race, a basketball player will be assumed to be black and a golf player will be assumed to be white. This is based upon stereotypes because of the majority of race in each sport tend to be dominated by a single race, but in reality, there are other races within each sport [9].

Complexity

Complexity is the “C” component of VUCA, that refers to the interconnectivity and interdependence of multiple components in a system. When conducting research, complexity is a component that scholars have to keep in mind. The results of a deliberately controlled environment are unexpected because of the non-linear interaction and interdependencies within different groups and categories.[10]

In a sociological aspect, the VUCA framework is utilized in research to understand social perception in the real world and how that plays into social categorization as well as stereotypes. Galen V Bodenhausen and Destiny Peery’s article Social Categorization and Stereotyping In vivo: The VUCA Challenge, focused on researching how social categories impacted the process of social cognition and perception.[9] The strategy used to conduct the research is to manipulate or isolate a single identity of a target while keeping all other identities constant. This method creates clear results of how a specific identity in a social category can change one’s perception of other identities, thus creating stereotypes.[9]

There are problems with categorizing an individual’s social identity due to the complexity of an individual's background. This research fails to address the complexity of the real-world and the results from this highlighted an even great picture about social categorization and stereotyping.[9] Complexity adds many layers of different components to an individual's identity and creates challenges for sociologists trying to examine social categories. [10] In the real world, people are far more complex compared to a modified social environment. Individuals identify with more than one social category, which opens the door to a deeper discovery about stereotyping. Results from research conducted by Bodenhausen reveals that there are certain identities that are more dominant than others.[9] Perceivers who recognize these specific identities latch on to it and associate their preconceived notion of such identity and make initial assumptions about the individuals and hence stereotypes are created.

On the other hand, perceivers who share some of the identities with the target become more open-minded. They also take into consideration more than one social identity at the same time and this is also known as cross-categorization effects.[11] Some social categories are embedded in a larger categorical structure, which makes that subcategory even more crucial and outstanding to perceivers. Research on cross-categorization reveals that different types of categories can be activated in the mind of the social perceiver, which causes both positive and negative effects. A positive outcome is that perceivers are more open-minded despite other social stereotypes. They have more motivation to think deeply about the target and see past the most dominant social category. Bodenhausen also acknowledges that cross-categorization effects lead to social invisibility[9]. Some types of cross-over identities may lessen the noticeability of other identities, which may cause targets to be subjected to “intersectional invisibility,” [12] where neither social identities have a distinct component and are overlooked.

Ambiguity

Ambiguity is the “A” component of VUCA. This refers to when the general meaning of something is unclear even when an appropriate amount of information is provided. Many get confused about the meaning of ambiguity. It is similar to the idea of uncertainty but they have different factors. Uncertainty is when relevant information is unavailable and unknown, and ambiguity where relevant information is available but the overall meaning is still unknown. Both uncertainty and ambiguity exist in our culture today. Sociologists use ambiguity to determine how and why an answer has been developed. Sociologists focus on details such as if there was enough information present, and did the subject have the full amount of knowledge necessary to make a decision. and why did he/she come to their specific answer.[9].

Ambiguity leads to people assuming an answer, and many times this leads assuming ones race, gender, and can even lead to class stereotypes. If a person has some information but still doesn’t have the overall answer, the person starts to assume his/her own answer based on the relevant information he/she already possesses. For example, as mentioned by Bodenhausen we may occasionally encounter people who are sufficiently androgynous to make it difficult to ascertain their gender, and at least one study suggests that with brief exposure, androgynous individuals can sometimes be miscategorized on the basis of gender-atypical features (very long hair, for a man, or very short hair, for a woman. Overall, ambiguity leads to the categorization of many. For example, it may lead to assuming ones sexual orientation. Unless a person is open about their own sexual orientation, people will automatically assume that they are heterosexual. But if a man possesses feminine qualities or a female possesses masculine qualities then they might be portrayed as either gay or lesbian. Ambiguity leads to the categorization of people without further important details that could lead to untrue conclusions.[9].

Sociologists believe that ambiguity can lead to race stereotypes and discrimination. In a study done in South Africa by three sociologists, they had white citizens of South Africa look at pictures of racially mixed faces and they had to decide whether these faces were European or African. Because these test subjects were all white they had a hard problem defining these mixed race faces as European and deemed them all to be African. The reason they did this is because of ambiguity. The information the was available was the skin tone of the people in the pictures and the facial qualities they possessed, with this information the test subjects had all of that information available but still did not no the answer for sure. They overall assumed because they did not look exactly like them, then they could not be European.

Complex system

From Wikipedia, the free encyclopedia

A complex system is a system composed of many components which may interact with each other. In many cases it is useful to represent such a system as a network where the nodes represent the components and the links their interactions. Examples of complex systems are Earth's global climate, organisms, the human brain, social and economic organizations (like cities), an ecosystem, a living cell, and ultimately the entire universe.

Complex systems are systems whose behavior is intrinsically difficult to model due to the dependencies, relationships, or other types of interactions between their parts or between a given system and its environment. Systems that are "complex" have distinct properties that arise from these relationships, such as nonlinearity, emergence, spontaneous order, adaptation, and feedback loops, among others. Because such systems appear in a wide variety of fields, the commonalities among them have become the topic of their own independent area of research.

Overview

The term complex systems often refers to the study of complex systems, which is an approach to science that investigates how relationships between a system's parts give rise to its collective behaviors and how the system interacts and forms relationships with its environment.[1] The study of complex systems regards collective, or system-wide, behaviors as the fundamental object of study; for this reason, complex systems can be understood as an alternative paradigm to reductionism, which attempts to explain systems in terms of their constituent parts and the individual interactions between them.

As an interdisciplinary domain, complex systems draws contributions from many different fields, such as the study of self-organization from physics, that of spontaneous order from the social sciences, chaos from mathematics, adaptation from biology, and many others. Complex systems is therefore often used as a broad term encompassing a research approach to problems in many diverse disciplines, including statistical physics, information theory, nonlinear dynamics, anthropology, computer science, meteorology, sociology, economics, psychology, and biology.

Key concepts

Systems


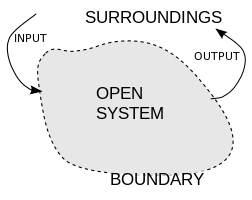
Open systems have input and output flows, representing exchanges of matter, energy or information with their surroundings.

Complex systems is chiefly concerned with the behaviors and properties of systems. A system, broadly defined, is a set of entities that, through their interactions, relationships, or dependencies, form a unified whole. It is always defined in terms of its boundary, which determines the entities that are or are not part of the system. Entities lying outside the system then become part of the system's environment.

A system can exhibit properties that produce behaviors which are distinct from the properties and behaviors of its parts; these system-wide or global properties and behaviors are characteristics of how the system interacts with or appears to its environment, or of how its parts behave (say, in response to external stimuli) by virtue of being within the system. The notion of behavior implies that the study of systems is also concerned with processes that take place over time (or, in mathematics, some other phase space parameterization). Because of their broad, interdisciplinary applicability, systems concepts play a central role in complex systems.

As a field of study, complex systems is a subset of systems theory. General systems theory focuses similarly on the collective behaviors of interacting entities, but it studies a much broader class of systems, including non-complex systems where traditional reductionist approaches may remain viable. Indeed, systems theory seeks to explore and describe all classes of systems, and the invention of categories that are useful to researchers across widely varying fields is one of systems theory's main objectives.

As it relates to complex systems, systems theory contributes an emphasis on the way relationships and dependencies between a system's parts can determine system-wide properties. It also contributes the interdisciplinary perspective of the study of complex systems: the notion that shared properties link systems across disciplines, justifying the pursuit of modeling approaches applicable to complex systems wherever they appear. Specific concepts important to complex systems, such as emergence, feedback loops, and adaptation, also originate in systems theory.

Complexity

Systems exhibit complexity when difficulties with modeling them are endemic. This means their behaviors cannot be understood apart from the very properties that make them difficult to model, and they are governed entirely, or almost entirely, by the behaviors those properties produce. Any modeling approach that ignores such difficulties or characterizes them as noise, then, will necessarily produce models that are neither accurate nor useful. As yet no fully general theory of complex systems has emerged for addressing these problems, so researchers must solve them in domain-specific contexts. Researchers in complex systems address these problems by viewing the chief task of modeling to be capturing, rather than reducing, the complexity of their respective systems of interest.

While no generally accepted exact definition of complexity exists yet, there are many archetypal examples of complexity. Systems can be complex if, for instance, they have chaotic behavior (behavior that exhibits extreme sensitivity to initial conditions), or if they have emergent properties (properties that are not apparent from their components in isolation but which result from the relationships and dependencies they form when placed together in a system), or if they are computationally intractable to model (if they depend on a number of parameters that grows too rapidly with respect to the size of the system).

Networks

The interacting components of a complex system form a network, which is a collection of discrete objects and relationships between them, usually depicted as a graph of vertices connected by edges. Networks can describe the relationships between individuals within an organization, between logic gates in a circuit, between genes in gene regulatory networks, or between any other set of related entities.

Networks often describe the sources of complexity in complex systems. Studying complex systems as networks therefore enables many useful applications of graph theory and network science. Some complex systems, for example, are also complex networks, which have properties such as phase transitions and power-law degree distributions that readily lend themselves to emergent or chaotic behavior. The fact that the number of edges in a complete graph grows quadratically in the number of vertices sheds additional light on the source of complexity in large networks: as a network grows, the number of relationships between entities quickly dwarfs the number of entities in the network.

Nonlinearity


A sample solution in the Lorenz attractor when ρ = 28, σ = 10, and β = 8/3

Complex systems often have nonlinear behavior, meaning they may respond in different ways to the same input depending on their state or context. In mathematics and physics, nonlinearity describes systems in which a change in the size of the input does not produce a proportional change in the size of the output. For a given change in input, such systems may yield significantly greater than or less than proportional changes in output, or even no output at all, depending on the current state of the system or its parameter values.

Of particular interest to complex systems are nonlinear dynamical systems, which are systems of differential equations that have one or more nonlinear terms. Some nonlinear dynamical systems, such as the Lorenz system, can produce a mathematical phenomenon known as chaos. Chaos as it applies to complex systems refers to the sensitive dependence on initial conditions, or "butterfly effect," that a complex system can exhibit. In such a system, small changes to initial conditions can lead to dramatically different outcomes. Chaotic behavior can therefore be extremely hard to model numerically, because small rounding errors at an intermediate stage of computation can cause the model to generate completely inaccurate output. Furthermore, if a complex system returns to a state similar to one it held previously, it may behave completely differently in response to exactly the same stimuli, so chaos also poses challenges for extrapolating from past experience.

Emergence


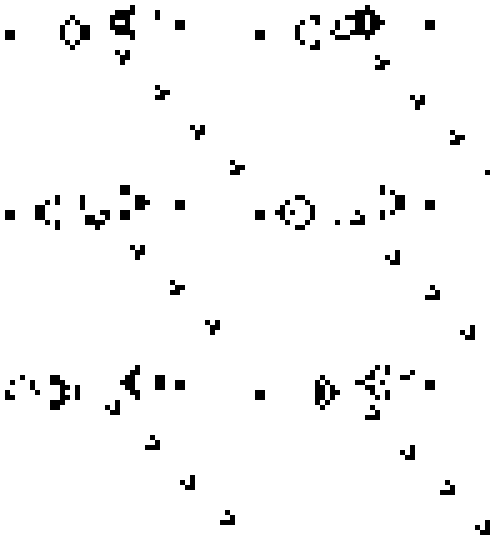
Gosper's Glider Gun creating "gliders" in the cellular automaton Conway's Game of Life[2]

Another common feature of complex systems is the presence of emergent behaviors and properties: these are traits of a system which are not apparent from its components in isolation but which result from the interactions, dependencies, or relationships they form when placed together in a system.  Emergence broadly describes the appearance of such behaviors and properties, and has applications to systems studied in both the social and physical sciences. While emergence is often used to refer only to the appearance of unplanned organized behavior in a complex system, emergence can also refer to the breakdown of organization; it describes any phenomena which are difficult or even impossible to predict from the smaller entities that make up the system.

One example of complex system whose emergent properties have been studied extensively is cellular automata. In a cellular automaton, a grid of cells, each having one of finitely many states, evolves over time according to a simple set of rules. These rules guide the "interactions" of each cell with its neighbors. Although the rules are only defined locally, they have been shown capable of producing globally interesting behavior, for example in Conway's Game of Life.

Spontaneous order and self-organization

When emergence describes the appearance of unplanned order, it is spontaneous order (in the social sciences) or self-organization (in physical sciences). Spontaneous order can be seen in herd behavior, whereby a group of individuals coordinates their actions without centralized planning. Self-organization can be seen in the global symmetry of certain crystals, for instance the apparent radial symmetry of snowflakes, which arises from purely local attractive and repulsive forces both between water molecules and between water molecules and their surrounding environment.

Adaptation

Complex adaptive systems are special cases of complex systems that are adaptive in that they have the capacity to change and learn from experience. Examples of complex adaptive systems include the stock market, social insect and ant colonies, the biosphere and the ecosystem, the brain and the immune system, the cell and the developing embryo, manufacturing businesses and any human social group-based endeavor in a cultural and social system such as political parties or communities.

Features

Complex systems may have the following features:[3]
Cascading failures
Due to the strong coupling between components in complex systems, a failure in one or more components can lead to cascading failures which may have catastrophic consequences on the functioning of the system.[4] Localized attack may lead to cascading failures in spatial networks.[5]
Complex systems may be open
Complex systems are usually open systems — that is, they exist in a thermodynamic gradient and dissipate energy. In other words, complex systems are frequently far from energetic equilibrium: but despite this flux, there may be pattern stability, see synergetics.
Complex systems may have a memory
The history of a complex system may be important. Because complex systems are dynamical systems they change over time, and prior states may have an influence on present states. More formally, complex systems often exhibit spontaneous failures and recovery as well as hysteresis.[6] Interacting systems may have complex hysteresis of many transitions.[7]
Complex systems may be nested
The components of a complex system may themselves be complex systems. For example, an economy is made up of organisations, which are made up of people, which are made up of cells - all of which are complex systems.
Dynamic network of multiplicity
As well as coupling rules, the dynamic network of a complex system is important. Small-world or scale-free networks[8][9][10] which have many local interactions and a smaller number of inter-area connections are often employed. Natural complex systems often exhibit such topologies. In the human cortex for example, we see dense local connectivity and a few very long axon projections between regions inside the cortex and to other brain regions.
May produce emergent phenomena
Complex systems may exhibit behaviors that are emergent, which is to say that while the results may be sufficiently determined by the activity of the systems' basic constituents, they may have properties that can only be studied at a higher level. For example, the termites in a mound have physiology, biochemistry and biological development that are at one level of analysis, but their social behavior and mound building is a property that emerges from the collection of termites and needs to be analysed at a different level.
Relationships are non-linear
In practical terms, this means a small perturbation may cause a large effect (see butterfly effect), a proportional effect, or even no effect at all. In linear systems, effect is always directly proportional to cause. See nonlinearity.
Relationships contain feedback loops
Both negative (damping) and positive (amplifying) feedback are always found in complex systems. The effects of an element's behaviour are fed back to in such a way that the element itself is altered.

History

 http://www.art-sciencefactory.com/complexity-map_feb09.html
A perspective on the development of complexity science: http://www.art-sciencefactory.com/complexity-map_feb09.html

Although it is arguable that humans have been studying complex systems for thousands of years, the modern scientific study of complex systems is relatively young in comparison to established fields of science such as physics and chemistry. The history of the scientific study of these systems follows several different research trends.

In the area of mathematics, arguably the largest contribution to the study of complex systems was the discovery of chaos in deterministic systems, a feature of certain dynamical systems that is strongly related to nonlinearity.[11] The study of neural networks was also integral in advancing the mathematics needed to study complex systems.

The notion of self-organizing systems is tied with work in nonequilibrium thermodynamics, including that pioneered by chemist and Nobel laureate Ilya Prigogine in his study of dissipative structures. Even older is the work by Hartree-Fock c.s. on the quantum-chemistry equations and later calculations of the structure of molecules which can be regarded as one of the earliest examples of emergence and emergent wholes in science.

The earliest precursor to modern complex systems theory can be found in the classical political economy of the Scottish Enlightenment, later developed by the Austrian school of economics, which argues that order in market systems is spontaneous (or emergent) in that it is the result of human action, but not the execution of any human design.[12][13]

Upon this the Austrian school developed from the 19th to the early 20th century the economic calculation problem, along with the concept of dispersed knowledge, which were to fuel debates against the then-dominant Keynesian economics. This debate would notably lead economists, politicians and other parties to explore the question of computational complexity.

A pioneer in the field, and inspired by Karl Popper's and Warren Weaver's works, Nobel prize economist and philosopher Friedrich Hayek dedicated much of his work, from early to the late 20th century, to the study of complex phenomena,[14] not constraining his work to human economies but venturing into other fields such as psychology,[15] biology and cybernetics. Gregory Bateson played a key role in establishing the connection between anthropology and systems theory; he recognized that the interactive parts of cultures function much like ecosystems.

While the explicit study of complex systems dates at least to the 1970s,[16] the first research institute focused on complex systems, the Santa Fe Institute, was founded in 1984.[17][18] Early Santa Fe Institute participants included physics Nobel laureates Murray Gell-Mann and Philip Anderson, economics Nobel laureate Kenneth Arrow, and Manhattan Project scientists George Cowan and Herb Anderson.[19] Today, there are over 50 institutes and research centers focusing on complex systems.

Applications

Complexity in practice

The traditional approach to dealing with complexity is to reduce or constrain it. Typically, this involves compartmentalisation: dividing a large system into separate parts. Organizations, for instance, divide their work into departments that each deal with separate issues. Engineering systems are often designed using modular components. However, modular designs become susceptible to failure when issues arise that bridge the divisions.

Complexity management

As projects and acquisitions become increasingly complex, companies and governments are challenged to find effective ways to manage mega-acquisitions such as the Army Future Combat Systems. Acquisitions such as the FCS rely on a web of interrelated parts which interact unpredictably. As acquisitions become more network-centric and complex, businesses will be forced to find ways to manage complexity while governments will be challenged to provide effective governance to ensure flexibility and resiliency.

Complexity economics

Over the last decades, within the emerging field of complexity economics new predictive tools have been developed to explain economic growth. Such is the case with the models built by the Santa Fe Institute in 1989 and the more recent economic complexity index (ECI), introduced by the MIT physicist Cesar A. Hidalgo and the Harvard economist Ricardo Hausmann. Based on the ECI, Hausmann, Hidalgo and their team of The Observatory of Economic Complexity have produced GDP forecasts for the year 2020.

Complexity and education

Focusing on issues of student persistence with their studies, Forsman, Moll and Linder explore the "viability of using complexity science as a frame to extend methodological applications for physics education research", finding that "framing a social network analysis within a complexity science perspective offers a new and powerful applicability across a broad range of PER topics".[21]

Complexity and modeling

One of Friedrich Hayek's main contributions to early complexity theory is his distinction between the human capacity to predict the behaviour of simple systems and its capacity to predict the behaviour of complex systems through modeling. He believed that economics and the sciences of complex phenomena in general, which in his view included biology, psychology, and so on, could not be modeled after the sciences that deal with essentially simple phenomena like physics.[22] Hayek would notably explain that complex phenomena, through modeling, can only allow pattern predictions, compared with the precise predictions that can be made out of non-complex phenomena.[23]

Complexity and chaos theory

Complexity theory is rooted in chaos theory, which in turn has its origins more than a century ago in the work of the French mathematician Henri Poincaré. Chaos is sometimes viewed as extremely complicated information, rather than as an absence of order.[24] Chaotic systems remain deterministic, though their long-term behavior can be difficult to predict with any accuracy. With perfect knowledge of the initial conditions and of the relevant equations describing the chaotic system's behavior, one can theoretically make perfectly accurate predictions about the future of the system, though in practice this is impossible to do with arbitrary accuracy. Ilya Prigogine argued[25] that complexity is non-deterministic, and gives no way whatsoever to precisely predict the future.[26]

The emergence of complexity theory shows a domain between deterministic order and randomness which is complex.[27] This is referred as the "edge of chaos".[28]


A plot of the Lorenz attractor.

When one analyzes complex systems, sensitivity to initial conditions, for example, is not an issue as important as it is within chaos theory, in which it prevails. As stated by Colander,[29] the study of complexity is the opposite of the study of chaos. Complexity is about how a huge number of extremely complicated and dynamic sets of relationships can generate some simple behavioral patterns, whereas chaotic behavior, in the sense of deterministic chaos, is the result of a relatively small number of non-linear interactions.[27]

Therefore, the main difference between chaotic systems and complex systems is their history.[30] Chaotic systems do not rely on their history as complex ones do. Chaotic behaviour pushes a system in equilibrium into chaotic order, which means, in other words, out of what we traditionally define as 'order'.[clarification needed] On the other hand, complex systems evolve far from equilibrium at the edge of chaos. They evolve at a critical state built up by a history of irreversible and unexpected events, which physicist Murray Gell-Mann called "an accumulation of frozen accidents".[31] In a sense chaotic systems can be regarded as a subset of complex systems distinguished precisely by this absence of historical dependence. Many real complex systems are, in practice and over long but finite time periods, robust. However, they do possess the potential for radical qualitative change of kind whilst retaining systemic integrity. Metamorphosis serves as perhaps more than a metaphor for such transformations.

Complexity and network science

A complex system is usually composed of many components and their interactions. Such a system can be represented by a network where nodes represent the components and links represent their interactions.[10][32] [33][34] for example, the INTERNET can be represented as a network composed of nodes (computers) and links (direct connections between computers). Its resilience to failures was studied using percolation theory in.[35] Other examples are social networks, airline networks,[36] biological networks and climate networks.[37] Networks can also fail and recover spontaneously. For modeling this phenomenon see Majdandzik et al.[6] Interacting complex systems can be modeled as networks of networks. For their breakdown and recovery properties see Gao et al.[38] [7] Traffic in a city can be represented as a network. The weighted links represent  the velocity between two junctions (nodes). This approach was found useful to characterize the global traffic efficiency in  a city.[39]

General form of complexity computation

The computational law of reachable optimality[40] is established as a general form of computation for ordered systems and it reveals complexity computation is a compound computation of optimal choice and optimality driven reaching pattern overtime underlying a specific and any experience path of ordered system within the general limitation of system integrity.

The computational law of reachable optimality has four key components as described below.

1. Reachability of Optimality: Any intended optimality shall be reachable. Unreachable optimality has no meaning for a member in the ordered system and even for the ordered system itself.

2. Prevailing and Consistency: Maximizing reachability to explore best available optimality is the prevailing computation logic for all members in the ordered system and is accommodated by the ordered system.

3. Conditionality: Realizable tradeoff between reachability and optimality depends primarily upon the initial bet capacity and how the bet capacity evolves along with the payoff table update path triggered by bet behavior and empowered by the underlying law of reward and punishment. Precisely, it is a sequence of conditional events where the next event happens upon reached status quo from experience path.

4. Robustness: The more challenge a reachable optimality can accommodate, the more robust it is in term of path integrity.

There are also four computation features in the law of reachable optimality.

1. Optimal Choice: Computation in realizing Optimal Choice can be very simple or very complex. A simple rule in Optimal Choice is to accept whatever is reached, Reward As You Go (RAYG). A Reachable Optimality computation reduces into optimizing reachability when RAYG is adopted. The Optimal Choice computation can be more complex when multiple NE strategies present in a reached game.

2. Initial Status: Computation is assumed to start at an interested beginning even the absolute beginning of an ordered system in nature may not and need not present. An assumed neutral Initial Status facilitates an artificial or a simulating computation and is not expected to change the prevalence of any findings.

3. Territory: An ordered system shall have a territory where the universal computation sponsored by the system will produce an optimal solution still within the territory.

4. Reaching Pattern: The forms of Reaching Pattern in the computation space, or the Optimality Driven Reaching Pattern in the computation space, primarily depend upon the nature and dimensions of measure space underlying a computation space and the law of punishment and reward underlying the realized experience path of reaching. There are five basic forms of experience path we are interested in, persistently positive reinforcement experience path, persistently negative reinforcement experience path, mixed persistent pattern experience path, decaying scale experience path and selection experience path.

The compound computation in selection experience path includes current and lagging interaction, dynamic topological transformation and implies both invariance and variance characteristics in an ordered system's experience path.

In addition, the computation law of reachable optimality gives out the boundary between complexity model, chaotic model and determination model. When RAYG is the Optimal Choice computation, and the reaching pattern is a persistently positive experience path, persistently negative experience path, or mixed persistent pattern experience path, the underlying computation shall be a simple system computation adopting determination rules. If the reaching pattern has no persistent pattern experienced in RAYG regime, the underlying computation hints there is a chaotic system. When the optimal choice computation involves non-RAYG computation, it's a complexity computation driving the compound effect.

Introduction to entropy

From Wikipedia, the free encyclopedia https://en.wikipedia.org/wiki/Introduct...