Search This Blog

Sunday, March 7, 2021

Endangered species

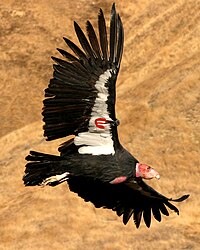
The California condor is an endangered species. Note the wing tags used for population monitoring.

An endangered species is a species that is very likely to become extinct in the near future, either worldwide or in a particular political jurisdiction. Endangered species may be at risk due to factors such as habitat loss, poaching and invasive species. The International Union for Conservation of Nature (IUCN) Red List lists the global conservation status of many species, and various other agencies assess the status of species within particular areas. Many nations have laws that protect conservation-reliant species which, for example, forbid hunting, restrict land development, or create protected areas. Some endangered species are the target of extensive conservation efforts such as captive breeding and habitat restoration.

Conservation status

Photo of Pusa hispida saimensis, also known as Saimaa Ringed Seal, from 1956. Living only in Lake Saimaa, Finland, Saimaa Ringed Seals are among the most endangered seals in the world, having a total population of only about 400 individuals.

The conservation status of a species indicates the likelihood that it will become extinct. Multiple factors are considered when assessing the status of a species; e.g., such statistics as the number remaining, the overall increase or decrease in the population over time, breeding success rates, or known threats. The IUCN Red List of Threatened Species is the best-known worldwide conservation status listing and ranking system.

Over 50% of the world's species are estimated to be at risk of extinction. Internationally, 195 countries have signed an accord to create Biodiversity Action Plans that will protect endangered and other threatened species. In the United States, such plans are usually called Species Recovery Plans.

IUCN Red List

The Siberian tiger is an Endangered (EN) tiger subspecies. Three tiger subspecies are already extinct.
 
Blue-throated macaw, an endangered species
 
Brown spider monkey, an endangered species
 
Siamese crocodile, an endangered species
 
American burying beetle, an endangered species
 
Kemp's ridley sea turtle, an endangered species
 
Mexican Wolf, the most endangered subspecies of the North American Grey Wolf. Approximately 143 are living wild.

Though labeled a list, the IUCN Red List is a system of assessing the global conservation status of species that includes "Data Deficient" (DD) species – species for which more data and assessment is required before their situation may be determined – as well species comprehensively assessed by the IUCN's species assessment process. Those species of "Near Threatened" (NT) and "Least Concern" (LC) status have been assessed and found to have relatively robust and healthy populations, though these may be in decline. Unlike their more general use elsewhere, the List uses the terms "endangered species" and "threatened species" with particular meanings: "Endangered" (EN) species lie between "Vulnerable" (VU) and "Critically Endangered" (CR) species. In 2012, the IUCN Red List listed 3,079 animal and 2,655 plant species as endangered (EN) worldwide.

Endangered species in the United States

There is data from the United States that shows a correlation between human populations and threatened and endangered species. Using species data from the Database on the Economics and Management of Endangered Species (DEMES) database and the period that the Endangered Species Act (ESA) has been in existence, 1970 to 1997, a table was created that suggests a positive relationship between human activity and species endangerment.

A proportional symbol map of each state's endangered species count.

Endangered Species Act

"Endangered" in relation to "threatened" under the ESA.

Under the Endangered Species Act of 1973 in the United States, species may be listed as "endangered" or "threatened". The Salt Creek tiger beetle (Cicindela nevadica lincolniana) is an example of an endangered subspecies protected under the ESA. The US Fish and Wildlife Service, as well as the National Marine Fisheries Service are held responsible for classifying and protecting endangered species. Also, they are also responsible for adding a particular species to the list can be a long, controversial process (Wilcove & Master, 2008, p. 414).

Some endangered species laws are controversial. Typical areas of controversy include criteria for placing a species on the endangered species list and rules for removing a species from the list once its population has recovered. Whether restrictions on land development constitute a "taking" of land by the government; the related question of whether private landowners should be compensated for the loss of uses of their areas; and obtaining reasonable exceptions to protection laws. Also lobbying from hunters and various industries like the petroleum industry, construction industry, and logging, has been an obstacle in establishing endangered species laws.

The Bush administration lifted a policy that required federal officials to consult a wildlife expert before taking actions that could damage endangered species. Under the Obama administration, this policy has been reinstated.

Being listed as an endangered species can have negative effect since it could make a species more desirable for collectors and poachers. This effect is potentially reducible, such as in China where commercially farmed turtles may be reducing some of the pressure to poach endangered species.

Another problem with the listing species is its effect of inciting the use of the "shoot, shovel, and shut-up" method of clearing endangered species from an area of land. Some landowners currently may perceive a diminution in value for their land after finding an endangered animal on it. They have allegedly opted to kill and bury the animals or destroy habitat silently. Thus removing the problem from their land, but at the same time further reducing the population of an endangered species. The effectiveness of the Endangered Species Act – which coined the term "endangered species" – has been questioned by business advocacy groups and their publications but is nevertheless widely recognized by wildlife scientists who work with the species as an effective recovery tool. Nineteen species have been delisted and recovered and 93% of listed species in the northeastern United States have a recovering or stable population.

Currently, 1,556 known species in the world have been identified as near extinction or endangered and are under protection by government law. This approximation, however, does not take into consideration the number of species threatened with endangerment that are not included under the protection of such laws like the Endangered Species Act. According to NatureServe's global conservation status, approximately thirteen percent of vertebrates (excluding marine fish), seventeen percent of vascular plants, and six to eighteen percent of fungi are considered imperiled. Thus, in total, between seven and eighteen percent of the United States' known animals, fungi and plants are near extinction. This total is substantially more than the number of species protected in the United States under the Endangered Species Act.

Ever since mankind began hunting to preserve itself, over-hunting and fishing have been a large and dangerous problem. Of all the species who became extinct due to interference from mankind, the dodo, passenger pigeon, great auk, Tasmanian tiger and Steller's sea cow are some of the more well known examples; with the bald eagle, grizzly bear, American bison, Eastern timber wolf and sea turtle having been poached to near-extinction. Many began as food sources seen as necessary for survival but became the target of sport. However, due to major efforts to prevent extinction, the bald eagle, or Haliaeetus leucocephalus is now under the category of Least Concern on the red list. A present-day example of the over-hunting of a species can be seen in the oceans as populations of certain whales have been greatly reduced. Large whales like the blue whale, bowhead whale, finback whale, gray whale, sperm whale, and humpback whale are some of the eight whales which are currently still included on the Endangered Species List. Actions have been taken to attempt a reduction in whaling and increase population sizes. The actions include prohibiting all whaling in United States waters, the formation of the CITES treaty which protects all whales, along with the formation of the International Whaling Commission (IWC). But even though all of these movements have been put in place, countries such as Japan continue to hunt and harvest whales under the claim of "scientific purposes". Over-hunting, climatic change and habitat loss leads in landing species in endangered species list. It could mean that extinction rates could increase to a large extent in the future.

Invasive species

The introduction of non-indigenous species to an area can disrupt the ecosystem to such an extent that native species become endangered. Such introductions may be termed alien or invasive species. In some cases, the invasive species compete with the native species for food or prey on the natives. In other cases, a stable ecological balance may be upset by predation or other causes leading to unexpected species decline. New species may also carry diseases to which the native species have no exposure or resistance.

Conservation

The dhole, Asia's most endangered top predator, is on the edge of extinction.

Captive breeding

Captive breeding is the process of breeding rare or endangered species in human controlled environments with restricted settings, such as wildlife reserves, zoos, and other conservation facilities. Captive breeding is meant to save species from extinction and so stabilise the population of the species that it will not disappear.

This technique has worked for many species for some time, with probably the oldest known such instances of captive mating being attributed to menageries of European and Asian rulers, an example being the Père David's deer. However, captive breeding techniques are usually difficult to implement for such highly mobile species as some migratory birds (e.g. cranes) and fishes (e.g. hilsa). Additionally, if the captive breeding population is too small, then inbreeding may occur due to a reduced gene pool and reduce resistance.

In 1981, the Association of Zoos and Aquariums (AZA) created a Species Survival Plan (SSP) to help preserve specific endangered and threatened species through captive breeding. With over 450 SSP Plans, some endangered species are covered by the AZA with plans to cover population management goals and recommendations for breeding for a diverse and healthy population, created by Taxon Advisory Groups. These programs are commonly created as a last resort effort. SSP Programs regularly participate in species recovery, veterinary care for wildlife disease outbreaks, and some other wildlife conservation efforts. The AZA's Species Survival Plan also has breeding and transfer programs, both within and outside of AZA - certified zoos and aquariums. Some animals that are part of SSP programs are giant pandas, lowland gorillas, and California condors.

Private farming

Black rhino
 
Southern bluefin tuna

Whereas poaching substantially reduces endangered animal populations, legal, for-profit, private farming does the opposite. It has substantially increased the populations of the southern black rhinoceros and southern white rhinoceros. Dr Richard Emslie, a scientific officer at the IUCN, said of such programs, "Effective law enforcement has become much easier now that the animals are largely privately owned... We have been able to bring local communities into conservation programs. There are increasingly strong economic incentives attached to looking after rhinos rather than simply poaching: from Eco-tourism or selling them on for a profit. So many owners are keeping them secure. The private sector has been key to helping our work."

Conservation experts view the effect of China's turtle farming on the wild turtle populations of China and South-Eastern Asia – many of which are endangered – as "poorly understood". Although they commend the gradual replacement of turtles caught wild with farm-raised turtles in the marketplace – the percentage of farm-raised individuals in the "visible" trade grew from around 30% in 2000 to around 70% in 2007 – they worry that many wild animals are caught to provide farmers with breeding stock. The conservation expert Peter Paul van Dijk noted that turtle farmers often believe that animals caught wild are superior breeding stock. Turtle farmers may, therefore, seek and catch the last remaining wild specimens of some endangered turtle species.

In 2009, researchers in Australia managed to coax southern bluefin tuna to breed in landlocked tanks, raising the possibility that fish farming may be able to save the species from overfishing.
 

Stability of the Solar System

From Wikipedia, the free encyclopedia

The stability of the Solar System is a subject of much inquiry in astronomy. Though the planets have been stable when historically observed, and will be in the short term, their weak gravitational effects on one another can add up in unpredictable ways. For this reason (among others) the Solar System is chaotic in the technical sense of mathematical chaos theory, and even the most precise long-term models for the orbital motion of the Solar System are not valid over more than a few tens of millions of years.

The Solar System is stable in human terms, and far beyond, given that it is unlikely any of the planets will collide with each other or be ejected from the system in the next few billion years, and the Earth's orbit will be relatively stable.

Since Newton's law of gravitation (1687), mathematicians and astronomers (such as Pierre-Simon Laplace, Joseph Louis Lagrange, Carl Friedrich Gauss, Henri Poincaré, Andrey Kolmogorov, Vladimir Arnold, and Jürgen Moser) have searched for evidence for the stability of the planetary motions, and this quest led to many mathematical developments, and several successive 'proofs' of stability of the Solar System.

Overview and challenges

The orbits of the planets are open to long-term variations. Modeling the Solar System is a case of the n-body problem of physics, which is generally unsolvable except by numerical simulation.

Resonance

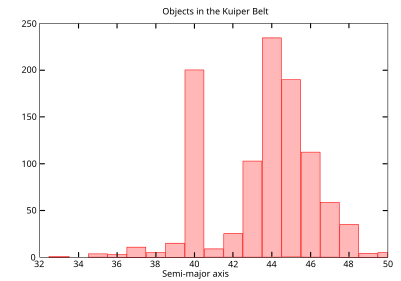
Graph showing the numbers of Kuiper belt objects for a given distance (in AU) from the Sun

Orbital resonance happens when any two periods have a simple numerical ratio. The most fundamental period for an object in the Solar System is its orbital period, and orbital resonances pervade the Solar System. In 1867, the American astronomer Daniel Kirkwood noticed that asteroids in the asteroid belt are not randomly distributed. There were distinct gaps in the belt at locations that corresponded to resonances with Jupiter. For example, there were no asteroids at the 3:1 resonance – a distance of 2.5 AU – or at the 2:1 resonance at 3.3 AU (AU is the astronomical unit, or essentially the distance from the Sun to Earth). These are now known as the Kirkwood gaps. Some asteroids were later discovered to orbit in these gaps, but their orbits are unstable and they will eventually break out of the resonance due to close encounters with a major planet.

Another common form of resonance in the Solar System is spin–orbit resonance, where the period of spin (the time it takes the planet or moon to rotate once about its axis) has a simple numerical relationship with its orbital period. An example is our own Moon, which is in a 1:1 spin–orbit resonance that keeps the far side of the Moon away from the Earth. Mercury is in a 3:2 spin–orbit resonance.

Predictability

The planets' orbits are chaotic over longer timescales, in such a way that the whole Solar System possesses a Lyapunov time in the range of 2–230 million years. In all cases this means that the position of a planet along its orbit ultimately becomes impossible to predict with any certainty (so, for example, the timing of winter and summer become uncertain), but in some cases the orbits themselves may change dramatically. Such chaos manifests most strongly as changes in eccentricity, with some planets' orbits becoming significantly more—or less—elliptical.

In calculation, the unknowns include asteroids, the solar quadrupole moment, mass loss from the Sun through radiation and solar wind, drag of solar wind on planetary magnetospheres, galactic tidal forces, and effects from passing stars.

Scenarios

Neptune–Pluto resonance

The NeptunePluto system lies in a 3:2 orbital resonance. C.J. Cohen and E.C. Hubbard at the Naval Surface Warfare Center Dahlgren Division discovered this in 1965. Although the resonance itself will remain stable in the short term, it becomes impossible to predict the position of Pluto with any degree of accuracy, as the uncertainty in the position grows by a factor e with each Lyapunov time, which for Pluto is 10–20 million years into the future. Thus, on the time scale of hundreds of millions of years Pluto's orbital phase becomes impossible to determine, even if Pluto's orbit appears to be perfectly stable on 10 MYR time scales (Ito and Tanikawa 2002, MNRAS).

Jovian moon resonance

Jupiter's moon Io has an orbital period of 1.769 days, nearly half that of the next satellite Europa (3.551 days). They are in a 2:1 orbit/orbit resonance. This particular resonance has important consequences because Europa's gravity perturbs the orbit of Io. As Io moves closer to Jupiter and then further away in the course of an orbit, it experiences significant tidal stresses resulting in active volcanoes. Europa is also in a 2:1 resonance with the next satellite Ganymede.

Mercury–Jupiter 1:1 perihelion-precession resonance

The planet Mercury is especially susceptible to Jupiter's influence because of a small celestial coincidence: Mercury's perihelion, the point where it gets closest to the Sun, precesses at a rate of about 1.5 degrees every 1000 years, and Jupiter's perihelion precesses only a little slower. At one point, the two may fall into sync, at which time Jupiter's constant gravitational tugs could accumulate and pull Mercury off course with 1–2% probability, 3–4 billion years into the future. This could eject it from the Solar System altogether or send it on a collision course with Venus, the Sun, or Earth.

Asteroid influence

Chaos from geological processes

Another example is Earth's axial tilt which, due to friction raised within Earth's mantle by tidal interactions with the Moon (see below), will be rendered chaotic at some point between 1.5 and 4.5 billion years from now.

External influences

Objects coming from outside the Solar System can also affect it. Though they are not technically part of the solar system for the purposes of studying the system's intrinsic stability, they nevertheless can change the system. Unfortunately predicting the potential influences of these extrasolar objects is even more difficult than predicting the influences of objects within the system simply because of the sheer distances involved. Among the known objects with a potential to significantly impact the Solar System is the star Gliese 710, which is expected to pass near the system in approximately 1.281 million years. Though the star is not expected to substantially affect the orbits of the major planets, it could substantially disrupt the Oort cloud which could cause major comet activity throughout the solar system. There are at least a dozen other stars that have a potential to make a close approach in the next few million years.

Studies

LONGSTOP

Project LONGSTOP (Long-term Gravitational Study of the Outer Planets) was a 1982 international consortium of Solar System dynamicists led by Archie Roy. It involved creation of a model on a supercomputer, integrating the orbits of (only) the outer planets. Its results revealed several curious exchanges of energy between the outer planets, but no signs of gross instability.

Digital Orrery

Another project involved constructing the Digital Orrery by Gerry Sussman and his MIT group in 1988. The group used a supercomputer to integrate the orbits of the outer planets over 845 million years (some 20 per cent of the age of the Solar System). In 1988, Sussman and Wisdom found data using the Orrery which revealed that Pluto's orbit shows signs of chaos, due in part to its peculiar resonance with Neptune.

If Pluto's orbit is chaotic, then technically the whole Solar System is chaotic, because each body, even one as small as Pluto, affects the others to some extent through gravitational interactions.

Laskar #1

In 1989, Jacques Laskar of the Bureau des Longitudes in Paris published the results of his numerical integration of the Solar System over 200 million years. These were not the full equations of motion, but rather averaged equations along the lines of those used by Laplace. Laskar's work showed that the Earth's orbit (as well as the orbits of all the inner planets) is chaotic and that an error as small as 15 metres in measuring the position of the Earth today would make it impossible to predict where the Earth would be in its orbit in just over 100 million years' time.

Laskar and Gastineau

Jacques Laskar and his colleague Mickaël Gastineau in 2008 took a more thorough approach by directly simulating 2 500 possible futures. Each of the 2 500 cases has slightly different initial conditions: Mercury's position varies by about 1 metre between one simulation and the next. In 20 cases, Mercury goes into a dangerous orbit and often ends up colliding with Venus or plunging into the Sun. Moving in such a warped orbit, Mercury's gravity is more likely to shake other planets out of their settled paths: In one simulated case Mercury's perturbations sent Mars heading towards Earth.

Batygin and Laughlin

Independently of Laskar and Gastineau, Batygin and Laughlin were also directly simulating the Solar System 20 billion (2×10¹⁰) years into the future. Their results reached the same basic conclusions of Laskar and Gastineau while additionally providing a lower bound of a billion (1×10⁹) years on the dynamical lifespan of the Solar System.

Brown and Rein

In 2020, Garett Brown and Hanno Rein of the University of Toronto published the results of their numerical integration of the Solar System over 5 billion years. Their work showed that the Mercury's orbit is highly chaotic and that an error as small as 0.38 millimeters in measuring the position of the Mercury today would make it impossible to predict eccentricity of its orbit in just over 200 million years' time.

Greenhouse and icehouse Earth

From Wikipedia, the free encyclopedia
 
Timeline of the five known great glaciations, shown in blue. The periods in between depict greenhouse conditions.

Throughout the history of the Earth, the planet's climate has been fluctuating between two dominant climate states: the greenhouse Earth and the icehouse Earth. These two climate states last for millions of years and should not be confused with glacial and interglacial periods, which occur only during an icehouse period and tend to last less than 1 million years. There are five known great glaciations in Earth's climate history; the main factors involved in changes of the paleoclimate are believed to be the concentration of atmospheric carbon dioxide, changes in the Earth's orbit, long-term changes in the solar constant, and oceanic and orogenic changes due to tectonic plate dynamics. Greenhouse and icehouse periods have profoundly shaped the evolution of life on Earth.

Greenhouse Earth

Overview of greenhouse Earth

A "greenhouse Earth" is a period in which there are no continental glaciers whatsoever on the planet, the levels of carbon dioxide and other greenhouse gases (such as water vapor and methane) are high, and sea surface temperatures (SSTs) range from 28 °C (82.4 °F) in the tropics to 0 °C (32 °F) in the polar regions. The Earth has been in a greenhouse state for about 85% of its history.

This state should not be confused with a hypothetical hothouse earth, which is an irreversible tipping point corresponding to the ongoing runaway greenhouse effect on Venus. The IPCC states that "a 'runaway greenhouse effect'—analogous to [that of] Venus—appears to have virtually no chance of being induced by anthropogenic activities."

Causes of greenhouse Earth

There are several theories as to how a greenhouse Earth can come about. The geological record shows CO2 and other greenhouse gases are abundant during this time. Tectonic movements were extremely active during the more well-known greenhouse ages (such as 368 million years ago in the Paleozoic Era). Because of continental rifting (continental plates moving away from each other) volcanic activity became more prominent, producing more CO2 and heating up the Earth's atmosphere. Earth is more commonly placed in a greenhouse state throughout the epochs, and the Earth has been in this state for approximately 80% of the past 500 million years, which makes understanding the direct causes somewhat difficult.

Icehouse Earth

Overview of icehouse Earth

An "icehouse Earth" is a period in which the Earth has at least two ice sheets, Arctic and Antarctic (on both poles); these sheets wax and wane throughout shorter times known as glacial periods (with other ice sheets in addition to the 2 polar ones) and interglacial periods (without). During an icehouse Earth, greenhouse gases tend to be less abundant, and temperatures tend to be cooler globally. The Earth is currently in an icehouse stage, that started 34 Ma with the ongoing Late Cenozoic Ice Age. Inside it, the last glacial, Würm, recently ended (110 to 12 ka), still has remnants of non-polar ice sheets (Alps, Himalaya, Patagonia). It will likely be soon followed by another interglacial, similar to the last one, Eemian (130 to 115 ka), when there were forests in North Cape and hippopotamus in the rivers Rhine and Thames. Then glacials and interglacials, of similar lengths as the recent ones, will continue to alternate until the end of the 2 pole ice sheets, meaning the end of the current Icehouse and the start of the next Greenhouse.

Causes of icehouse Earth

The causes of an icehouse state are much debated, because not much is really known about the transitions between greenhouse and icehouse climates and what could make the climate change. One important aspect is clearly the decline of CO2 in the atmosphere, possibly due to low volcanic activity.

Other important issues are the movement of the tectonic plates and the opening and closing of oceanic gateways. These seem to play a crucial part in icehouse Earths because they can bring cool waters from very deep water circulations that could assist in creating ice sheets or thermal isolation of areas. Examples of this occurring are the opening of the Tasmanian gateway 36.5 million years ago that separated Australia and Antarctica and which is believed to have set off the Cenozoic icehouse, and the creation of the Drake Passage 32.8 million years ago by the separation of South America and Antarctica, though it was believed by other scientists that this did not come into effect until around 23 million years ago. The closing of the Isthmus of Panama and the Indonesian seaway approximately 3 or 4 million years ago may have been a major cause for our current icehouse state. For the icehouse climate, tectonic activity also creates mountains, which are produced by one continental plate colliding with another one and continuing forward. The revealed fresh soils act as scrubbers of carbon dioxide, which can significantly affect the amount of this greenhouse gas in the atmosphere. An example of this is the collision between the Indian subcontinent and the Asian continent, which created the Himalayan Mountains about 50 million years ago.

Glacials and interglacials

Within icehouse states, there are "glacial" and "interglacial" periods that cause ice sheets to build up or retreat. The causes for these glacial and interglacial periods are mainly variations in the movement of the earth around the Sun. The astronomical components, discovered by the Serbian geophysicist Milutin Milanković and now known as Milankovitch cycles, include the axial tilt of the Earth, the orbital eccentricity (or shape of the orbit) and the precession (or wobble) of the Earth's rotation. The tilt of the axis tends to fluctuate between 21.5° to 24.5° and back every 41,000 years on the vertical axis. This change actually affects the seasonality upon the earth, since more or less solar radiation hits certain areas of the planet more often on a higher tilt, while less of a tilt would create a more even set of seasons worldwide. These changes can be seen in ice cores, which also contain information showing that during glacial times (at the maximum extension of the ice sheets), the atmosphere had lower levels of carbon dioxide. This may be caused by the increase or redistribution of the acid/base balance with bicarbonate and carbonate ions that deals with alkalinity. During an icehouse, only 20% of the time is spent in interglacial, or warmer times. Model simulations suggest that the current interglacial climate state will continue for at least another 100,000 years, due to CO
2
emissions - including complete deglaciation of the Northern Hemisphere.

Snowball earth

A "snowball earth" is the complete opposite of greenhouse Earth, in which the earth's surface is completely frozen over; however, a snowball earth technically does not have continental ice sheets like during the icehouse state. "The Great Infra-Cambrian Ice Age" has been claimed to be the host of such a world, and in 1964, the scientist W. Brian Harland brought forth his discovery of indications of glaciers in low latitudes (Harland and Rudwick). This became a problem for Harland because of the thought of the "Runaway Snowball Paradox" (a kind of Snowball effect) that, once the earth enters the route of becoming a snowball earth, it would never be able to leave that state. However, in 1992 Joseph Kirschvink [de] brought up a solution to the paradox. Since the continents at this time were huddled at the low and mid-latitudes, there was less ocean water available to absorb the higher amount solar energy hitting the tropics, and at the same time, increased rainfall due to more land mass exposed to higher solar energy might have caused chemical weathering (removing CO2 from atmosphere). Both these conditions might have caused a substantial drop in CO2 atmospheric levels resulting in cooling temperatures, increasing ice albedo (ice reflectivity of incoming solar radiation), further increasing global cooling (a positive feedback). This might have been the mechanism of entering Snowball Earth state. Kirschvink explained that the way to get out of Snowball Earth state could be connected again to carbon dioxide. A possible explanation is that during Snowball Earth, volcanic activity would not halt, accumulating atmospheric CO2. At the same time, global ice cover would prevent chemical weathering (in particular hydrolysis), responsible for removal of CO2 from the atmosphere. CO2 was therefore accumulating in the atmosphere. Once the atmosphere accumulation of CO2 would reach a threshold, temperature would rise enough for ice sheets to start melting. This would in turn reduce ice albedo effect which would in turn further reduce ice cover, exiting Snowball Earth state. At the end of Snowball Earth, before reinstating the equilibrium "thermostat" between volcanic activity and the by then slowly resuming chemical weathering, CO2 in the atmosphere had accumulated enough to cause temperatures to peak to as much as 60° Celsius, before eventually settling down. Around the same geologic period of Snowball Earth (debated if caused by Snowball Earth or being the cause of Snowball Earth) the Great Oxygenation Event (GOE) was occurring. The event known as the Cambrian Explosion followed, which produced the beginnings of multi-cellular life. However some biologists claim that a complete snowball Earth could not have happened since photosynthetic life would not have survived underneath many meters of ice without sunlight. However, sunlight has been observed to penetrate meters of ice in Antarctica. Most scientists today believe that a "hard" Snowball Earth, one completely covered by ice, is probably impossible. However, a "slushball earth", with points of opening near the equator, is possible.

Recent studies may have again complicated the idea of a snowball earth. In October 2011, a team of French researchers announced that the carbon dioxide during the last speculated "snowball earth" may have been lower than originally stated, which provides a challenge in finding out how Earth was able to get out of its state and if it were a snowball or slushball.

Transitions

Causes

The Eocene, which occurred between 53 and 49 million years ago, was the Earth's warmest temperature period for 100 million years. However, this "super-greenhouse" eventually became an icehouse by the late Eocene. It is believed that the decline of CO2 caused this change, though it is possible that positive feedbacks contributed to the cooling.

The best record we have for a transition from an icehouse to greenhouse period where that plant life existed during the Permian period that occurred around 300 million years ago. 40 million years ago, a major transition took place, causing the Earth to change from a moist, icy planet where rainforests covered the tropics, into a hot, dry and windy location where little could survive. Professor Isabel P. Montañez of University of California, Davis, who has researched this time period, found the climate to be "highly unstable" and "marked by dips and rises in carbon dioxide".

Impacts

The Eocene-Oligocene transition, the latest transition, occurred approximately 34 million years ago, resulting in a rapid global temperature decrease, the glaciation of Antarctica and a series of biotic extinction events. The most dramatic species turnover event associated with this time period is the Grande Coupure, a period which saw the replacement of European tree-dwelling and leaf-eating mammal species by migratory species from Asia.

Research

The science of paleoclimatology attempts to understand the history of greenhouse and icehouse conditions over geological time. Through the study of ice cores, dendrochronology, ocean and lake sediments (varve), palynology, (paleobotany), isotope analysis (such as Radiometric dating and stable isotope analysis), and other climate proxies, scientists can create models of Earth's past energy budgets and resulting climate. One study has shown that atmospheric carbon dioxide levels during the Permian age rocked back and forth between 250 parts per million (which is close to present-day levels) up to 2,000 parts per million. Studies on lake sediments suggest that the "Hothouse" or "super-Greenhouse" Eocene was in a "permanent El Nino state" after the 10 °C warming of the deep ocean and high latitude surface temperatures shut down the Pacific Ocean's El Nino-Southern Oscillation. A theory was suggested for the Paleocene–Eocene Thermal Maximum on the sudden decrease of the carbon isotopic composition of the global inorganic carbon pool by 2.5 parts per million. A hypothesis posed for this drop of isotopes was the increase of methane hydrates, the trigger for which remains a mystery. This increase of methane in the atmosphere, which happens to be a potent, but short-lived, greenhouse gas, increased the global temperatures by 6 °C with the assistance of the less potent carbon dioxide.

List of Icehouse and Greenhouse Periods

  • A greenhouse period ran from 4.6 to 2.4 billion years ago.
  • Huronian Glaciation – an icehouse period that ran from 2.4 billion years ago to 2.1 billion years ago
  • A greenhouse period ran from 2.1 billion to 720 million years ago.
  • Cryogenian – an icehouse period that ran from 720 to 635 million years ago, at times the entire Earth was frozen over
  • A greenhouse period ran from 635 million years ago to 450 million years ago.
  • Andean-Saharan glaciation – an icehouse period that ran from 450 to 420 million years ago
  • A greenhouse period ran from 420 million years ago to 360 million years ago.
  • Late Paleozoic Ice Age – an icehouse period that ran from 360 to 260 million years ago
  • A greenhouse period ran from 260 million years ago to 33.9 million years ago
  • Late Cenozoic Ice Age – the current icehouse period which began 33.9 million years ago

Modern conditions

Currently, the Earth is in an icehouse climate state. About 34 million years ago, ice sheets began to form in Antarctica; the ice sheets in the Arctic did not start forming until 2 million years ago. Some processes that may have led to our current icehouse may be connected to the development of the Himalayan Mountains and the opening of the Drake Passage between South America and Antarctica but climate model simulations suggest that the early opening of the Drake Passage played only a limited role, while the later constriction of the Tethys and Central American Seaways is more important in explaining the observed Cenozoic cooling. Scientists have been attempting to compare the past transitions between icehouse and greenhouse, and vice versa, to understand where our planet is now heading.

Without the human influence on the greenhouse gas concentration, the Earth would be heading toward a glacial period. Predicted changes in orbital forcing suggest that in absence of human-made global warming, the next glacial period would begin at least 50,000 years from now, but due to the ongoing anthropogenic greenhouse gas emissions, the Earth is heading towards a greenhouse Earth period. Permanent ice is actually a rare phenomenon in the history of the Earth, occurring only in coincidence with the icehouse effect, which has affected about 20% of Earth's history.

Continental shelf

From Wikipedia, the free encyclopedia

A continental shelf is a portion of a continent that is submerged under an area of relatively shallow water known as a shelf sea. Much of these shelves were exposed by drops in sea level during glacial periods. The shelf surrounding an island is known as an insular shelf.

The continental margin, between the continental shelf and the abyssal plain, comprises a steep continental slope, surrounded by the flatter continental rise, in which sediment from the continent above cascades down the slope and accumulates as a pile of sediment at the base of the slope. Extending as far as 500 km (310 mi) from the slope, it consists of thick sediments deposited by turbidity currents from the shelf and slope. The continental rise's gradient is intermediate between the gradients of the slope and the shelf.

Under the United Nations Convention on the Law of the Sea, the name continental shelf was given a legal definition as the stretch of the seabed adjacent to the shores of a particular country to which it belongs.

Topography

The shelf usually ends at a point of increasing slope (called the shelf break). The sea floor below the break is the continental slope. Below the slope is the continental rise, which finally merges into the deep ocean floor, the abyssal plain. The continental shelf and the slope are part of the continental margin.

Continental shelf.png

The shelf area is commonly subdivided into the inner continental shelf, mid continental shelf, and outer continental shelf, each with their specific geomorphology and marine biology.

The character of the shelf changes dramatically at the shelf break, where the continental slope begins. With a few exceptions, the shelf break is located at a remarkably uniform depth of roughly 140 m (460 ft); this is likely a hallmark of past ice ages, when sea level was lower than it is now.

The continental slope is much steeper than the shelf; the average angle is 3°, but it can be as low as 1° or as high as 10°. The slope is often cut with submarine canyons. The physical mechanisms involved in forming these canyons were not well understood until the 1960s.

Geographical distribution

  Global continental shelf, highlighted in light green

The width of the continental shelf varies considerably – it is not uncommon for an area to have virtually no shelf at all, particularly where the forward edge of an advancing oceanic plate dives beneath continental crust in an offshore subduction zone such as off the coast of Chile or the west coast of Sumatra. The largest shelf – the Siberian Shelf in the Arctic Ocean – stretches to 1,500 kilometers (930 mi) in width. The South China Sea lies over another extensive area of continental shelf, the Sunda Shelf, which joins Borneo, Sumatra, and Java to the Asian mainland. Other familiar bodies of water that overlie continental shelves are the North Sea and the Persian Gulf. The average width of continental shelves is about 80 km (50 mi). The depth of the shelf also varies, but is generally limited to water shallower than 100 m (330 ft). The slope of the shelf is usually quite low, on the order of 0.5°; vertical relief is also minimal, at less than 20 m (66 ft).

Though the continental shelf is treated as a physiographic province of the ocean, it is not part of the deep ocean basin proper, but the flooded margins of the continent. Passive continental margins such as most of the Atlantic coasts have wide and shallow shelves, made of thick sedimentary wedges derived from long erosion of a neighboring continent. Active continental margins have narrow, relatively steep shelves, due to frequent earthquakes that move sediment to the deep sea.

Continental shelf widths
Ocean Active Margin Mean (km) Active Margin Maximum (km) Passive Margin Mean (km) Passive Margin Maximum (km) Total Margin Mean (km) Total Margin Maximum (km)
Arctic Ocean 0 0 104.1 ± 1.7 389 104.1 ± 1.7 389
Indian Ocean 19 ± 0.61 175 47.6 ± 0.8 238 37 ± 0.58 238
Mediterranean and Black Seas 11 ± 0.29 79 38.7 ± 1.5 166 17 ± 0.44 166
North Atlantic Ocean 28 ± 1.08 259 115.7 ± 1.6 434 85 ± 1.14 434
North Pacific Ocean 39 ± 0.71 412 34.9 ± 1.2 114 39 ± 0.68 412
South Atlantic Ocean 24 ± 2.6 55 123.0 ± 2.5 453 104 ± 2.4 453
South Pacific Ocean 214 ± 2.86 357 96.1 ± 2.0 778 110 ± 1.92 778
All Oceans 31 ± 0.4 412 88.2 ± 0.7 778 57 ± 0.41 778

Sediments

The continental shelves are covered by terrigenous sediments; that is, those derived from erosion of the continents. However, little of the sediment is from current rivers; some 60–70% of the sediment on the world's shelves is relict sediment, deposited during the last ice age, when sea level was 100–120 m lower than it is now.

Sediments usually become increasingly fine with distance from the coast; sand is limited to shallow, wave-agitated waters, while silt and clays are deposited in quieter, deep water far offshore. These accumulate 15–40 cm every millennium, much faster than deep-sea pelagic sediments.

Shelf seas

Shelf seas refer to the ocean waters on the continental shelf. Their motion is controlled by the combined influences of the tides, wind-forcing and brackish water formed from river inflows (Regions of Freshwater Influence). These regions can often be biologically highly productive due to mixing caused by the shallower waters and the enhanced current speeds. Despite covering only about 8% of the Earth's ocean surface area, shelf seas support 15-20% of global primary productivity.

While the North Sea is one of the better studied shelf seas, it is not necessarily representative of all shelf seas as there is a wide variety of behaviours to be found. Indian Ocean shelf seas are dominated by major river systems including the Ganges and Indus rivers. The shelf seas around New Zealand are complicated because the submerged continent of Zealandia creates wide plateaus. Shelf seas around Antarctica and the shores of the Arctic Ocean are influenced by sea ice production and polynya.

There is evidence that changing wind, rainfall, and regional ocean currents in a warming ocean, is having an effect on some shelf seas. Improved data collection via Integrated Ocean Observing Systems in shelf sea regions is making identification of these changes possible.

Biota

Continental shelves teem with life because of the sunlight available in shallow waters, in contrast to the biotic desert of the oceans' abyssal plain. The pelagic (water column) environment of the continental shelf constitutes the neritic zone, and the benthic (sea floor) province of the shelf is the sublittoral zone. The shelves makes up less than ten percent of the ocean, and a rough estimate suggest that only about 30% of the continental shelf sea floor receives enough sunlight to allow benthic photosynthesis.

Though the shelves are usually fertile, if anoxic conditions prevail during sedimentation, the deposits may over geologic time become sources for fossil fuels.

Economic significance

The relatively accessible continental shelf is the best understood part of the ocean floor. Most commercial exploitation from the sea, such as metallic-ore, non-metallic ore, and hydrocarbon extraction, takes place on the continental shelf.

Sovereign rights over their continental shelves up to a depth of 100 m (330 ft) or to a distance where the depth of waters admitted of resource exploitation were claimed by the marine nations that signed the Convention on the Continental Shelf drawn up by the UN's International Law Commission in 1958. This was partly superseded by the 1982 United Nations Convention on the Law of the Sea, which created the 200 nautical miles (370 km; 230 mi) exclusive economic zone, plus continental shelf rights for states with physical continental shelves that extend beyond that distance.

The legal definition of a continental shelf differs significantly from the geological definition. UNCLOS states that the shelf extends to the limit of the continental margin, but no less than 200 nmi (370 km; 230 mi) and no more than 350 nmi (650 km; 400 mi) from the baseline. Thus inhabited volcanic islands such as the Canaries, which have no actual continental shelf, nonetheless have a legal continental shelf, whereas uninhabitable islands have no shelf.

Lie point symmetry

From Wikipedia, the free encyclopedia https://en.wikipedia.org/wiki/Lie_point_symmetry     ...