Search This Blog

Tuesday, May 3, 2022

Central nervous system

From Wikipedia, the free encyclopedia
 
Central nervous system
1201 Overview of Nervous System.jpg
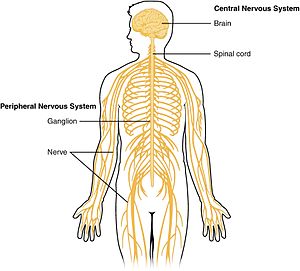
Schematic diagram showing the central nervous system in yellow, peripheral in orange
Details
Lymph224
Identifiers
LatinSystema nervosum centrale
pars centralis systematis nervosi
Acronym(s)CNS
MeSHD002490
TA98A14.1.00.001
TA25364
FMA55675

The central nervous system (CNS) is the part of the nervous system consisting primarily of the brain and spinal cord. The CNS is so named because the brain integrates the received information and coordinates and influences the activity of all parts of the bodies of bilaterally symmetric and triploblastic animals—that is, all multicellular animals except sponges and diploblasts. It is a structure composed of nervous tissue positioned along the rostral (nose end) to caudal (tail end) axis of the body and may have an enlarged section at the rostral end which is a brain. Only arthropods, cephalopods and vertebrates have a true brain (precursor structures exist in onychophorans, gastropods and lancelets).

The rest of this article exclusively discusses the vertebrate central nervous system, which is radically distinct from all other animals.

Overview

In vertebrates the brain and spinal cord are both enclosed in the meninges. The meninges provide a barrier to chemicals dissolved in the blood, protecting the brain from most neurotoxins commonly found in food. Within the meninges the brain and spinal cord are bathed in cerebral spinal fluid which replaces the body fluid found outside the cells of all bilateral animals.

In vertebrates the CNS is contained within the dorsal body cavity, with the brain is housed in the cranial cavity within the skull, and the spinal cord is housed in the spinal canal within the vertebrae. Within the CNS, the interneuronal space is filled with a large amount of supporting non-nervous cells called neuroglia or glia from the Greek for "glue".

In vertebrates the CNS also includes the retina and the optic nerve (cranial nerve II), as well as the olfactory nerves and olfactory epithelium. As parts of the CNS, they connect directly to brain neurons without intermediate ganglia. The olfactory epithelium is the only central nervous tissue outside the meninges in direct contact with the environment, which opens up a pathway for therapeutic agents which cannot otherwise cross the meninges barrier.

Structure

The CNS consists of the two major structures: the brain and spinal cord. The brain is encased in the skull, and protected by the cranium. The spinal cord is continuous with the brain and lies caudally to the brain. It is protected by the vertebrae. The spinal cord reaches from the base of the skull, continues through / starting below the foramen magnum, and terminates roughly level with the first or second lumbar vertebra, occupying the upper sections of the vertebral canal.

White and gray matter

Dissection of a human brain with labels showing the clear division between white and gray matter.

Microscopically, there are differences between the neurons and tissue of the CNS and the peripheral nervous system (PNS). The CNS is composed of white and gray matter. This can also be seen macroscopically on brain tissue. The white matter consists of axons and oligodendrocytes, while the gray matter consists of neurons and unmyelinated fibers. Both tissues include a number of glial cells (although the white matter contains more), which are often referred to as supporting cells of the CNS. Different forms of glial cells have different functions, some acting almost as scaffolding for neuroblasts to climb during neurogenesis such as bergmann glia, while others such as microglia are a specialized form of macrophage, involved in the immune system of the brain as well as the clearance of various metabolites from the brain tissue. Astrocytes may be involved with both clearance of metabolites as well as transport of fuel and various beneficial substances to neurons from the capillaries of the brain. Upon CNS injury astrocytes will proliferate, causing gliosis, a form of neuronal scar tissue, lacking in functional neurons.

The brain (cerebrum as well as midbrain and hindbrain) consists of a cortex, composed of neuron-bodies constituting gray matter, while internally there is more white matter that form tracts and commissures. Apart from cortical gray matter there is also subcortical gray matter making up a large number of different nuclei.

Spinal cord

Diagram of the columns and of the course of the fibers in the spinal cord. Sensory synapses occur in the dorsal spinal cord (above in this image), and motor nerves leave through the ventral (as well as lateral) horns of the spinal cord as seen below in the image.
 
Different ways in which the CNS can be activated without engaging the cortex, and making us aware of the actions. The above example shows the process in which the pupil dilates during dim light, activating neurons in the spinal cord. The second example shows the constriction of the pupil as a result of the activation of the Eddinger-Westphal nucleus (a cerebral ganglion).

From and to the spinal cord are projections of the peripheral nervous system in the form of spinal nerves (sometimes segmental nerves). The nerves connect the spinal cord to skin, joints, muscles etc. and allow for the transmission of efferent motor as well as afferent sensory signals and stimuli. This allows for voluntary and involuntary motions of muscles, as well as the perception of senses. All in all 31 spinal nerves project from the brain stem, some forming plexa as they branch out, such as the brachial plexa, sacral plexa etc. Each spinal nerve will carry both sensory and motor signals, but the nerves synapse at different regions of the spinal cord, either from the periphery to sensory relay neurons that relay the information to the CNS or from the CNS to motor neurons, which relay the information out.

The spinal cord relays information up to the brain through spinal tracts through the final common pathway to the thalamus and ultimately to the cortex.

Cranial nerves

Apart from the spinal cord, there are also peripheral nerves of the PNS that synapse through intermediaries or ganglia directly on the CNS. These 12 nerves exist in the head and neck region and are called cranial nerves. Cranial nerves bring information to the CNS to and from the face, as well as to certain muscles (such as the trapezius muscle, which is innervated by accessory nerves as well as certain cervical spinal nerves).

Two pairs of cranial nerves; the olfactory nerves and the optic nerves are often considered structures of the CNS. This is because they do not synapse first on peripheral ganglia, but directly on CNS neurons. The olfactory epithelium is significant in that it consists of CNS tissue expressed in direct contact to the environment, allowing for administration of certain pharmaceuticals and drugs. 

Image showing the way Schwann cells myelinate periferal nerves.

A neuron of the CNS, myelinated by an oligodendrocyte
A peripheral nerve myelinated by Schwann cells (top) and a CNS neuron myelinated by an oligodendrocyte (bottom)

Brain

At the anterior end of the spinal cord lies the brain. The brain makes up the largest portion of the CNS. It is often the main structure referred to when speaking of the nervous system in general. The brain is the major functional unit of the CNS. While the spinal cord has certain processing ability such as that of spinal locomotion and can process reflexes, the brain is the major processing unit of the nervous system.

Brainstem

The brainstem consists of the medulla, the pons and the midbrain. The medulla can be referred to as an extension of the spinal cord, which both have similar organization and functional properties. The tracts passing from the spinal cord to the brain pass through here.

Regulatory functions of the medulla nuclei include control of blood pressure and breathing. Other nuclei are involved in balance, taste, hearing, and control of muscles of the face and neck.

The next structure rostral to the medulla is the pons, which lies on the ventral anterior side of the brainstem. Nuclei in the pons include pontine nuclei which work with the cerebellum and transmit information between the cerebellum and the cerebral cortex. In the dorsal posterior pons lie nuclei that are involved in the functions of breathing, sleep, and taste.

The midbrain, or mesencephalon, is situated above and rostral to the pons. It includes nuclei linking distinct parts of the motor system, including the cerebellum, the basal ganglia and both cerebral hemispheres, among others. Additionally, parts of the visual and auditory systems are located in the midbrain, including control of automatic eye movements.

The brainstem at large provides entry and exit to the brain for a number of pathways for motor and autonomic control of the face and neck through cranial nerves, Autonomic control of the organs is mediated by the tenth cranial nerve. A large portion of the brainstem is involved in such autonomic control of the body. Such functions may engage the heart, blood vessels, and pupils, among others.

The brainstem also holds the reticular formation, a group of nuclei involved in both arousal and alertness.

Cerebellum

The cerebellum lies behind the pons. The cerebellum is composed of several dividing fissures and lobes. Its function includes the control of posture and the coordination of movements of parts of the body, including the eyes and head, as well as the limbs. Further, it is involved in motion that has been learned and perfected through practice, and it will adapt to new learned movements. Despite its previous classification as a motor structure, the cerebellum also displays connections to areas of the cerebral cortex involved in language and cognition. These connections have been shown by the use of medical imaging techniques, such as functional MRI and Positron emission tomography.

The body of the cerebellum holds more neurons than any other structure of the brain, including that of the larger cerebrum, but is also more extensively understood than other structures of the brain, as it includes fewer types of different neurons. It handles and processes sensory stimuli, motor information, as well as balance information from the vestibular organ.

Diencephalon

The two structures of the diencephalon worth noting are the thalamus and the hypothalamus. The thalamus acts as a linkage between incoming pathways from the peripheral nervous system as well as the optical nerve (though it does not receive input from the olfactory nerve) to the cerebral hemispheres. Previously it was considered only a "relay station", but it is engaged in the sorting of information that will reach cerebral hemispheres (neocortex).

Apart from its function of sorting information from the periphery, the thalamus also connects the cerebellum and basal ganglia with the cerebrum. In common with the aforementioned reticular system the thalamus is involved in wakefullness and consciousness, such as though the SCN.

The hypothalamus engages in functions of a number of primitive emotions or feelings such as hunger, thirst and maternal bonding. This is regulated partly through control of secretion of hormones from the pituitary gland. Additionally the hypothalamus plays a role in motivation and many other behaviors of the individual.

Cerebrum

The cerebrum of cerebral hemispheres make up the largest visual portion of the human brain. Various structures combine to form the cerebral hemispheres, among others: the cortex, basal ganglia, amygdala and hippocampus. The hemispheres together control a large portion of the functions of the human brain such as emotion, memory, perception and motor functions. Apart from this the cerebral hemispheres stand for the cognitive capabilities of the brain.

Connecting each of the hemispheres is the corpus callosum as well as several additional commissures. One of the most important parts of the cerebral hemispheres is the cortex, made up of gray matter covering the surface of the brain. Functionally, the cerebral cortex is involved in planning and carrying out of everyday tasks.

The hippocampus is involved in storage of memories, the amygdala plays a role in perception and communication of emotion, while the basal ganglia play a major role in the coordination of voluntary movement.

Difference from the peripheral nervous system

A map over the different structures of the nervous systems in the body, showing the CNS, PNS, autonomic nervous system, and enteric nervous system.

This differentiates the CNS from the PNS, which consists of neurons, axons, and Schwann cells. Oligodendrocytes and Schwann cells have similar functions in the CNS and PNS, respectively. Both act to add myelin sheaths to the axons, which acts as a form of insulation allowing for better and faster proliferation of electrical signals along the nerves. Axons in the CNS are often very short, barely a few millimeters, and do not need the same degree of isolation as peripheral nerves. Some peripheral nerves can be over 1 meter in length, such as the nerves to the big toe. To ensure signals move at sufficient speed, myelination is needed.

The way in which the Schwann cells and oligodendrocytes myelinate nerves differ. A Schwann cell usually myelinates a single axon, completely surrounding it. Sometimes, they may myelinate many axons, especially when in areas of short axons. Oligodendrocytes usually myelinate several axons. They do this by sending out thin projections of their cell membrane, which envelop and enclose the axon.

Development

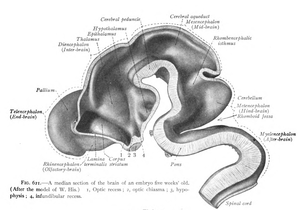
CNS seen in a median section of a 5-week-old embryo.
CNS seen in a median section of a 3-month-old embryo.
Top image: CNS as seen in a median section of a 5-week-old embryo. Bottom image: CNS seen in a median section of a 3-month-old embryo.

During early development of the vertebrate embryo, a longitudinal groove on the neural plate gradually deepens and the ridges on either side of the groove (the neural folds) become elevated, and ultimately meet, transforming the groove into a closed tube called the neural tube. The formation of the neural tube is called neurulation. At this stage, the walls of the neural tube contain proliferating neural stem cells in a region called the ventricular zone. The neural stem cells, principally radial glial cells, multiply and generate neurons through the process of neurogenesis, forming the rudiment of the CNS.

The neural tube gives rise to both brain and spinal cord. The anterior (or 'rostral') portion of the neural tube initially differentiates into three brain vesicles (pockets): the prosencephalon at the front, the mesencephalon, and, between the mesencephalon and the spinal cord, the rhombencephalon. (By six weeks in the human embryo) the prosencephalon then divides further into the telencephalon and diencephalon; and the rhombencephalon divides into the metencephalon and myelencephalon. The spinal cord is derived from the posterior or 'caudal' portion of the neural tube.

As a vertebrate grows, these vesicles differentiate further still. The telencephalon differentiates into, among other things, the striatum, the hippocampus and the neocortex, and its cavity becomes the first and second ventricles. Diencephalon elaborations include the subthalamus, hypothalamus, thalamus and epithalamus, and its cavity forms the third ventricle. The tectum, pretectum, cerebral peduncle and other structures develop out of the mesencephalon, and its cavity grows into the mesencephalic duct (cerebral aqueduct). The metencephalon becomes, among other things, the pons and the cerebellum, the myelencephalon forms the medulla oblongata, and their cavities develop into the fourth ventricle.

CNS Brain Prosencephalon Telencephalon

Rhinencephalon, amygdala, hippocampus, neocortex, basal ganglia, lateral ventricles

Diencephalon

Epithalamus, thalamus, hypothalamus, subthalamus, pituitary gland, pineal gland, third ventricle

Brain stem Mesencephalon

Tectum, cerebral peduncle, pretectum, mesencephalic duct

Rhombencephalon Metencephalon

Pons, cerebellum

Myelencephalon Medulla oblongata
Spinal cord

Evolution

Lancelets or amphioxus are regarded as similar to the archetypal vertebrate form, and possess to true brain.
A neuron of the CNS, myelinated by an oligodendrocyte
Traditional spindle diagram of the evolution of the vertebrates at class level.
Top: the lancelet, regarded an archetypal vertebrate, lacking a true brain. Middle: an early vertebrate. Bottom: spindle diagram of the evolution of vertebrates.

Planaria

Planarians, members of the phylum Platyhelminthes (flatworms), have the simplest, clearly defined delineation of a nervous system into a CNS and a PNS. Their primitive brains, consisting of two fused anterior ganglia, and longitudinal nerve cords form the CNS. Like vertebrates, have a distinct CNS and PNS. The nerves projecting laterally from the CNS form their PNS.

A molecular study found that more than 95% of the 116 genes involved in the nervous system of planarians, which includes genes related to the CNS, also exist in humans.

Arthropoda

In arthropods, the ventral nerve cord, the subesophageal ganglia and the supraesophageal ganglia are usually seen as making up the CNS. Arthropoda, unlike vertebrates, have inhibitory motor neurons due to their small size.

Chordata

The CNS of chordates differs from that of other animals in being placed dorsally in the body, above the gut and notochord/spine. The basic pattern of the CNS is highly conserved throughout the different species of vertebrates and during evolution. The major trend that can be observed is towards a progressive telencephalisation: the telencephalon of reptiles is only an appendix to the large olfactory bulb, while in mammals it makes up most of the volume of the CNS. In the human brain, the telencephalon covers most of the diencephalon and the mesencephalon. Indeed, the allometric study of brain size among different species shows a striking continuity from rats to whales, and allows us to complete the knowledge about the evolution of the CNS obtained through cranial endocasts.

Mammals

Mammals – which appear in the fossil record after the first fishes, amphibians, and reptiles – are the only vertebrates to possess the evolutionarily recent, outermost part of the cerebral cortex (main part of the telencephalon excluding olfactory bulb) known as the neocortex. This part of the brain is, in mammals, involved in higher thinking and further processing of all senses in the sensory cortices (processing for smell was previously only done by its bulb while those for non-smell senses were only done by the tectum). The neocortex of monotremes (the duck-billed platypus and several species of spiny anteaters) and of marsupials (such as kangaroos, koalas, opossums, wombats, and Tasmanian devils) lack the convolutions – gyri and sulci – found in the neocortex of most placental mammals (eutherians). Within placental mammals, the size and complexity of the neocortex increased over time. The area of the neocortex of mice is only about 1/100 that of monkeys, and that of monkeys is only about 1/10 that of humans. In addition, rats lack convolutions in their neocortex (possibly also because rats are small mammals), whereas cats have a moderate degree of convolutions, and humans have quite extensive convolutions. Extreme convolution of the neocortex is found in dolphins, possibly related to their complex echolocation.

Clinical significance

Diseases

There are many CNS diseases and conditions, including infections such as encephalitis and poliomyelitis, early-onset neurological disorders including ADHD and autism, late-onset neurodegenerative diseases such as Alzheimer's disease, Parkinson's disease, and essential tremor, autoimmune and inflammatory diseases such as multiple sclerosis and acute disseminated encephalomyelitis, genetic disorders such as Krabbe's disease and Huntington's disease, as well as amyotrophic lateral sclerosis and adrenoleukodystrophy. Lastly, cancers of the central nervous system can cause severe illness and, when malignant, can have very high mortality rates. Symptoms depend on the size, growth rate, location and malignancy of tumors and can include alterations in motor control, hearing loss, headaches and changes in cognitive ability and autonomic functioning.

Specialty professional organizations recommend that neurological imaging of the brain be done only to answer a specific clinical question and not as routine screening.
Electric potential

From Wikipedia, the free encyclopedia
 
Electric potential
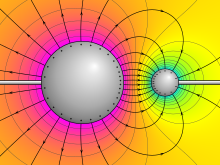
VFPt metal balls largesmall potential+contour.svg
Electric potential around two oppositely charged conducting spheres. Purple represents the highest potential, yellow zero, and cyan the lowest potential. The electric field lines are shown leaving perpendicularly to the surface of each sphere.
 
Common symbols
V, φ
SI unitvolt
Other units
statvolt
In SI base unitsV = kg⋅m2⋅s−3⋅A−1
Extensive?yes
DimensionM L2 T−3 I−1

The electric potential (also called the electric field potential, potential drop, the electrostatic potential) is defined as the amount of work energy needed to move a unit of electric charge from a reference point to the specific point in an electric field. More precisely, it is the energy per unit charge for a test charge that is so small that the disturbance of the field under consideration is negligible. Furthermore, the motion across the field is supposed to proceed with negligible acceleration, so as to avoid the test charge acquiring kinetic energy or producing radiation. By definition, the electric potential at the reference point is zero units. Typically, the reference point is earth or a point at infinity, although any point can be used.

In classical electrostatics, the electrostatic field is a vector quantity that is expressed as the gradient of the electrostatic potential, which is a scalar quantity denoted by V or occasionally φ, equal to the electric potential energy of any charged particle at any location (measured in joules) divided by the charge of that particle (measured in coulombs). By dividing out the charge on the particle a quotient is obtained that is a property of the electric field itself. In short, an electric potential is the electric potential energy per unit charge.

This value can be calculated in either a static (time-invariant) or a dynamic (varying with time) electric field at a specific time in units of joules per coulomb (J⋅C−1), or volts (V). The electric potential at infinity is assumed to be zero.

In electrodynamics, when time-varying fields are present, the electric field cannot be expressed only in terms of a scalar potential. Instead, the electric field can be expressed in terms of both the scalar electric potential and the magnetic vector potential. The electric potential and the magnetic vector potential together form a four-vector, so that the two kinds of potential are mixed under Lorentz transformations.

Practically, the electric potential is always a continuous function in space. Otherwise, the spatial derivative of it will yield a field with infinite magnitude, which is practically impossible. Even an idealized point charge has 1 ⁄ r potential, which is continuous everywhere except the origin. The electric field is not continuous across an idealized surface charge, but it is not infinite at any point. Therefore, the electric potential is continuous across an idealized surface charge. An idealized linear charge has ln(r) potential, which is continuous everywhere except on the linear charge.

Introduction

Classical mechanics explores concepts such as force, energy, and potential. Force and potential energy are directly related. A net force acting on any object will cause it to accelerate. As an object moves in the direction of the force that is acting, its potential energy decreases. For example, the gravitational potential energy of a cannonball at the top of a hill is greater than at the base of the hill. As it rolls downhill, its potential energy decreases and is being translated to motion - kinetic energy.

It is possible to define the potential of certain force fields so that the potential energy of an object in that field depends only on the position of the object with respect to the field. Two such force fields are the gravitational field and an electric field (in the absence of time-varying magnetic fields). Such fields must affect objects due to the intrinsic properties of the object (e.g., mass or charge) and the position of the object.

Objects may possess a property known as electric charge. Since an electric field exerts a force on charged objects, if the charged object has a positive charge, the force will be in the direction of the electric field vector at that point; if the charge is negative, the force will be in the opposite direction.

The magnitude of the force is given by the quantity of the charge multiplied by the magnitude of the electric field vector:

.

Electrostatics

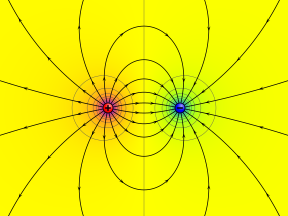
Electric potential of separate positive and negative point charges shown as color range from magenta (+), through yellow (0), to cyan (−). Circular contours are equipotential lines. Electric field lines leave the positive charge and enter the negative charge.

 
Electric potential in the vicinity of two opposite point charges.

The electric potential at a point r in a static electric field E is given by the line integral

where C is an arbitrary path from some fixed reference point to . In electrostatics, the Maxwell-Faraday equation reveals that the curl is zero, making the electric field conservative. Thus, the line integral above does not depend on the specific path C chosen but only on its endpoints, making well-defined everywhere. The gradient theorem then allows us to write:

This states that the electric field points "downhill" towards lower voltages. By Gauss's law, the potential can also be found to satisfy Poisson's equation:

where ρ is the total charge density and · denotes the divergence.

The concept of electric potential is closely linked with potential energy. A test charge q has an electric potential energy UE given by

The potential energy and hence, also the electric potential, is only defined up to an additive constant: one must arbitrarily choose a position where the potential energy and the electric potential are zero.

These equations cannot be used if the curl , i.e., in the case of a non-conservative electric field (caused by a changing magnetic field; see Maxwell's equations). The generalization of electric potential to this case is described in the section § Generalization to electrodynamics.

Electric potential due to a point charge

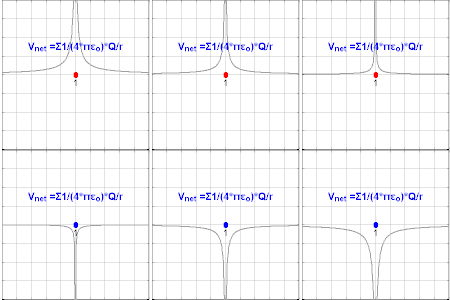
The electric potential created by a charge Q is V = Q/(4πε0r). Different values of Q will make different values of electric potential V (shown in the image).

The electric potential arising from a point charge Q, at a distance r from the charge is observed to be

where ε0 is the permittivity of vacuum. VE is known as the Coulomb potential.

The electric potential for a system of point charges is equal to the sum of the point charges' individual potentials. This fact simplifies calculations significantly, because addition of potential (scalar) fields is much easier than addition of the electric (vector) fields. Specifically, the potential of a set of discrete point charges qi at points ri becomes

where

  • is a point at which the potential is evaluated.
  • is a point at which there is a nonzero charge.
  • is the charge at the point .

and the potential of a continuous charge distribution ρ(r) becomes

Where

  • is a point at which the potential is evaluated.
  • is a region containing all the points at which the charge density is nonzero.
  • is a point inside .
  • is the charge density at the point .

The equations given above for the electric potential (and all the equations used here) are in the forms required by SI units. In some other (less common) systems of units, such as CGS-Gaussian, many of these equations would be altered.

Generalization to electrodynamics

When time-varying magnetic fields are present (which is true whenever there are time-varying electric fields and vice versa), it is not possible to describe the electric field simply in terms of a scalar potential V because the electric field is no longer conservative: is path-dependent because (due to the Maxwell-Faraday equation).

Instead, one can still define a scalar potential by also including the magnetic vector potential A. In particular, A is defined to satisfy:

where B is the magnetic field. By the fundamental theorem of vector calculus, such an A can always be found, since the divergence of the magnetic field is always zero due to the absence of magnetic monopoles. Now, the quantity

is a conservative field, since the curl of is canceled by the curl of according to the Maxwell-Faraday equation. One can therefore write

where V is the scalar potential defined by the conservative field F.

The electrostatic potential is simply the special case of this definition where A is time-invariant. On the other hand, for time-varying fields,

unlike electrostatics.

Gauge freedom

The electrostatic potential could have any constant added to it without affecting the electric field. In electrodynamics, the electric potential has infinitely many degrees of freedom. For any (possibly time-varying or space-varying) scalar field , we can perform the following gauge transformation to find a new set of potentials that produce exactly the same electric and magnetic fields:

Given different choices of gauge, the electric potential could have quite different properties. In the Coulomb gauge, the electric potential is given by Poisson's equation

just like in electrostatics. However, in the Lorenz gauge, the electric potential is a retarded potential that propagates at the speed of light, and is the solution to an inhomogeneous wave equation:

Units

The SI derived unit of electric potential is the volt (in honor of Alessandro Volta), which is why a difference in electric potential between two points is known as voltage. Older units are rarely used today. Variants of the centimetre–gram–second system of units included a number of different units for electric potential, including the abvolt and the statvolt.

Galvani potential versus electrochemical potential

Inside metals (and other solids and liquids), the energy of an electron is affected not only by the electric potential, but also by the specific atomic environment that it is in. When a voltmeter is connected between two different types of metal, it measures the potential difference corrected for the different atomic environments. The quantity measured by a voltmeter is called electrochemical potential or fermi level, while the pure unadjusted electric potential V is sometimes called Galvani potential . The terms "voltage" and "electric potential" are a bit ambiguous, however in practice, they can refer to either of these in different contexts.

Building nuclear power plants

Why do costs exceed projections?

Nancy W. Stauffer    ·    November 25, 2020    ·    MITEI

In brief

An MIT team has revealed why, in the field of nuclear power, experience with a given technology doesn’t always lower costs. When it comes to building a nuclear power plant in the United States—even of a well-known design—the total bill is often three times as high as expected. Using a new analytical approach, the researchers delved into the cost overrun from non-hardware-related activities such as engineering services and labor supervision. Tightening safety regulations were responsible for some of the cost increase, but declining labor productivity also played a significant role. Analyses of possible cost-reduction strategies show potential gains from technology development to reduce materials use and to automate some construction tasks. Cost overruns continue to be left out of nuclear industry projections and overlooked in the design process in the United States, but the researchers’ approach could help solve those problems. Their new tool should prove valuable to design engineers, developers, and investors in any field with demanding and changeable regulatory and site-specific requirements.


Nuclear power is frequently cited as a critical component in the portfolio of technologies aimed at reducing greenhouse gas emissions. But rising construction costs and project delays have hampered efforts to expand nuclear capacity in the United States since the 1970s. At plants begun after 1970, the average cost of construction has typically been far higher than the initial cost estimate.

Nevertheless, the nuclear industry, government, and research agencies continue to forecast cost reductions in nuclear plant construction. A key assumption in such projections is that costs will decline as the industry gains experience with a given reactor design. “It’s often included in models, with huge impacts on the outcomes of projected energy supply mixes,” says Jessika E. Trancik, an associate professor of energy studies in the MIT Institute for Data, Systems, and Society (IDSS).

That expectation is based on an assumption typically expressed in terms of the “learning rate” for a given technology, which represents the percent cost reduction associated with a doubling of cumulative production. Nuclear industry cost-estimating guidelines as well as widely used climate models and global energy scenarios often rely on learning rates that significantly reduce costs as installed nuclear capacity increases. Yet empirical evidence shows that in the case of nuclear plants, learning rates are negative. Costs just keep rising.

To investigate, Trancik and her team—co-first authors Philip Eash-Gates SM ’19 and IDSS postdoc Magdalena M. Klemun PhD ’19; IDSS postdoc Gökşin Kavlak; former IDSS research scientist James McNerney; and TEPCO Professor of Nuclear Science and Engineering Jacopo Buongiorno—began by looking at industry data on the cost of construction (excluding financing costs) over five decades from 107 nuclear plants across the United States. They estimated a negative learning rate consistent with a doubling of construction costs with each doubling of cumulative U.S. capacity.

That result is based on average costs across nuclear plants of all types. One explanation is that the rise in average costs hides trends of decreasing costs in particular reactor designs. So the researchers examined the cost trajectories of four standard plant designs installed in the United States that reached a cumulative built capacity of 8 gigawatts-electric. Their results appear below. They found that construction costs for each of the four designs rose as more plants were built. In fact, the first one built was the least expensive in three of the four cases and was among the least expensive plants in the fourth.

“We’ve confirmed that costs have risen even for plants of the same design class,” says Trancik. “That outcome defies engineering expectations.” She notes that a common view is that more stringent safety regulations have increased the cost of nuclear power plant construction. But is that the full explanation, or are other factors at work as well?

Source of increasing cost

To find out, the researchers examined cost data from 1976 to 1987 in the U.S. Department of Energy’s Energy Economic Data Base. (After 1987 the DOE database was no longer updated.) They looked at the contributions to overall cost increases of 61 “cost accounts” representing individual plant components and the services needed to install them.

They found that the overall trend was an increase in costs. Many accounts contribute to the total cost escalation, so the researchers couldn’t easily identify one source. But they could group the accounts into two categories: direct costs and indirect costs. Direct costs are costs of materials and labor needed for physical components such as reactor equipment and control and monitoring systems. Indirect costs are construction support activities such as engineering, administration, and construction supervision. The figure below shows their results.

The researchers concluded that between 1976 and 1987, indirect costs—those external to hardware—caused 72% of the cost increase. “Most aren’t hardware-related but rather are what we call soft costs,” says Trancik. “Examples include rising expenditures on engineering services, on-site job supervision, and temporary construction facilities.”

To determine which aspects of the technology were most responsible for the rise in indirect expenses, they delved further into the DOE dataset and attributed the indirect expenses to the specific plant components that incurred them. The analysis revealed that three components were most influential in causing the indirect cost change: the nuclear steam supply system, the turbine generator, and the containment building. All three also contributed heavily to the direct cost increase.

A case study

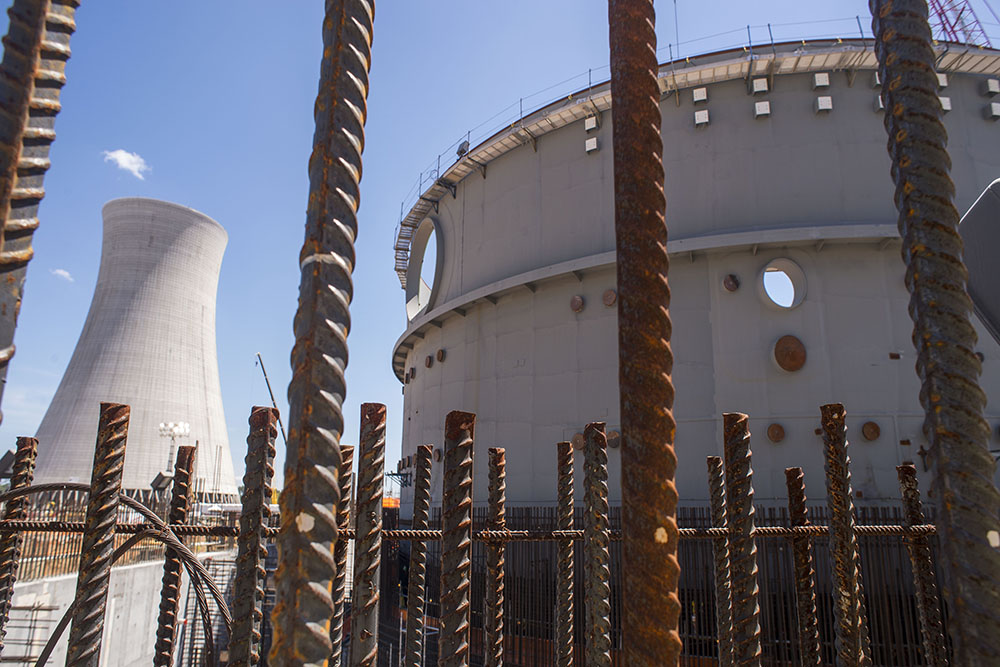
For further insight, the researchers undertook a case study focusing on the containment building. This airtight, steel-and-concrete structure forms the outermost layer of a nuclear reactor and is designed to prevent the escape of radioactive materials as well as to protect the plant from aircraft impact, missile attack, and other threats. As such, it is one of the most expensive components and one with significant safety requirements.

Based on historical and recent design drawings, the researchers extended their analysis from the 1976–1987 period to the year 2017. Data on indirect costs aren’t available for 2017, so they focused on the direct cost of the containment building. Their goal was to break down cost changes into underlying engineering choices and productivity trends.

They began by developing a standard cost equation that could calculate the cost of the containment building based on a set of underlying variables—from wall thickness to laborer wages to the prices of materials. To track the effects of labor productivity trends on cost, they included variables representing steel and concrete “deployment rates,” defined as the ratio of material volumes to the amount of labor (in person-hours) required to deploy them during construction.

A cost equation can be used to calculate how a change in one variable will affect overall cost. But when multiple variables are changing at the same time, adding up the individual impacts won’t work because they interact. Trancik and her team therefore turned to a novel methodology they developed in 2018 to examine what caused the cost of solar photovoltaic modules to drop so much in recent decades. Based on their cost equation for the containment building and following their 2018 methodology, they derived a “cost change equation” that can quantify how a change in each variable contributes to the change in overall cost when the variables are all changing at once.

Their results, summarized in the right-hand panel of the figure below, show that the major contributors to the rising cost of the containment building between 1976 and 2017 were changes in the thickness of the structure and in the materials deployment rates. Changes to other plant geometries and to prices of materials brought costs down but not enough to offset those increases.

Percentage contribution of variables to increases in containment building costs These panels summarize types of variables that caused costs to increase between 1976 and 2017. In the first time period (left panel), the major contributor was a drop in the rate at which materials were deployed during construction. In the second period (middle panel), the containment building was redesigned for improved safety during possible emergencies, and the required increase in wall thickness pushed up costs. Overall, from 1976 to 2017 (right panel), the cost of a containment building more than doubled.

As the left and center panels above show, the importance of those mechanisms changed over time. Between 1976 and 1987, the cost increase was caused primarily by declining deployment rates; in other words, productivity dropped. Between 1987 and 2017, the containment building was redesigned for passive cooling, reducing the need for operator intervention during emergencies. The new design required that the steel shell be approximately five times thicker in 2017 than it had been in 1987—a change that caused 80% of the cost increase over the 1976–2017 period.

Overall, the researchers found that the cost of the reactor containment building more than doubled between 1976 and 2017. Most of that cost increase was due to increasing materials use and declining on-site labor productivity—not all of which could be clearly attributed to safety regulations. Labor productivity has been declining in the construction industry at large, but at nuclear plants it has dropped far more rapidly. “Material deployment rates at recent U.S. ‘new builds’ have been up to 13 times lower than those assumed by the industry for cost estimation purposes,” says Trancik. “That disparity between projections and actual experience has contributed significantly to cost overruns.”

Discussion so far has focused on what the researchers call “low-level mechanisms” of cost change—that is, cost change that arises from changes in the variables in their cost model, such as materials deployment rates and containment wall thickness. In many cases, those changes have been driven by “high-level mechanisms” such as human activities, strategies, regulations, and economies of scale.

The researchers identified four high-level mechanisms that could have driven the low-level changes. The first three are “R&D,” which can lead to requirements for significant modifications to the containment building design and construction process; “process interference, safety,” which includes the impacts of on-site safety-related personnel on the construction process; and “worsening despite doing,” which refers to decreases in the performance of construction workers, possibly due to falling morale and other changes. The fourth mechanism— “other”—includes changes that originate outside the nuclear industry, such as wage or commodity price changes. Following their 2018 methodology, the team assigned each low-level cost increase to the high-level mechanism or set of mechanisms that caused it.

The analysis showed that R&D-related activities contributed roughly 30% to cost increases, and on-site procedural changes contributed roughly 70%. Safety-related mechanisms caused about half of the direct cost increase over the 1976 to 2017 period. If all the productivity decline were attributed to safety, then 90% of the overall cost increase could be linked to safety. But historical evidence points to the existence of construction management and worker morale issues that cannot be clearly linked to safety requirements.

Lessons for the future

The researchers next used their models in a prospective study of approaches that might help to reduce nuclear plant construction costs in the future. In particular, they examined whether the variables representing the low-level mechanisms at work in the past could be addressed through innovation. They looked at three scenarios, each of which assumes a set of changes to the variables in the cost model relative to their values in 2017.

In the first scenario, they assume that cost improvement occurs broadly. Specifically, all variables change by 20% in a cost-reducing direction. While they note that such across-the-board changes are meant to represent a hypothetical and not a realistic scenario, the analysis shows that reductions in the use of rebar (the steel bars in reinforced concrete) and in steelworker wages are most influential, together causing 40% of the overall reduction in direct costs.

In the second scenario, they assume that on-site productivity increases due to the adoption of advanced manufacturing and construction management techniques. Scenario 2 reduces costs by 34% relative to estimated 2017 costs, primarily due to increased automation and improved management of construction activities, including automated concrete deployment and optimized rebar delivery. However, costs are still 30% above 1976 costs.

The third scenario focuses on advanced construction materials such as high-strength steel and ultra-high-performance concrete, which have been shown to reduce commodity use and improve on-site workflows. This scenario reduces cost by only 37% relative to 2017 levels, in part due to the high cost of the materials involved. And the cost is still higher than it was in 1976.

Decreases in containment building costs due to four high-level mechanisms under three innovation strategies Scenario 1 assumes a 20% improvement in all variables; Scenario 2 increases on-site material deployment rates by using advanced manufacturing and construction management techniques; and Scenario 3 involves use of advanced, high-strength construction materials. All three strategies would require significant R&D investment, but the importance of the other high-level mechanisms varies. For example, “learning-by-doing” is important in Scenario 2 because assumed improvements such as increased automation will require some on-site optimization of robot operation. In Scenario 3, the use of advanced materials is assumed to require changes in building design and workflows, but those changes can be planned off-site, so are assigned to R&D and “knowledge spillovers.”

To figure out the high-level mechanisms that influenced those outcomes, the researchers again assigned the low-level mechanisms to high-level mechanisms, in this case including “learning-by-doing” as well as “knowledge spillovers,” which accounts for the transfer of external innovations to the nuclear industry. As shown above, the importance of the mechanisms varies from scenario to scenario. But in all three, R&D would have to play a far more significant role in affecting costs than it has in the past.

Analysis of the scenarios suggests that technology development to reduce commodity usage and to automate construction could significantly reduce costs and increase resilience to changes in regulatory requirements and on-site conditions. But the results also demonstrate the challenges in any effort to reduce nuclear plant construction costs. The cost of materials is highly influential, yet it is one of the variables most constrained by safety standards, and—in general—materials-related cost reductions are limited by the large-scale dimensions and labor intensity of nuclear structures.

Nevertheless, there are reasons to be encouraged by the results of the analyses. They help explain the constant cost overruns in nuclear construction projects and also demonstrate new tools that engineers can use to predict how design changes will affect both hardware- and non-hardware-related costs in this and other technologies. In addition, the work has produced new insights into the process of technology development and innovation. “Using our approach, researchers can explore scenarios and new concepts, such as microreactors and small modular reactors,” says Trancik. “And it may help in the engineering design of other technologies with demanding and changeable on-site construction and performance requirements.” Finally, the new technique can help guide R&D investment to target areas that can deliver real-world cost reductions and further the development and deployment of various technologies, including nuclear power and others that can help in the transition to a low-carbon energy future.

Water on terrestrial planets of the Solar System

From Wikipedia, the free encyclopedia https://en.wikipedia.org/wiki/Water_on_terrestrial_planets_of_the_Solar_S...