Search This Blog

Monday, February 5, 2024

Symbolic racism

From Wikipedia, the free encyclopedia
https://en.wikipedia.org/wiki/Symbolic_racism

Symbolic racism (also known as modern-symbolic racism, modern racism, symbolic prejudice, and racial resentment) is a coherent belief system that reflects an underlying one-dimensional prejudice towards a racialized ethnicity. These beliefs include the stereotype that black people are morally inferior to white people, and that black people violate traditional White American values such as hard work and independence. However, symbolic racism is more of a general term than it is one specifically related to prejudice towards black people. These beliefs may cause the subject to discriminate against black people and to justify this discrimination. Some people do not view symbolic racism as prejudice since it is not linked directly to race but is indirectly linked through social and political issues.

David O. Sears and P.J. Henry characterize symbolic racism as the expression or endorsement of four specific themes or beliefs:

  1. Black people no longer face much prejudice or discrimination.
  2. The failure of black people to progress results from their unwillingness to work hard enough.
  3. Black people are demanding too much too fast.
  4. Black people have gotten more than they deserve.

Symbolic racism is a form of modern implicit racism, as it is more subtle and indirect than more overt forms of racism, such as Jim Crow laws. As symbolic racism develops through socialization and its processes occur without conscious awareness, an individual with symbolically racist beliefs may genuinely oppose racism and believe they are not racist. Symbolic racism is perhaps the most prevalent contemporary form of racism.

The concept of symbolic racism has been criticized for being inconsistent in measurement and concept over time. New experiments also provide evidence that responses do not differ when groups other than African Americans are referenced.

Definition

In the aftermath of the Civil Rights Movement, old-fashioned racism declined along with segregation in the United States. Some people believe that newer forms of racism began to replace older forms of racism. Symbolic racism is a term that was coined by David Sears and John McConahay in 1973 to explain why most White Americans supported principles of equality for Black Americans, but less than half were willing to support programs designed to implement these principles. The original theory described three definitive aspects of symbolic racism:

  1. A new form of racism had replaced old-fashioned Jim Crow racism, as it was no longer popular and could no longer be influential in politics, as only a small minority still accepted it.
  2. Opposition to black politicians and racially targeted policies is more influenced by symbolic racism than by any perceived or true threat to whites' own personal lives.
  3. The origins of this form of racism lay in early-socialized negative feelings about blacks associated with traditional conservative values.

The concept of symbolic racism has evolved over time, but most writings currently define symbolic racism as containing four themes:

  1. Racial discrimination is no longer a serious obstacle to black people's prospects for a good life.
  2. Black people's continuing disadvantages are largely due to their unwillingness to work hard enough.
  3. Black people's continuing demands are unwarranted.
  4. Black people's increased advantages are also unwarranted.

History

The term symbolic racism was first implemented in the 1970s, as a way to describe discrimination against blacks post-Jim Crow. It was used to differentiate between older, more overt forms of racism and newer forms of discrimination. Attacks on busing shortly after integration of schools became widespread have been posited as early examples of symbolic racism. However, Kinder has stated that older forms of racism are still prevalent in modern society.

Following the Jim Crow era, when older, overtly racist business practices were outlawed, some turned to more discreet methods of racism. While realtors in the late 1960s and early 1970s could no longer outright deny selling a home to a black person because they were black, they often gave the black person a higher price point than they would have if they were a white person.

Discrimination also pervaded loan offices, where black people continued to be less likely to get a meeting with a loan officer, less likely to be approved for a loan, and less likely to receive all the necessary information.

In 1981, Howard Schuman replicated a study originally performed in 1950 to test discrimination in New York City restaurants on the Upper East Side. He discovered only minor changes in discrimination levels.

Terminology

The term symbolic racism derives from the fact that the opinions expressed characterize black people as an abstract group ("as in the anonymous 'they' in 'if they would only…'") rather than as specific individuals. People hold prejudices because of the cultural stereotypes attributed to the group rather than because of any personal individual experience with the group in question. Researchers have given the concept of symbolic racism many different names, usually to emphasize one aspect over another. These names include modern racism, racial resentment, and laissez-faire racism. While slight differences exist between the different terms, all share the same bottom line of prejudice towards black people.

While similar in nature, symbolic racism is distinguished from aversive racism based on the relationships between the defining characteristics. Aversive racism involves "separate, disassociated positive and negative components, which are in conflict, and thus, may sometimes be experienced as ambivalence." Symbolic racism, on the other hand, "reflects the unique assimilation of individualistic values and negative racial affect." The components of aversive racism remain disassociated within the individual; whereas, the components of symbolic racism blend to produce racial attitudes. While both types of racism predict similar behavior, they are the consequences of different processes.

Causes

Whitley and Kite cite six underlying factors that contribute to symbolic racism. They are to this day believed to have been some of the biggest influences on modern racism.

  1. Implicitly anti-black affect and negative stereotypes.
  2. Racialized belief in traditional values.
  3. Belief in equality of opportunity.
  4. Low belief in equality of outcome.
  5. Group self-interest.
  6. Low knowledge of black people.

According to Whitley and Kite, those who hold symbolic racist beliefs tend to hold implicitly negative attitudes, most likely gained in childhood, towards black people that may or may not be conscious. These attitudes may not be characterized by outright hatred but rather fear, disgust, anger, contempt, etc. In addition, those who hold symbolically racist beliefs may also believe in traditional American values such as hard work, individuality, and self-restraint. However, these beliefs become racialized.

Many people believe that black individuals do not hold or act in accordance with these values but that they instead rely on public assistance, seek government favors, and act impulsively. As Whitley and Kite note, "The fact that White people also accept public assistance, seek government favors, and act impulsively is not relevant to people with symbolic prejudice; it is their perception (usually in stereotypic terms) of Black people's behavior that they focus on." Furthermore, those with symbolic prejudice tend to believe in the equality of opportunity, which includes access to resources such as education, housing, and employment. However, they tend not to believe in equality of outcome. This explains how people can support the principle of racial equality but not support initiatives to achieve it, such as affirmative action. Government intervention when individuals do not have the same talent, effort, or historical background would violate traditional values of equality of opportunity. Thus, "people can simultaneously endorse equality of opportunity and reject government intervention to bring about equality of outcome." Finally, Whitley and Kite state most whites do not have extensive personal experience with black people, so the negative stereotypes they hold about blacks do not have the opportunity to be dispelled.

Evidence

Measures

Much of the initial research conducted by researchers on symbolic racism utilized McConahay's (1986) modern racism scale (MRS). However, citing a number of measurement problems, Sears and Henry published the Symbolic Racism 2000 (SR2K) Scale in 2002 in the journal Political Psychology. It consists of a series of statements relating to race and politics in which participants must state their degree of agreement on a scale ranging from "strongly disagree" to "strongly agree". Statements included on surveys by the American National Election Studies and most commonly used in political science research include:

  • Irish, Italians, Jewish, and many other minorities overcame prejudice and worked their way up. Blacks should do the same without any special favors.
  • Generations of slavery and discrimination have created conditions that make it difficult for Blacks to work their way out of the lower class.
  • Over the past few years, Blacks have gotten less than they deserve.
  • It's really a matter of some people not trying hard enough; if Blacks would only try harder they could be just as well off as Whites.

This updated scale attempted to address the issues with previous forms of measurement including internal reliability, construct validity, predictive validity, and discriminant validity, and generalizability.

Examples

Bobocel et al. (1998) found that prejudice can be rationalized as a concern for justice. Opposition to preferential affirmative action programs (which assign more weight to certain demographics and give preference to target groups) was uniquely predicted by an individual's belief in merit principles. That is, regardless of prejudice level, individuals tend to oppose preferential treatment programs because they violate traditional norms of meritocracy. However, the higher an individual's level of prejudice, the more likely he was to construe an undefined affirmative action program (e. g. not necessarily preferential) as violating the merit principle and, in turn, oppose the undefined affirmative action program. These high-prejudice individuals were able to rationalize their prejudice as a concern for justice, although no traditional justice norms had been explicitly violated. In this way, symbolic racism functions through rationalization as a concern for traditional norms without conscious awareness.

Public opinion researchers polled White Americans in the early 1970s on their backing for racial equality and their support for government intervention that would enforce that equality. The results revealed high levels of support from White Americans, ranging from 75% to nearly 100%, regarding the principles for school integration, equal opportunity employment, and open housing. Support from the same White Americans was significantly lower regarding the implementation of more abstract principles at approximately 50%.

College students who had completed a modern-symbolic prejudice measure early in the semester evaluated the résumés of 10 job applicants. The applicants consisted of three qualified black people, two qualified white people, and five unqualified white people. The students were split into two groups - one containing students rated high in modern-symbolic prejudice and one containing students rated low in this same attribute. Each student received a memo from the president of the company. Half of the students received memos in which the president of the company asked the student to abstain from hiring a worker of a minority group because the person hired would be dealing mainly with white employees. The memo for the second group did not contain this message. The group that did not receive any instructions from the president of the company recommended a black candidate 61% of the time, regardless of the individual's modern-symbolic prejudice rating. In the group that had received justification from the president to abstain from minority hiring, 37% of the students that were low in modern-symbolic prejudice recommended a black candidate, whereas only 18% of the students high in modern-symbolic prejudice recommended a black candidate. These results suggest that symbolic prejudice is expressed most strongly when non-explicitly racist justifications are given for discriminatory action.

Other applications

While symbolic racism was originally conceptualized as a prejudice specifically against black people in the United States, scholars have expanded the concept to apply to other groups and locales. In the United States, research has been conducted on symbolic racism as it relates to Latinos and Asians, as well as modern sexism, anti-fat bias, and heterosexism. For example, Mingying Fu conducted an experiment in which symbolic racism was shown to influence attitudes toward out-group members and racial policies. In addition, Fu found that symbolic racism was the strongest predictor of white as well as Asian and Latino opposition to affirmative action after controlling for biological racism and ideology.

Fraser and Islam (2007) applied the concept of symbolic racism to the Aborigines and European Australians in Australia. In this context, the Australian version of the symbolic racism construct is defined as "the use of affective responses and beliefs that are well accepted within a dominant majority racial group as justifying its advantaged position". They measured the relationship between racial prejudice and support for Pauline Hanson's One Nation Party using two postal surveys based on a random sampling of names from electoral registers. Support for Hanson and voting for the One Nation Party were strongly related to a measure of symbolic racism. The study also found a relationship between symbolic racism and a measure of relational orientation, or concern over the position of one's own racial group relative to other racial groups. Fraser and Islam state that this finding suggests that beliefs influenced by symbolic racism may be motivated by social identity-related processes, "where white European Australians regard their culture as the real, mainstream Australian culture, and resent special concessions to groups such as Aborigines and Asian migrants, whom they exclude from their narrow self-identity as Australians."

Examples of symbolic racism also exist in Europe. McLaren (2002) argues that people are hostile towards the European integration due to their perceptions of threats posed by other cultures. In this study, the independent variables to be gauged were the realistic and symbolic perceptions. The response choices for the questions given to his participants were dichotomous for each of these variables. The choices were:

  • People from [these] minority groups abuse the system of social benefits.
  • The religious practices of people from [these] minority groups threaten our way of life.

The findings suggest that perceived cultural threats appeared to have a strong sway on the attitudes toward the European Union. It was concluded that attitudes toward the European Union were largely based on a general hostility towards other cultures.

Consequences

Symbolic racism may have implications for legal policies. Green et al. (2006) found a positive correlation between symbolic racism and more severe crime policies, such as capital punishment and three-strikes laws, and a negative relationship with policies that are intended to assist criminals such as inmate education.

Individual prejudices and opposition to programs to eliminate inequality of outcomes may contribute to institutional racism, which in turn leads to continued racial inequality. Additionally, within American society, institutionalized practices have been influenced by structural racism resulting in "the subordination and devaluation of minority groups".

It has been argued that common ways the media framed former U.S. President Barack Obama have helped shaped many audiences' attitudes in ways that support symbolically racist beliefs, such as the idea that America is currently in a post-racial society where discrimination is no longer a concern. When comparing positively framed news stories about Obama to negatively framed news stories about Obama, it was seen in a study of 168 participants that symbolically racist beliefs increased.

Reyna et al. (2009) found that negative attitudes towards rap music are associated with the idea that African Americans are to blame for their economic plights. The type of rap that was looked at was categorized as gangster rap, which is notorious for its violent undertones and explicit language. Additionally, in their second study, they found that anti-rap attitudes are also associated with discrimination towards African Americans. Conversely, when looking at other predominantly black genres of music, such as jazz or gospel music, the same correlations were not found.

Criticisms and controversies

A major criticism is that new experimental studies show that respondents do not answer the questions presented in the paper by Sears and Henry (2002) differently when groups other than African Americans are mentioned in the survey questions. This potentially undermines a primary claim made by Sears and Henry - that their measure of symbolic racism is a blend of "anti-Black affect" and "conservatism". Enos and Carney (2018) write:

Across multiple groups and multiple samples on different survey platforms, we find a strong an consistent pattern: the results obtained using groups other than Blacks are substantially indistinguishable from those measured when Blacks are the target group. Decomposing this measure further, we find that political conservatives express only minor differences in resentment across target groups. Far greater differences in resentment toward Blacks and other groups can be found among racially sympathetic liberals. In short, we find that modern racism questions appear to measure attitudes toward any group, rather than African Americans alone.

One criticism of symbolic racism is that it has been conceptualized and measured inconsistently over time. Sometimes it has been conceptualized as consisting of a single construct and other times as consisting of multiple subdimensions. Most scholars now consistently describe symbolic racism as being composed of the four major components listed by Tarman and Sears. Tarman and Sears posit that consistently defining it as based on those four themes will eliminate the inconsistency problems. The updated symbolic racism scale, Symbolic Racism 2000 (SR2K), is believed to have addressed many issues in measurement inconsistency.

Another criticism is that symbolic racism is not "true" racism but, rather, is a manifestation of conservative political ideology. For instance, if one believes that a group should receive "special favors" they would answer the question in a manner coded as more racially resentful. Tarman and Sears evaluated this claim and concluded that symbolic racism is an independent belief system encompassing discrete attitudes from those of conservatives.

Some scholars have suggested that the focus has moved prematurely from purportedly older forms of racism to modern racism. In a qualitative study, Mellor (2003) conducted interviews with Aboriginal Australians in which he found that many experience racism and that much of it seems to be old-fashioned rather than modern. He argues that social scientists may have embraced forms of modern racism too quickly, which could have negative impacts on minorities by helping to maintain discriminatory social institutions.
Income distribution

From Wikipedia, the free encyclopedia
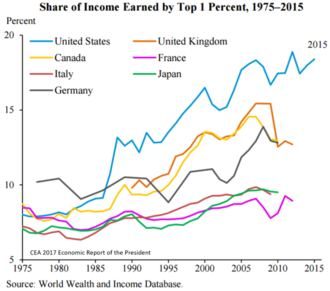
Share of income of the top 1% for selected developed countries, 1975 to 2015

In economics, income distribution covers how a country's total GDP is distributed amongst its population. Economic theory and economic policy have long seen income and its distribution as a central concern. Unequal distribution of income causes economic inequality which is a concern in almost all countries around the world.

About

Classical economists such as Adam Smith (1723–1790), Thomas Malthus (1766–1834), and David Ricardo (1772–1823) concentrated their attention on factor income-distribution, that is, the distribution of income between the primary factors of production (land, labour and capital). Modern economists have also addressed issues of income distribution, but have focused more on the distribution of income across individuals and households. Important theoretical and policy concerns include the balance between income inequality and economic growth, and their often inverse relationship.

The Lorenz curve can represent the distribution of income within a society. The Lorenz curve is closely associated with measures of income inequality, such as the Gini coefficient.

Measurement

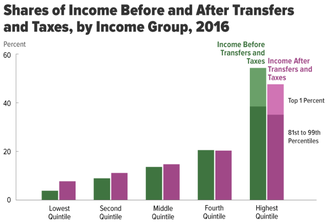
Income before (green) and after (pink) taxes and Transfer payments for different income groups starting with the lowest quintile. Top 20% people take approximately 45% of the all income.

The concept of inequality is distinct from that of poverty and fairness. Income inequality metrics (or income distribution metrics) are used by social scientists to measure the distribution of income, and economic inequality among the participants in a particular economy, such as that of a specific country or of the world in general. While different theories may try to explain how income inequality comes about, income inequality metrics simply provide a system of measurement used to determine the dispersion of incomes.

Limitations

There exist some problems and limitations in the measurement of inequality as there is a large gap between the national accounts (which focus on macroeconomic totals) and inequality studies (which focus on distribution).

The lack of a comprehensive measure about how the pretax income differs from the post-tax income makes hard to assess how government redistribution affects inequality.

There is not a clear view on how long-run trends in income concentration are shaped by the major changes in woman's labour force participation.

Income inequality and its causes

Income inequality is one aspect of economic inequality. Incomes levels can be studied through taxation records and other historical documents. Capital in the Twenty-First Century (2013) by French economist Thomas Piketty is noted for its systematic collection and review of available data, especially concerning income levels; not all aspects of historical wealth distribution are similarly attested in the available records.

Causes of income inequality and of levels of economic equality/inequality include: labor economics, tax policies, other economic policies, labor union policies, Federal Reserve monetary policies & fiscal policies, the market for labor, abilities of individual workers, technology and automation, education, globalization, gender bias, racism, and culture.

How to improve income inequality

Taxes

The progressive income tax takes a larger percentage of high incomes and a smaller percentage of low incomes. Effectively, the poorest pay the least of their earned incomes on taxes which allows them to keep a larger percentage of wealth. Justification can be illustrated by a simple heuristic: The same dollar amount of money (e.g. $100) has a greater economic impact on only one party—the poor. That same amount has little economic impact on a wealthy individual, so the disparity is addressed by ensuring the richest individuals are taxed a greater share of their wealth. The state then uses the tax revenue to find necessary and beneficial activities for the society at large. Every person in this system would have access to the same social benefits, but the rich pay more for it, so progressive tax significantly reduces the inequality.

In-kind transfers

If a cash is given to a poor person, he or she may not make "the best" choice in case, what to buy for this extra money. Then, there is the solution in form of the food stamps or directly the food as an in-kind transfer to the poorest.

Housing subsidies

The rent and upkeep of housing form a large portion of spending in the lower income families. Housing subsidies were designed to help the poor obtaining adequate housing.

Welfare and Unemployment benefits

This provides actual money to the people with very low or no income and gives them an absolute freedom in decision-making how to use this benefit. This works best if we assume that they are rational and make decisions in their best interest.

Income mobility

Income mobility is another factor in the study of income inequality. It describes how people change their economic well-being, i.e. move in the hierarchy of earning power over their lifetime. When someone improves his economic situation, this person is considered upwardly mobile. Mobility can vary between two extremes: 1) rich people stay always rich and poor stay always poor: people cannot easily change their economic status and inequality then seems as a permanent problem. 2) individuals can easily shift their income class, e.g. from middle earning class to upper class or from lower class to middle class. Inequality is "fluid" and temporary so it does not create a serious permanent problem.

Measuring income mobility

Mobility is measured by the association between parents´ and adult children's socioeconomic standing, where higher association means less mobility. Socioeconomic standing is captured by four different measures:

  1. Occupational status: – it is weighted average of the mean level of earnings and education of certain occupations. It has advantages such a collecting important information about parents, which can be reported retrospectively by adult children. It also remains relatively stable in between the occupation career so single measuring provides adequate information of long run standing. On the other hand, it has also limitations for the mobility analyzing. Whereas occupational earning of men usually tends to be higher than by women, by the occupational education it is the other way around.
  2. Class mobility: – Classes are instead categorical groupings based on specific occupational assets that determine life chances as expressed in outcomes such as income, health or wealth.
  3. Earnings mobility: – Earning mobility evaluates the relationship between two certain generations by means of linear regression (upper math) of the long transformed measure of children's and parents' earnings.
  4. Total family income mobility and the mobility of women: – Old economic analysis has been making one mistake, that they did analysis that focused mostly on the father-son pairs and their individual earnings. In the last two decades, they have expanded their research and now they focus more on the mother-daughter pairs as well. Generally earnings provides a stable measure of well-being independently of another financial assets or any kind of transfers.

Distribution measurement internationally

Using Gini coefficients, several organizations, such as the United Nations (UN) and the US Central Intelligence Agency (CIA), have measured income inequality by country. The Gini index is also widely used within the World Bank. It is an accurate and reliable index for measuring income distribution on a country by country level. The Gini index measurements go from 0 to 1 for 1 being perfect inequality and 0 being perfect equality. The world Gini index is measured at 0.52 as of 2016.

2018 World gini Index

The World Inequality Lab at the Paris School of Economics published in December 2017 the World Inequality Report 2018 that provides estimates of global income and wealth inequality.

Trends

Idealized hypothetical Kuznets curve

Standard economic theory stipulates that inequality tends to increase over time as a country develops, and to decrease as a certain average income is attained. This theory is commonly known as the Kuznets curve after Simon Kuznets. However, many prominent economists disagree with the need for inequality to increase as a country develops. Further, empirical data on the proclaimed subsequent decrease of inequality is conflicting.

Across the board, a number of industries are stratified across the genders. This is the result of a variety of factors. These include differences in education choices, preferred job and industry, work experience, number of hours worked, and breaks in employment (such as for bearing and raising children). Men also typically go into higher paid and higher risk jobs when compared to women. These factors result in 60% to 75% difference between men's and women's average aggregate wages or salaries, depending on the source. Various explanations for the remaining 25% to 40% have been suggested, including women's lower willingness and ability to negotiate salary and sexual discrimination. According to the European Commission direct discrimination only explains a small part of gender wage differences.

A study by the Brandeis University Institute on Assets and Social Policy which followed the same sets of families for 25 years found that there are vast differences in wealth across racial groups in the United States. The wealth gap between Caucasian and African-American families studied nearly tripled, from $85,000 in 1984 to $236,500 in 2009. The study concluded that factors contributing to the inequality included years of home ownership (27%), household income (20%), education (5%), and familial financial support and/or inheritance (5%). In an analysis of the American Opportunity Accounts Act, a bill to introduce Baby Bonds, Morningstar reported that by 2019 white families had more than seven times the wealth of the average Black family, according to the Survey of Consumer Finances.

There are two ways of looking at income inequality, within country inequality (intra-country inequality) – which is inequality within a nation; or between country inequality (inter-country inequality) which is inequality between countries.

According to intra-country inequality at least in the OECD countries, a May 2011 report by OECD stated that the gap between rich and poor within OECD countries (most of which are "high income" economies) "has reached its highest level for over 30 years, and governments must act quickly to tackle inequality".

Furthermore, increased inter-country income inequality over a long period is conclusive, with the Gini coefficient (using PPP exchange rate, unweighted by population) more than doubling between 1820 and the 1980s from .20 to .52 (Nolan 2009:63). However, scholars disagree about whether inter-country income inequality has increased (Milanovic 2011), remained relatively stable (Bourguignon and Morrisson 2002), or decreased (Sala-i-Martin, 2002) since 1980. What Milanovic (2005)  calls the “mother of all inequality disputes” emphasizes this debate by using the same data on Gini coefficient from 1950 to 2000 and showing that when countries’ GDP per capita incomes are unweighted by population income inequality increases, but when they are weighted inequality decreases. This has much to do with the recent average income rise in China and to some extent India, who represent almost two-fifths of the world. Notwithstanding, inter-country inequality is significant, for instance as a group the bottom 5% of US income distribution receives more income than over 68 percent of the world, and of the 60 million people that make up the top 1% of income distribution, 50 million of them are citizens of Western Europe, North America or Oceania (Milanovic 2011:116,156).

Larry Summers estimated in 2007 that the lower 80% of families were receiving $664 billion less income than they would be with a 1979 income distribution, or approximately $7,000 per family. Not receiving this income may have led many families to increase their debt burden, a significant factor in the 2007–2009 subprime mortgage crisis, as highly leveraged homeowners suffered a much larger reduction in their net worth during the crisis. Further, since lower income families tend to spend relatively more of their income than higher income families, shifting more of the income to wealthier families may slow economic growth.

In a TED presentation shown here Archived 2014-03-01 at the Wayback Machine, Hans Rosling presented the distribution and change in income distribution of various nations over the course of a few decades along with other factors such as child survival and fertility rate.

As of 2018, Albania has the smallest gap in wealth distribution with Zimbabwe having the largest gap in wealth distribution.

Income distribution in different countries

Thailand

  • Thailand has been ranked the world's third most unequal nation after Russia and India, with a widening gap between rich and poor according to Oxfam in 2016. A study by Thammasat University economist Duangmanee Laovakul in 2013 showed that the country's top 20 land owners owned 80 percent of the nation's land. The bottom 20 owned only 0.3 percent. Among those having bank deposits, 0.1 percent of bank accounts held 49 per cent of total bank deposits. As of 2019, Thai per capita income is US$8,000 a year. The government aims to raise it to US$15,000 (498,771 baht) per year, driven by average GDP growth of five to six percent. Under the 20-year national plan stretching out to 2036, the government intends to narrow the income disparity gap to 15 times, down from 20 times in 2018.

United States

2011: In the United States, income has become distributed more unequally over the past 30 years, with those in the top quintile (20 percent) earning more than the bottom 80 percent combined.

2019: The wealthiest 10% of American households control nearly 75% of household net worth.

  • Post-tax Gini coefficient: 0.39.
  • Unemployment rate: 4.4%.
  • GDP per capita: $53 632.
  • Poverty rate: 11.1%.

Low unemployment rate and high GDP are signs of the health of the U.S. economy. But there is almost 18% of people living below the poverty line and the Gini coefficient is quite high. That ranks the United States 9th income inequal in the world.

The U.S. has the highest level of income inequality among its (post-)industrialized peers. When measured for all households, U.S. income inequality is comparable to other developed countries before taxes and transfers, but is among the highest after taxes and transfers, meaning the U.S. shifts relatively less income from higher income households to lower income households. In 2016, average market income was $15,600 for the lowest quintile and $280,300 for the highest quintile. The degree of inequality accelerated within the top quintile, with the top 1% at $1.8 million, approximately 30 times the $59,300 income of the middle quintile.

The economic and political impacts of inequality may include slower GDP growth, reduced income mobility, higher poverty rates, greater usage of household debt leading to increased risk of financial crises, and political polarization. Causes of inequality may include executive compensation increasing relative to the average worker, financialization, greater industry concentration, lower unionization rates, lower effective tax rates on higher incomes, and technology changes that reward higher educational attainment.

United Kingdom

Inequality in the UK has been very high in the past, and did not change much until the onset of industrialization. Incomes used to be remarkably concentrated pre-industrial evolution: up to 40% of total income went into the pockets of the richest 5%. In the more recent years income distribution is still an issue. The UK experienced a large increase in inequality during the 1980s—the incomes of the highest deciles increase while everyone else was stagnant. Uneven growth in the years leading up to 1991 meant further increases in inequality. Throughout the 1990s and 2000s, more even growth across the distribution meant little changes in inequality, with rising incomes for everybody. In sight of Brexit, there is more predicted income distribution discrepancies between wages.

2019: The United Kingdom was doing a lot to reduce one of the widest gap between rich and poor citizens, what has led to getting on the 13th place in the ranking of income inequality in the world.

  • Post-tax Gini coefficient: 0.35.
  • Unemployment rate: 4.3%.
  • GDP per capita: $39 425.
  • Poverty rate: 11.1%.

Russia

  • Post-tax Gini coefficient: 0.38.
  • Unemployment rate: 5.2%.
  • GDP per capita: $24 417.
  • Poverty rate: NA.

Occupying the 11th place in the ranking of income inequality in the world. USA TODAY stated: "Russia has a Corruption Perceptions Index score of 28 – tied for the worst among OECD member states and affiliates and one of the lowest in the world. " The cause of the income gap are the close connections of Russian oligarchs and the government, thanks to these relationships oligarchs get lucrative business deals and earn more and more money.

South Africa

  • Post-tax Gini coefficient: 0.62.
  • Unemployment rate: 27.3%.
  • GDP per capita: $12 287.
  • Poverty rate: 26.6%.

The highest income inequality is in the South Africa, based on 2019 data. It is due to the recent policy of apartheid. There were huge differences between white and the other people, not only in wages, but also in the place they can enter and so on.

Development of income distribution as a stochastic process

It is difficult to create a realistic and not complicated theoretical model, because the forces determining the distribution of income (DoI) are varied and complex and they continuously interact and fluctuate.

In a model by Champernowne, the author assumes that the income scale is divided into an enumerable infinity of income ranges, which have uniform proportionate distribution. The development through time of the DoI between ranges is regarded to be a stochastic process. The income of any person in one year may depend on the income in the previous year and on a chance of progress. Assuming that to every "dying" income receiver, there is an heir to his or her income in the following year, and vice versa. This implies that the number of incomes is constant through time.

Under these assumptions any historical development of the DoI can be described by the following vectors and matrices.

  • ... number of the income receivers in range r = 1, 2, ... in the initial year
  • ... matrix, that contains proportions of the occupants of r-th range in the year shifted to the s-th range in the following year

The vector of the DoI can be expressed as

The elements of proportion matrices can be estimated from historical data.

Dot-com bubble

From Wikipedia, the free encyclopedia
https://en.wikipedia.org/wiki/Dot-com_bubble
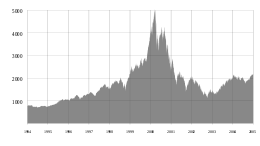
The NASDAQ Composite index spiked in 2000 and then fell sharply as a result of the dot-com bubble.
Quarterly U.S. venture capital investments, 1995–2017

The dot-com bubble (or dot-com boom) was a stock market bubble that ballooned during the late-1990s and peaked on Friday, March 10, 2000. This period of market growth coincided with the widespread adoption of the World Wide Web and the Internet, resulting in a dispensation of available venture capital and the rapid growth of valuations in new dot-com startups.

Between 1995 and its peak in March 2000, investments in the NASDAQ composite stock market index rose 800%, only to fall 78% from its peak by October 2002, giving up all its gains during the bubble.

During the dot-com crash, many online shopping companies, notably Pets.com, Webvan, and Boo.com, as well as several communication companies, such as Worldcom, NorthPoint Communications, and Global Crossing, failed and shut down. Others, like Lastminute.com, MP3.com and PeopleSound remained through its sale and buyers acquisition. Larger companies like Amazon and Cisco Systems lost large portions of their market capitalization, with Cisco losing 80% of its stock value.

Background

Historically, the dot-com boom can be seen as similar to a number of other technology-inspired booms of the past including railroads in the 1840s, automobiles in the early 20th century, radio in the 1920s, television in the 1940s, transistor electronics in the 1950s, computer time-sharing in the 1960s, and home computers and biotechnology in the 1980s.

Overview

Low interest rates in 1998–99 facilitated an increase in start-up companies. Although a number of these new entrepreneurs had realistic plans and administrative ability, most of them lacked these characteristics but were able to sell their ideas to investors because of the novelty of the dot-com concept.

In 2000, the dot-com bubble burst, and many dot-com startups went out of business after burning through their venture capital and failing to become profitable. However, many others, particularly online retailers like eBay and Amazon, blossomed and became highly profitable. More conventional retailers found online merchandising to be a profitable additional source of revenue. While some online entertainment and news outlets failed when their seed capital ran out, others persisted and eventually became economically self-sufficient. Traditional media outlets (newspaper publishers, broadcasters and cablecasters in particular) also found the Web to be a useful and profitable additional channel for content distribution, and an additional means to generate advertising revenue. The sites that survived and eventually prospered after the bubble burst had two things in common: a sound business plan, and a niche in the marketplace that was, if not unique, particularly well-defined and well-served.

In the aftermath of the dot-com bubble, telecommunications companies had a great deal of overcapacity as many Internet business clients went bust. That, plus ongoing investment in local cell infrastructure kept connectivity charges low, and helped to make high-speed Internet connectivity more affordable. During this time, a handful of companies found success developing business models that helped make the World Wide Web a more compelling experience. These include airline booking sites, Google's search engine and its profitable approach to keyword-based advertising, as well as eBay's auction site and Amazon.com's online department store. The low price of reaching millions worldwide, and the possibility of selling to or hearing from those people at the same moment when they were reached, promised to overturn established business dogma in advertising, mail-order sales, customer relationship management, and many more areas. The web was a new killer app—it could bring together unrelated buyers and sellers in seamless and low-cost ways. Entrepreneurs around the world developed new business models, and ran to their nearest venture capitalist. While some of the new entrepreneurs had experience in business and economics, the majority were simply people with ideas, and did not manage the capital influx prudently. Additionally, many dot-com business plans were predicated on the assumption that by using the Internet, they would bypass the distribution channels of existing businesses and therefore not have to compete with them; when the established businesses with strong existing brands developed their own Internet presence, these hopes were shattered, and the newcomers were left attempting to break into markets dominated by larger, more established businesses.

The dot-com bubble burst in March 2000, with the technology heavy NASDAQ Composite index peaking at 5,048.62 on March 10 (5,132.52 intraday), more than double its value just a year before. By 2001, the bubble's deflation was running full speed. A majority of the dot-coms had ceased trading, after having burnt through their venture capital and IPO capital, often without ever making a profit. But despite this, the Internet continues to grow, driven by commerce, ever greater amounts of online information, knowledge, social networking and access by mobile devices.

Prelude to the bubble

The 1993 release of Mosaic and subsequent web browsers during the following years gave computer users access to the World Wide Web, popularizing use of the Internet. Internet use increased as a result of the reduction of the "digital divide" and advances in connectivity, uses of the Internet, and computer education. Between 1990 and 1997, the percentage of households in the United States owning computers increased from 15% to 35% as computer ownership progressed from a luxury to a necessity. This marked the shift to the Information Age, an economy based on information technology, and many new companies were founded.

At the same time, a decline in interest rates increased the availability of capital. The Taxpayer Relief Act of 1997, which lowered the top marginal capital gains tax in the United States, also made people more willing to make more speculative investments. Alan Greenspan, then-Chair of the Federal Reserve, allegedly fueled investments in the stock market by putting a positive spin on stock valuations. The Telecommunications Act of 1996 was expected to result in many new technologies from which many people wanted to profit.

The bubble

As a result of these factors, many investors were eager to invest, at any valuation, in any dot-com company, especially if it had one of the Internet-related prefixes or a ".com" suffix in its name. Venture capital was easy to raise. Investment banks, which profited significantly from initial public offerings (IPO), fueled speculation and encouraged investment in technology. A combination of rapidly increasing stock prices in the quaternary sector of the economy and confidence that the companies would turn future profits created an environment in which many investors were willing to overlook traditional metrics, such as the price–earnings ratio, and base confidence on technological advancements, leading to a stock market bubble. Between 1995 and 2000, the Nasdaq Composite stock market index rose 400%. It reached a price–earnings ratio of 200, dwarfing the peak price–earnings ratio of 80 for the Japanese Nikkei 225 during the Japanese asset price bubble of 1991. In 1999, shares of Qualcomm rose in value by 2,619%, 12 other large-cap stocks each rose over 1,000% in value, and seven additional large-cap stocks each rose over 900% in value. Even though the Nasdaq Composite rose 85.6% and the S&P 500 rose 19.5% in 1999, more stocks fell in value than rose in value as investors sold stocks in slower growing companies to invest in Internet stocks.

An unprecedented amount of personal investing occurred during the boom and stories of people quitting their jobs to trade on the financial market were common. The news media took advantage of the public's desire to invest in the stock market; an article in The Wall Street Journal suggested that investors "re-think" the "quaint idea" of profits, and CNBC reported on the stock market with the same level of suspense as many networks provided to the broadcasting of sports events.

At the height of the boom, it was possible for a promising dot-com company to become a public company via an IPO and raise a substantial amount of money even if it had never made a profit—or, in some cases, realized any material revenue. People who received employee stock options became instant paper millionaires when their companies executed IPOs; however, most employees were barred from selling shares immediately due to lock-up periods. The most successful entrepreneurs, such as Mark Cuban, sold their shares or entered into hedges to protect their gains. Sir John Templeton successfully shorted many dot-com stocks at the peak of the bubble during what he called "temporary insanity" and a "once-in-a-lifetime opportunity". He shorted stocks just before the expiration of lockup periods ending six months after initial public offerings, correctly anticipating many dot-com company executives would sell shares as soon as possible, and that large-scale selling would force down share prices.

Spending tendencies of dot-com companies

dot-com companies spent most of their investments in marketing efforts. Left: A promotional music CD for the Modo pager, Right: The Pets.com sock puppet

Most dot-com companies incurred net operating losses as they spent heavily on advertising and promotions to harness network effects to build market share or mind share as fast as possible, using the mottos "get big fast" and "get large or get lost". These companies offered their services or products for free or at a discount with the expectation that they could build enough brand awareness to charge profitable rates for their services in the future.

The "growth over profits" mentality and the aura of "new economy" invincibility led some companies to engage in lavish spending on elaborate business facilities and luxury vacations for employees. Upon the launch of a new product or website, a company would organize an expensive event called a dot-com party.

Bubble in telecom

In the five years after the American Telecommunications Act of 1996 went into effect, telecommunications equipment companies invested more than $500 billion, mostly financed with debt, into laying fiber optic cable, adding new switches, and building wireless networks. In many areas, such as the Dulles Technology Corridor in Virginia, governments funded technology infrastructure and created favorable business and tax law to encourage companies to expand. The growth in capacity vastly outstripped the growth in demand. Spectrum auctions for 3G in the United Kingdom in April 2000, led by Chancellor of the Exchequer Gordon Brown, raised £22.5 billion. In Germany, in August 2000, the auctions raised £30 billion. A 3G spectrum auction in the United States in 1999 had to be re-run when the winners defaulted on their bids of $4 billion. The re-auction netted 10% of the original sales prices. When financing became hard to find as the bubble burst, the high debt ratios of these companies led to bankruptcy. Bond investors recovered just over 20% of their investments. However, several telecom executives sold stock before the crash including Philip Anschutz, who reaped $1.9 billion, Joseph Nacchio, who reaped $248 million, and Gary Winnick, who sold $748 million worth of shares.

Bursting the bubble

Historical government interest rates in the United States

Nearing the turn of the 2000s, spending on technology was volatile as companies prepared for the Year 2000 problem. There were concerns that computer systems would have trouble changing their clock and calendar systems from 1999 to 2000 which might trigger wider social or economic problems, but there was virtually no impact or disruption due to adequate preparation. Spending on marketing also reached new heights for the sector: Two dot-com companies purchased ad spots for Super Bowl XXXIII, and 17 dot-com companies bought ad spots the following year for Super Bowl XXXIV.

On January 10, 2000, America Online, led by Steve Case and Ted Leonsis, announced a merger with Time Warner, led by Gerald M. Levin. The merger was the largest to date and was questioned by many analysts. Then, on January 30, 2000, 12 ads of the 61 ads for Super Bowl XXXIV were purchased by dot-coms (sources state ranges from 12 up to 19 companies depending on the definition of dot-com company). At that time, the cost for a 30-second commercial was between $1.9 million and $2.2 million.

Meanwhile, Alan Greenspan, then Chair of the Federal Reserve, raised interest rates several times; these actions were believed by many to have caused the bursting of the dot-com bubble. According to Paul Krugman, however, "he didn't raise interest rates to curb the market's enthusiasm; he didn't even seek to impose margin requirements on stock market investors. Instead, [it is alleged] he waited until the bubble burst, as it did in 2000, then tried to clean up the mess afterward". Finance author and commentator E. Ray Canterbery agreed with Krugman's criticism.

On Friday March 10, 2000, the NASDAQ Composite stock market index peaked at 5,048.62. However, on March 13, 2000, news that Japan had once again entered a recession triggered a global sell off that disproportionately affected technology stocks. Soon after, Yahoo! and eBay ended merger talks and the Nasdaq fell 2.6%, but the S&P 500 rose 2.4% as investors shifted from strong performing technology stocks to poor performing established stocks.

On March 20, 2000, Barron's featured a cover article titled "Burning Up; Warning: Internet companies are running out of cash—fast", which predicted the imminent bankruptcy of many Internet companies. This led many people to rethink their investments. That same day, MicroStrategy announced a revenue restatement due to aggressive accounting practices. Its stock price, which had risen from $7 per share to as high as $333 per share in a year, fell $140 per share, or 62%, in a day. The next day, the Federal Reserve raised interest rates, leading to an inverted yield curve, although stocks rallied temporarily.

Tangentially to all of speculation, Judge Thomas Penfield Jackson issued his conclusions of law in the case of United States v. Microsoft Corp. (2001) and ruled that Microsoft was guilty of monopolization and tying in violation of the Sherman Antitrust Act. This led to a one-day 15% decline in the value of shares in Microsoft and a 350-point, or 8%, drop in the value of the Nasdaq. Many people saw the legal actions as bad for technology in general. That same day, Bloomberg News published a widely read article that stated: "It's time, at last, to pay attention to the numbers".

On Friday, April 14, 2000, the Nasdaq Composite index fell 9%, ending a week in which it fell 25%. Investors were forced to sell stocks ahead of Tax Day, the due date to pay taxes on gains realized in the previous year. By June 2000, dot-com companies were forced to reevaluate their spending on advertising campaigns. On November 9, 2000, Pets.com, a much-hyped company that had backing from Amazon.com, went out of business only nine months after completing its IPO. By that time, most Internet stocks had declined in value by 75% from their highs, wiping out $1.755 trillion in value. In January 2001, just three dot-com companies bought advertising spots during Super Bowl XXXV. The September 11 attacks accelerated the stock-market drop. Investor confidence was further eroded by several accounting scandals and the resulting bankruptcies, including the Enron scandal in October 2001, the WorldCom scandal in June 2002, and the Adelphia Communications Corporation scandal in July 2002.

By the end of the stock market downturn of 2002, stocks had lost $5 trillion in market capitalization since the peak. At its trough on October 9, 2002, the NASDAQ-100 had dropped to 1,114, down 78% from its peak.

Aftermath

After venture capital was no longer available, the operational mentality of executives and investors completely changed. A dot-com company's lifespan was measured by its burn rate, the rate at which it spent its existing capital. Many dot-com companies ran out of capital and went through liquidation. Supporting industries, such as advertising and shipping, scaled back their operations as demand for services fell. However, many companies were able to endure the crash; 48% of dot-com companies survived through 2004, albeit at lower valuations.

Several companies and their executives, including Bernard Ebbers, Jeffrey Skilling, and Kenneth Lay, were accused or convicted of fraud for misusing shareholders' money, and the U.S. Securities and Exchange Commission levied large fines against investment firms including Citigroup and Merrill Lynch for misleading investors.

After suffering losses, retail investors transitioned their investment portfolios to more cautious positions. Popular Internet forums that focused on high tech stocks, such as Silicon Investor, Yahoo! Finance, and The Motley Fool declined in use significantly.

Job market and office equipment glut

Layoffs of programmers resulted in a general glut in the job market. University enrollment for computer-related degrees dropped noticeably. Aeron chairs, which retailed for $1,100 each, were liquidated en masse.

Legacy

As growth in the technology sector stabilized, companies consolidated; some, such as Amazon.com, eBay, and Google gained market share and came to dominate their respective fields. The most valuable public companies are now generally in the technology sector.

In a 2015 book, venture capitalist Fred Wilson, who funded many dot-com companies and lost 90% of his net worth when the bubble burst, said about the dot-com bubble:

A friend of mine has a great line. He says "Nothing important has ever been built without irrational exuberance." Meaning that you need some of this mania to cause investors to open up their pocketbooks and finance the building of the railroads or the automobile or aerospace industry or whatever. And in this case, much of the capital invested was lost, but also much of it was invested in a very high throughput backbone for the Internet, and lots of software that works, and databases and server structure. All that stuff has allowed what we have today, which has changed all our lives... that's what all this speculative mania built.

Operator (computer programming)

From Wikipedia, the free encyclopedia https://en.wikipedia.org/wiki/Operator_(computer_programmin...