July 13, 2015 | by Caroline Reid

Life on Earth has always been dependent on the conditions of the
Sun, so scientists spend a lot of time studying its activity. A recent
announcement from solar scientists suggests that the Sun may soon enter a
period of significant reduced activity, possibly causing a mini ice age
by 2030 – just 15 years from now.
These predictions were announced at the National Astronomy Meeting in Llandudno, Wales, so it hasn't been possible to evaluate the research yet. However, Professor Valentina Zharkova from the University of Northumbria who made this announcement claims that the findings come from a computer model of sunspots that has made "unprecedentedly accurate predictions," as reported in The Telegraph.
The model has shown to have a 97% accuracy when mapping the past movements of sunspots, using data of solar cycles from 1976 to 2008. And if this reliability continues, then the model also has some alarming predictions for the future: a mini ice age sometime around the 2030s.
To achieve these findings, the scientists mapped the movement of solar fluid that moves in roughly 11-year cycles, which correspond to weather cycles on Earth. Around the year 2022 (labeled cycle 25), a pair of waves will be moving to the Northern and Southern Hemispheres of the Sun, getting slowly out of synch and reducing solar activity – and thus our warm weather.
"In cycle 26, the two waves exactly mirror each other – peaking at the same time but in opposite hemispheres of the Sun. Their interaction will be disruptive, or they will nearly cancel each other. We predict that this will lead to the properties of a 'Maunder minimum'," said Zharkova.
The Maunder minimum was a 70-year period between 1645 and 1715. The Sun produced barely any sunspots and the Earth experienced a mini ice age. Parts of northern Europe and the United States experienced uncharacteristically cold winters. The river Thames, flowing through London, even froze over for seven weeks and was passable by foot. The surface was so stable that residents could even hold 'frost fairs' on the ice.

Sunspots are relatively 'cool' regions on the Sun that appear darker when photographed. They are cooler than the rest of the Sun, but they are still around 4500 K (4200ºC, 7600ºF). They are caused by a concentration of intense, magnetic field from the Sun. This inhibits and redirects the flow of hot matter to that region and makes it darker – what we call a sunspot.
Sunspots last between 1 to 100 days, during which they rotate around the Sun, following the flow of solar fluid. Sunspots go through cycles of intensity and sparsity based on the motion of the fluid cycles. There are two main waves that are slightly offset over time, producing periods of maximum and minimum solar activity.
"Effectively, when the waves are approximately in phase, they can show strong interaction, or resonance, and we have strong solar activity," Zharkova said.
"When they are out of phase, we have solar minimums. When there is full phase separation, we have the conditions last seen during the Maunder minimum, 370 years ago."
Since our article yesterday about how reduced solar activity could lead to the next little ice age, IFLScience has spoken to the researcher who started the furor: Valentina Zharkova. She announced the findings from her team's research on solar activity last week at the Royal Astronomical Society. She noted that her team didn't realize how much of an impact their research would have on the media, and that it was journalists (including ourselves) who picked up on the possible impact on the climate. However, Zharkova says that this is not a reason to dismiss this research or the predictions about the environment.
“We didn't mention anything about the weather change, but I would have to agree that possibly you can expect it,” she informed IFLScience.
The future predicted activity of the Sun has been likened to the Maunder Minimum. This was a period when the Sun entered an especially inactive period, producing fewer sunspots than usual. This minimum happened at the same time that conditions in Northern America and Europe went unusually icy and cold, a period of time known as the “little ice age.”
The previous Maunder Minimum occurred in the 17th century and lasted between 50 and 60 years. During this time, winters were colder: for example the River Thames, which usually flows through London, notoriously froze over. The ice was so thick that people could walk from one side to the other. However, the citizens that lived in freezing, 17th century Europe survived these cold winters, and they didn't have the heating technology that we are fortunate enough to have today. If the next solar activity minimum does affect the weather on Earth, it will not be deadly for the human race.
Zharkova compared the Maunder Minimum with the one that her team predicted to occur around 15 years into the future. The next minimum will likely be a little bit shorter than the one in the 17th century, only lasting a maximum of three solar cycles (around 30 years).
The conditions during this next predicted minimum will still be chilly: “It will be cold, but it will not be this ice age when everything is freezing like in the Hollywood films,” Zharkova chuckled.
The predictions that Zharkova announced came from a mathematical program that analyzed data from the Sun. The team decided that they wanted to monitor the Sun's background magnetic field (which governs solar features like sunspots). You can see the team's data for cycles 21–23 published in The Astrophysical Journal.
After analyzing the solar data with their model, Zharkova's team noticed something that no one had ever expected before: that the Sun produces the magnetic waves in pairs. Previously everyone had thought that there was only a single source of magnetic waves in the Sun, but the evidence suggested two sources. The team used these observations to predict how the Sun's magnetic field would change in the future. “This is where we predicted this new Maunder minima,” Zharkova added.
She commented on how the changes in the Sun are likely to affect the Earth's environment. “During the minimum, the intensity of solar radiation will be reduced dramatically. So we will have less heat coming into the atmosphere, which will reduce the temperature.”
However, Zharkova ends with a word of warning: not about the cold but about humanity's attitude toward the environment during the minimum. We must not ignore the effects of global warming and assume that it isn't happening. “The Sun buys us time to stop these carbon emissions,” Zharkova says. The next minimum might give the Earth a chance to reduce adverse effects from global warming.
The Maunder Minimum, also known as the "prolonged sunspot minimum", is the name used for the period starting in about 1645 and continuing to about 1715 when sunspots became exceedingly rare, as noted by solar observers of the time.
The term was introduced after John A. Eddy published a landmark 1976 paper in Science.[1] Astronomers before Eddy had also named the period after the solar astronomers Annie Maunder (1868-1947) and E. Walter Maunder (1851–1928) who studied how sunspot latitudes changed with time.[2] The period the husband and wife team examined included the second half of the 17th century. Two papers were published in Edward Maunder's name in 1890 and 1894, and he cited earlier papers written by Gustav Spörer.[3] Due to the social climate of the time, Annie's contribution was not publicly recognized.[4]
Spörer noted that during one 30-year period within the Maunder Minimum observations showed fewer than 50 sunspots, as opposed to a more typical 40,000–50,000 spots in modern times.[5]
Like the Dalton Minimum and Spörer Minimum, the Maunder Minimum coincided with a period of lower-than-average European temperatures.
During the Maunder Minimum enough sunspots were sighted so that 11-year cycles could be extrapolated from the count. The maxima occurred in 1676, 1684, 1695, 1705 and 1716.
The sunspot activity was then concentrated in the southern hemisphere of the Sun, except for the last cycle when the sunspots appeared in the northern hemisphere, too.
According to Spörer's law, at the start of a cycle, spots appear at ever lower latitudes until they average at about latitude 15° at solar maximum. The average then continues to drift lower to about 7° and after that, while spots of the old cycle fade, new cycle spots start appearing again at high latitudes.
The visibility of these spots is also affected by the velocity of the sun's surface rotation at various latitudes:
Visibility is somewhat affected by observations being done from the ecliptic. The ecliptic is inclined 7° from the plane of the Sun's equator (latitude 0°).
The Maunder Minimum roughly coincided with the middle part of the Little Ice Age, during which Europe and North America experienced very cold winters. A causal connection between low sunspot activity and cold European winters has recently been made using the longest existing surface temperature record, the Central England Temperature record [9] and also using the ERA-40 re-analysis dataset.[10] A potential explanation of this has been offered by observations by NASA's Solar Radiation and Climate Experiment, which suggest that solar UV output is more variable over the course of the solar cycle than scientists had previously thought.[11] In 2011, an article was published in the Nature Geoscience journal that uses a climate model with stratospheric layers and the SORCE data to tie low solar activity to jet stream behavior and mild winters in some places (southern Europe and Canada/Greenland) and colder winters in others (northern Europe and the United States).[12] In Europe, examples of very cold winters are 1683-4, 1694-5, and the winter of 1708–9.[13] In such years, River Thames frost fairs were held.
However the Thames ceased to freeze in the 19th century largely because the removal of the "Old" (medieval) London Bridge in 1825 dramatically increased the river's flow into the Pool of London. The original 240–270-metre (800–900 ft) bridge stood upon 19 irregularly spaced arches that were set into the river bed on large starlings. It acted as a weir holding back the slack upstream waters from the tidal brackish, salt water downstream. The construction of Thames Embankment (began 1862) further increased the river's hydrological flow by narrowing the width of waterway through the centre of capital.[original research?]
Note that the term "Little Ice Age" applied to the Maunder minimum is something of a misnomer as it implies a period of unremitting cold (and on a global scale), which is not the case. For example, the coldest winter in the Central England Temperature record is 1683-4, but the winter just 2 years later (both in the middle of the Maunder minimum) was the fifth warmest in the whole 350-year CET record. Furthermore, summers during the Maunder minimum were not significantly different to those seen in subsequent years. The drop in global average temperatures in paleoclimate reconstructions at the start of the Little Ice Age was between about 1560 and 1600, whereas the Maunder minimum began almost 50 years later.[original research?]


Some scientists hypothesize that the dense wood used in Stradivarius instruments was caused by slow tree growth during the cooler period. Instrument maker Antonio Stradivari was born a year before the start of the Maunder Minimum.[14]
Past solar activity may be recorded by various proxies including carbon-14 and beryllium-10.[15] These indicate lower solar activity during the Maunder Minimum. The scale of changes resulting in the production of carbon-14 in one cycle is small (about one percent of medium abundance) and can be taken into account when radiocarbon dating is used to determine the age of archaeological artifacts. The interpretation of the beryllium-10 and carbon-14 cosmogenic isotope abundance records stored in terrestrial reservoirs such as ice sheets and tree rings has been greatly aided by reconstructions of solar and heliospheric magnetic fields based on historic data on Geomagnetic storm activity, which bridge the time gap between the end of the usable cosmogenic isotope data and the start of modern spacecraft data.[16][17]
Other historical sunspot minima have been detected either directly or by the analysis of the cosmogenic isotopes; these include the Spörer Minimum (1450–1540), and less markedly the Dalton Minimum (1790–1820). In a 2012 study, sunspot minima have been detected by analysis of carbon-14 in lake sediments.[18] In total there seem to have been 18 periods of sunspot minima in the last 8,000 years, and studies indicate that the sun currently spends up to a quarter of its time in these minima.
A paper based on an analysis of a Flamsteed drawing, suggests that the Sun's surface rotation slowed in the deep Maunder minimum (1684).[19]
During the Maunder Minimum aurorae had been observed seemingly normally, with a regular decadal-scale cycle.[20][21] This is somewhat surprising because the later, and less deep, Dalton sunspot minimum is clearly seen in auroral occurrence frequency, at least at lower geomagnetic latitudes.[22] Because geomagnetic latitude is an important factor in auroral occurrence, (lower-latitude aurorae requiring higher levels of solar-terrestrial activity) it becomes important to allow for population migration and other factors that may have influenced the number of reliable auroral observers at a given magnetic latitude for the earlier dates.[23] Decadal-scale cycles during the Maunder minimum can also be seen in the abundances of the beryllium-10 cosmogenic isotope (which unlike carbon-14 can be studied with annual resolution) [24] but these appear to be in antiphase with any remnant sunspot activity. An explanation in terms of solar cycles in loss of solar magnetic flux was proposed in 2012.[25]
The fundamental papers on the Maunder minimum (Eddy, Legrand, Gleissberg, Schröder, Landsberg et al.) have been published in Case studies on the Spörer, Maunder and Dalton Minima.[26]
These predictions were announced at the National Astronomy Meeting in Llandudno, Wales, so it hasn't been possible to evaluate the research yet. However, Professor Valentina Zharkova from the University of Northumbria who made this announcement claims that the findings come from a computer model of sunspots that has made "unprecedentedly accurate predictions," as reported in The Telegraph.
The model has shown to have a 97% accuracy when mapping the past movements of sunspots, using data of solar cycles from 1976 to 2008. And if this reliability continues, then the model also has some alarming predictions for the future: a mini ice age sometime around the 2030s.
To achieve these findings, the scientists mapped the movement of solar fluid that moves in roughly 11-year cycles, which correspond to weather cycles on Earth. Around the year 2022 (labeled cycle 25), a pair of waves will be moving to the Northern and Southern Hemispheres of the Sun, getting slowly out of synch and reducing solar activity – and thus our warm weather.
"In cycle 26, the two waves exactly mirror each other – peaking at the same time but in opposite hemispheres of the Sun. Their interaction will be disruptive, or they will nearly cancel each other. We predict that this will lead to the properties of a 'Maunder minimum'," said Zharkova.
The Maunder minimum was a 70-year period between 1645 and 1715. The Sun produced barely any sunspots and the Earth experienced a mini ice age. Parts of northern Europe and the United States experienced uncharacteristically cold winters. The river Thames, flowing through London, even froze over for seven weeks and was passable by foot. The surface was so stable that residents could even hold 'frost fairs' on the ice.
Sunspots are relatively 'cool' regions on the Sun that appear darker when photographed. They are cooler than the rest of the Sun, but they are still around 4500 K (4200ºC, 7600ºF). They are caused by a concentration of intense, magnetic field from the Sun. This inhibits and redirects the flow of hot matter to that region and makes it darker – what we call a sunspot.
Sunspots last between 1 to 100 days, during which they rotate around the Sun, following the flow of solar fluid. Sunspots go through cycles of intensity and sparsity based on the motion of the fluid cycles. There are two main waves that are slightly offset over time, producing periods of maximum and minimum solar activity.
"Effectively, when the waves are approximately in phase, they can show strong interaction, or resonance, and we have strong solar activity," Zharkova said.
"When they are out of phase, we have solar minimums. When there is full phase separation, we have the conditions last seen during the Maunder minimum, 370 years ago."
Since our article yesterday about how reduced solar activity could lead to the next little ice age, IFLScience has spoken to the researcher who started the furor: Valentina Zharkova. She announced the findings from her team's research on solar activity last week at the Royal Astronomical Society. She noted that her team didn't realize how much of an impact their research would have on the media, and that it was journalists (including ourselves) who picked up on the possible impact on the climate. However, Zharkova says that this is not a reason to dismiss this research or the predictions about the environment.
“We didn't mention anything about the weather change, but I would have to agree that possibly you can expect it,” she informed IFLScience.
The future predicted activity of the Sun has been likened to the Maunder Minimum. This was a period when the Sun entered an especially inactive period, producing fewer sunspots than usual. This minimum happened at the same time that conditions in Northern America and Europe went unusually icy and cold, a period of time known as the “little ice age.”
The previous Maunder Minimum occurred in the 17th century and lasted between 50 and 60 years. During this time, winters were colder: for example the River Thames, which usually flows through London, notoriously froze over. The ice was so thick that people could walk from one side to the other. However, the citizens that lived in freezing, 17th century Europe survived these cold winters, and they didn't have the heating technology that we are fortunate enough to have today. If the next solar activity minimum does affect the weather on Earth, it will not be deadly for the human race.
Zharkova compared the Maunder Minimum with the one that her team predicted to occur around 15 years into the future. The next minimum will likely be a little bit shorter than the one in the 17th century, only lasting a maximum of three solar cycles (around 30 years).
The conditions during this next predicted minimum will still be chilly: “It will be cold, but it will not be this ice age when everything is freezing like in the Hollywood films,” Zharkova chuckled.
The predictions that Zharkova announced came from a mathematical program that analyzed data from the Sun. The team decided that they wanted to monitor the Sun's background magnetic field (which governs solar features like sunspots). You can see the team's data for cycles 21–23 published in The Astrophysical Journal.
After analyzing the solar data with their model, Zharkova's team noticed something that no one had ever expected before: that the Sun produces the magnetic waves in pairs. Previously everyone had thought that there was only a single source of magnetic waves in the Sun, but the evidence suggested two sources. The team used these observations to predict how the Sun's magnetic field would change in the future. “This is where we predicted this new Maunder minima,” Zharkova added.
She commented on how the changes in the Sun are likely to affect the Earth's environment. “During the minimum, the intensity of solar radiation will be reduced dramatically. So we will have less heat coming into the atmosphere, which will reduce the temperature.”
However, Zharkova ends with a word of warning: not about the cold but about humanity's attitude toward the environment during the minimum. We must not ignore the effects of global warming and assume that it isn't happening. “The Sun buys us time to stop these carbon emissions,” Zharkova says. The next minimum might give the Earth a chance to reduce adverse effects from global warming.
Maunder Minimum
From Wikipedia, the free encyclopedia

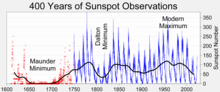
The Maunder minimum in a 400-year history of sunspot numbers
The Maunder Minimum, also known as the "prolonged sunspot minimum", is the name used for the period starting in about 1645 and continuing to about 1715 when sunspots became exceedingly rare, as noted by solar observers of the time.
The term was introduced after John A. Eddy published a landmark 1976 paper in Science.[1] Astronomers before Eddy had also named the period after the solar astronomers Annie Maunder (1868-1947) and E. Walter Maunder (1851–1928) who studied how sunspot latitudes changed with time.[2] The period the husband and wife team examined included the second half of the 17th century. Two papers were published in Edward Maunder's name in 1890 and 1894, and he cited earlier papers written by Gustav Spörer.[3] Due to the social climate of the time, Annie's contribution was not publicly recognized.[4]
Spörer noted that during one 30-year period within the Maunder Minimum observations showed fewer than 50 sunspots, as opposed to a more typical 40,000–50,000 spots in modern times.[5]
Like the Dalton Minimum and Spörer Minimum, the Maunder Minimum coincided with a period of lower-than-average European temperatures.
Sunspot observations
The Maunder Minimum occurred between 1645 and 1715 when very few sunspots were observed. This was not due to a lack of observations; during the 17th century, Giovanni Domenico Cassini carried out a systematic program of solar observations at the Observatoire de Paris, thanks to the astronomers Jean Picard and Philippe de La Hire. Johannes Hevelius also performed observations on his own. The total numbers of sunspots (but not Wolf numbers) in different years were as follows:| Year | Sunspots |
|---|---|
| 1610 | 9 |
| 1620 | 6 |
| 1630 | 9 |
| 1640 | 0 |
| 1650 | 3 |
| 1660 | Some sunspots reported by Jan Heweliusz in Machina Coelestis |
| 1670 | 0 |
| 1680 | 1 huge sunspot observed by Giovanni Domenico Cassini |
During the Maunder Minimum enough sunspots were sighted so that 11-year cycles could be extrapolated from the count. The maxima occurred in 1676, 1684, 1695, 1705 and 1716.
The sunspot activity was then concentrated in the southern hemisphere of the Sun, except for the last cycle when the sunspots appeared in the northern hemisphere, too.
According to Spörer's law, at the start of a cycle, spots appear at ever lower latitudes until they average at about latitude 15° at solar maximum. The average then continues to drift lower to about 7° and after that, while spots of the old cycle fade, new cycle spots start appearing again at high latitudes.
The visibility of these spots is also affected by the velocity of the sun's surface rotation at various latitudes:
| Solar latitude | Rotation period (days) |
|---|---|
| 0° | 24.7 |
| 35° | 26.7 |
| 40° | 28.0 |
| 75° | 33.0 |
Visibility is somewhat affected by observations being done from the ecliptic. The ecliptic is inclined 7° from the plane of the Sun's equator (latitude 0°).
Little Ice Age
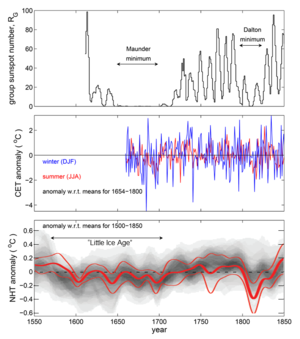
Comparison of group sunspot numbers (top), Central England Temperature
(CET) observations (middle) and reconstructions and modeling of Northern
Hemisphere Temperatures (NHT). The CET in red are summer averages (for
June, July and August) and in blue winter averages (for December of
previous year, January and February). NHT in grey is the distribution
from basket of paleoclimate reconstructions (darker grey showing higher
probability values) and in red are from model simulations that account
for solar and volcanic variations. By way of comparison, on the same
scales the anomaly for modern data (after 31 December 1999) for summer
CET is +0.65oC, for winter CET is +1.34oC, and for NHT is +1.08oC. Sunspot data are as in supplementary data to [6] and Central England Temperature data are as published by the UK Met Office [7] The NHT data are described in box TS.5, Figure 1 of the IPCC AR5 report of Working Group 1.[8]
The Maunder Minimum roughly coincided with the middle part of the Little Ice Age, during which Europe and North America experienced very cold winters. A causal connection between low sunspot activity and cold European winters has recently been made using the longest existing surface temperature record, the Central England Temperature record [9] and also using the ERA-40 re-analysis dataset.[10] A potential explanation of this has been offered by observations by NASA's Solar Radiation and Climate Experiment, which suggest that solar UV output is more variable over the course of the solar cycle than scientists had previously thought.[11] In 2011, an article was published in the Nature Geoscience journal that uses a climate model with stratospheric layers and the SORCE data to tie low solar activity to jet stream behavior and mild winters in some places (southern Europe and Canada/Greenland) and colder winters in others (northern Europe and the United States).[12] In Europe, examples of very cold winters are 1683-4, 1694-5, and the winter of 1708–9.[13] In such years, River Thames frost fairs were held.
However the Thames ceased to freeze in the 19th century largely because the removal of the "Old" (medieval) London Bridge in 1825 dramatically increased the river's flow into the Pool of London. The original 240–270-metre (800–900 ft) bridge stood upon 19 irregularly spaced arches that were set into the river bed on large starlings. It acted as a weir holding back the slack upstream waters from the tidal brackish, salt water downstream. The construction of Thames Embankment (began 1862) further increased the river's hydrological flow by narrowing the width of waterway through the centre of capital.[original research?]
Note that the term "Little Ice Age" applied to the Maunder minimum is something of a misnomer as it implies a period of unremitting cold (and on a global scale), which is not the case. For example, the coldest winter in the Central England Temperature record is 1683-4, but the winter just 2 years later (both in the middle of the Maunder minimum) was the fifth warmest in the whole 350-year CET record. Furthermore, summers during the Maunder minimum were not significantly different to those seen in subsequent years. The drop in global average temperatures in paleoclimate reconstructions at the start of the Little Ice Age was between about 1560 and 1600, whereas the Maunder minimum began almost 50 years later.[original research?]
Other observations

Solar activity events recorded in radiocarbon.

Graph showing proxies of solar activity, including changes in sunspot number and cosmogenic isotope production.
Some scientists hypothesize that the dense wood used in Stradivarius instruments was caused by slow tree growth during the cooler period. Instrument maker Antonio Stradivari was born a year before the start of the Maunder Minimum.[14]
Past solar activity may be recorded by various proxies including carbon-14 and beryllium-10.[15] These indicate lower solar activity during the Maunder Minimum. The scale of changes resulting in the production of carbon-14 in one cycle is small (about one percent of medium abundance) and can be taken into account when radiocarbon dating is used to determine the age of archaeological artifacts. The interpretation of the beryllium-10 and carbon-14 cosmogenic isotope abundance records stored in terrestrial reservoirs such as ice sheets and tree rings has been greatly aided by reconstructions of solar and heliospheric magnetic fields based on historic data on Geomagnetic storm activity, which bridge the time gap between the end of the usable cosmogenic isotope data and the start of modern spacecraft data.[16][17]
Other historical sunspot minima have been detected either directly or by the analysis of the cosmogenic isotopes; these include the Spörer Minimum (1450–1540), and less markedly the Dalton Minimum (1790–1820). In a 2012 study, sunspot minima have been detected by analysis of carbon-14 in lake sediments.[18] In total there seem to have been 18 periods of sunspot minima in the last 8,000 years, and studies indicate that the sun currently spends up to a quarter of its time in these minima.
A paper based on an analysis of a Flamsteed drawing, suggests that the Sun's surface rotation slowed in the deep Maunder minimum (1684).[19]
During the Maunder Minimum aurorae had been observed seemingly normally, with a regular decadal-scale cycle.[20][21] This is somewhat surprising because the later, and less deep, Dalton sunspot minimum is clearly seen in auroral occurrence frequency, at least at lower geomagnetic latitudes.[22] Because geomagnetic latitude is an important factor in auroral occurrence, (lower-latitude aurorae requiring higher levels of solar-terrestrial activity) it becomes important to allow for population migration and other factors that may have influenced the number of reliable auroral observers at a given magnetic latitude for the earlier dates.[23] Decadal-scale cycles during the Maunder minimum can also be seen in the abundances of the beryllium-10 cosmogenic isotope (which unlike carbon-14 can be studied with annual resolution) [24] but these appear to be in antiphase with any remnant sunspot activity. An explanation in terms of solar cycles in loss of solar magnetic flux was proposed in 2012.[25]
The fundamental papers on the Maunder minimum (Eddy, Legrand, Gleissberg, Schröder, Landsberg et al.) have been published in Case studies on the Spörer, Maunder and Dalton Minima.[26]


