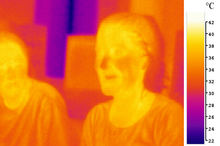
A false color image of two people taken in long-wavelength infrared (body-temperature thermal) light.
This infrared space telescope image has (false color) blue, green and red corresponding to 3.4, 4.6, and 12 µm wavelengths, respectively.
Infrared radiation, or simply infrared or IR, is electromagnetic radiation (EMR) with longer wavelengths than those of visible light, and is therefore invisible, although it is sometimes loosely called infrared light. It extends from the nominal red edge of the visible spectrum at 700 nanometers (frequency 430 THz), to 1000000 nm (300 GHz)[1] (although people can see infrared up to at least 1050 nm in experiments[2][3][4][5]). Most of the thermal radiation emitted by objects near room temperature is infrared. Like all EMR, IR carries radiant energy, and behaves both like a wave and like its quantum particle, the photon.
Infrared was discovered in 1800 by astronomer Sir William Herschel, who discovered a type of invisible radiation in the spectrum lower in energy than red light, by means of its effect on a thermometer.[6] Slightly more than half of the total energy from the Sun was eventually found to arrive on Earth in the form of infrared. The balance between absorbed and emitted infrared radiation has a critical effect on Earth's climate.
Infrared radiation is emitted or absorbed by molecules when they change their rotational-vibrational movements. It excites vibrational modes in a molecule through a change in the dipole moment, making it a useful frequency range for study of these energy states for molecules of the proper symmetry. Infrared spectroscopy examines absorption and transmission of photons in the infrared range.[7]
Infrared radiation is used in industrial, scientific, and medical applications. Night-vision devices using active near-infrared illumination allow people or animals to be observed without the observer being detected. Infrared astronomy uses sensor-equipped telescopes to penetrate dusty regions of space such as molecular clouds, detect objects such as planets, and to view highly red-shifted objects from the early days of the universe.[8] Infrared thermal-imaging cameras are used to detect heat loss in insulated systems, to observe changing blood flow in the skin, and to detect overheating of electrical apparatus.
Thermal-infrared imaging is used extensively for military and civilian purposes. Military applications include target acquisition, surveillance, night vision, homing, and tracking. Humans at normal body temperature radiate chiefly at wavelengths around 10 μm (micrometers). Non-military uses include thermal efficiency analysis, environmental monitoring, industrial facility inspections, remote temperature sensing, short-ranged wireless communication, spectroscopy, and weather forecasting.
Definition and relationship to the electromagnetic spectrum
Infrared radiation extends from the nominal red edge of the visible spectrum at 700 nanometers (nm) to 1 mm. This range of wavelengths corresponds to a frequency range of approximately 430 THz down to 300 GHz. Below infrared is the microwave portion of the electromagnetic spectrum.
Infrared in relation to electromagnetic spectrum
| Light comparison[9] | |||||||
| Name | Wavelength | Frequency (Hz) | Photon Energy (eV) | ||||
|---|---|---|---|---|---|---|---|
| Gamma ray | less than 0.01 nm | more than 30 EHz | 124 keV – 300+ GeV | ||||
| X-ray | 0.01 nm – 10 nm | 30 EHz – 30 PHz | 124 eV – 124 keV | ||||
| Ultraviolet | 10 nm – 400 nm | 30 PHz – 790 THz | 3.3 eV – 124 eV | ||||
| Visible | 400 nm–700 nm | 790 THz – 430 THz | 1.7 eV – 3.3 eV | ||||
| Infrared | 700 nm – 1 mm | 430 THz – 300 GHz | 1.24 meV – 1.7 eV | ||||
| Microwave | 1 mm – 1 meter | 300 GHz – 300 MHz | 1.24 µeV – 1.24 meV | ||||
| Radio | 1 meter – 100,000 km | 300 MHz – 3 Hz | 12.4 feV – 1.24 µeV | ||||
Natural infrared
Sunlight, at an effective temperature of 5,780 kelvins, is composed of near thermal-spectrum radiation that is slightly more than half infrared. At zenith, sunlight provides an irradiance of just over 1 kilowatt per square meter at sea level. Of this energy, 527 watts is infrared radiation, 445 watts is visible light, and 32 watts is ultraviolet radiation.[10] Nearly all the infrared radiation in sunlight is near infrared, shorter than 4 micrometers.On the surface of Earth, at far lower temperatures than the surface of the Sun, almost all thermal radiation consists of infrared in mid-infrared region, much longer than in sunlight. Of these natural thermal radiation processes only lightning and natural fires are hot enough to produce much visible energy, and fires produce far more infrared than visible-light energy.
Regions within the infrared
In general, objects emit infrared radiation across a spectrum of wavelengths, but sometimes only a limited region of the spectrum is of interest because sensors usually collect radiation only within a specific bandwidth. Thermal infrared radiation also has a maximum emission wavelength, which is inversely proportional to the absolute temperature of object, in accordance with Wien's displacement law.Therefore, the infrared band is often subdivided into smaller sections.
Commonly used sub-division scheme
| Division Name | Abbreviation | Wavelength | Frequency | Photon Energy | Temperature† | Characteristics |
| Near-infrared | NIR, IR-A DIN | 0.75–1.4 µm | 214–400 THz | 886–1653 meV | 3,864–2,070 K (3,591–1,797 °C) |
Defined by the water absorption, and commonly used in fiber optic telecommunication because of low attenuation losses in the SiO2 glass (silica) medium. Image intensifiers are sensitive to this area of the spectrum. Examples include night vision devices such as night vision goggles. |
| Short-wavelength infrared | SWIR, IR-B DIN | 1.4–3 µm | 100–214 THz | 413–886 meV | 2,070–966 K (1,797–693 °C) |
Water absorption increases significantly at 1450 nm. The 1530 to 1560 nm range is the dominant spectral region for long-distance telecommunications. |
| Mid-wavelength infrared | MWIR, IR-C DIN; MidIR.[12] Also called intermediate infrared (IIR) | 3–8 µm | 37–100 THz | 155–413 meV | 966–362 K (693–89 °C) |
In guided missile technology the 3–5 µm portion of this band is the atmospheric window in which the homing heads of passive IR 'heat seeking' missiles are designed to work, homing on to the Infrared signature of the target aircraft, typically the jet engine exhaust plume. This region is also known as thermal infrared. |
| Long-wavelength infrared | LWIR, IR-C DIN | 8–15 µm | 20–37 THz | 83–155 meV | 362–193 K (89 – −80 °C) |
The "thermal imaging" region, in which sensors can obtain a completely passive image of objects only slightly higher in temperature than room temperature - for example, the human body - based on thermal emissions only and requiring no illumination such as the sun, moon, or infrared illuminator. This region is also called the "thermal infrared". |
| Far-infrared | FIR | 15–1000 µm | 0.3–20 THz | 1.2–83 meV | 193–3 K (−80.15 – −270.15 °C) |
(see also far-infrared laser and far infrared) |
NIR and SWIR is sometimes called "reflected infrared", whereas MWIR and LWIR is sometimes referred to as "thermal infrared". Due to the nature of the blackbody radiation curves, typical "hot" objects, such as exhaust pipes, often appear brighter in the MW compared to the same object viewed in the LW.
CIE division scheme
The International Commission on Illumination (CIE) recommended the division of infrared radiation into the following three bands:[14]| Abbreviation | Wavelength | Frequency |
|---|---|---|
| IR-A | 700 nm – 1400 nm (0.7 µm – 1.4 µm) | 215 THz – 430 THz |
| IR-B | 1400 nm – 3000 nm (1.4 µm – 3 µm) | 100 THz – 215 THz |
| IR-C | 3000 nm – 1 mm (3 µm – 1000 µm) | 300 GHz – 100 THz |
ISO 20473 scheme
ISO 20473 specifies the following scheme:[15]| Designation | Abbreviation | Wavelength |
|---|---|---|
| Near-Infrared | NIR | 0.78–3 µm |
| Mid-Infrared | MIR | 3–50 µm |
| Far-Infrared | FIR | 50–1000 µm |
Astronomy division scheme
Astronomers typically divide the infrared spectrum as follows:[16]| Designation | Abbreviation | Wavelength |
|---|---|---|
| Near-Infrared | NIR | (0.7–1) to 2.5 µm |
| Mid-Infrared | MIR | 2.5 to (25–40) µm |
| Far-Infrared | FIR | (25–40) to (200–350) µm. |
These divisions are not precise and can vary depending on the publication. The three regions are used for observation of different temperature ranges, and hence different environments in space.
The most common photometric system used in astronomy allocates capital letters to different spectral regions according to filters used; I, J, H, and K cover the near-infrared wavelengths; L, M, N, and Q refer to the mid-infrared region. These letters are commonly understood in reference to atmospheric windows and appear, for instance, in the titles of many papers.
Sensor response division scheme
Plot of atmospheric transmittance in part of the infrared region.
- Near-infrared: from 0.7 to 1.0 µm (from the approximate end of the response of the human eye to that of silicon).
- Short-wave infrared: 1.0 to 3 µm (from the cut-off of silicon to that of the MWIR atmospheric window). InGaAs covers to about 1.8 µm; the less sensitive lead salts cover this region.
- Mid-wave infrared: 3 to 5 µm (defined by the atmospheric window and covered by Indium antimonide [InSb] and HgCdTe and partially by lead selenide [PbSe]).
- Long-wave infrared: 8 to 12, or 7 to 14 µm (this is the atmospheric window covered by HgCdTe and microbolometers).
- Very-long wave infrared (VLWIR) (12 to about 30 µm, covered by doped silicon).
The onset of infrared is defined (according to different standards) at various values typically between 700 nm and 800 nm, but the boundary between visible and infrared light is not precisely defined. The human eye is markedly less sensitive to light above 700 nm wavelength, so longer wavelengths make insignificant contributions to scenes illuminated by common light sources. However, particularly intense near-IR light (e.g., from IR lasers, IR LED sources, or from bright daylight with the visible light removed by colored gels) can be detected up to approximately 780 nm, and will be perceived as red light. Intense light sources providing wavelengths as long as 1050 nm can be seen as a dull red glow, causing some difficulty in near-IR illumination of scenes in the dark (usually this practical problem is solved by indirect illumination). Leaves are particularly bright in the near IR, and if all visible light leaks from around an IR-filter are blocked, and the eye is given a moment to adjust to the extremely dim image coming through a visually opaque IR-passing photographic filter, it is possible to see the Wood effect that consists of IR-glowing foliage.[18]
Telecommunication bands in the infrared
In optical communications, the part of the infrared spectrum that is used is divided into seven bands based on availability of light sources transmitting/absorbing materials (fibers) and detectors:[19]| Band | Descriptor | Wavelength range |
|---|---|---|
| O band | Original | 1260–1360 nm |
| E band | Extended | 1360–1460 nm |
| S band | Short wavelength | 1460–1530 nm |
| C band | Conventional | 1530–1565 nm |
| L band | Long wavelength | 1565–1625 nm |
| U band | Ultralong wavelength | 1625–1675 nm |
Heat

Materials with higher emissivity
appear to be hotter. In this thermal image, the ceramic cylinder
appears to be hotter than its cubic container (made of silicon carbide),
while in fact they have the same temperature.
Infrared radiation is popularly known as "heat radiation"[citation needed], but light and electromagnetic waves of any frequency will heat surfaces that absorb them. Infrared light from the Sun accounts for 49%[20] of the heating of Earth, with the rest being caused by visible light that is absorbed then re-radiated at longer wavelengths. Visible light or ultraviolet-emitting lasers can char paper and incandescently hot objects emit visible radiation. Objects at room temperature will emit radiation concentrated mostly in the 8 to 25 µm band, but this is not distinct from the emission of visible light by incandescent objects and ultraviolet by even hotter objects (see black body and Wien's displacement law).[21]
Heat is energy in transit that flows due to temperature difference. Unlike heat transmitted by thermal conduction or thermal convection, thermal radiation can propagate through a vacuum. Thermal radiation is characterized by a particular spectrum of many wavelengths that is associated with emission from an object, due to the vibration of its molecules at a given temperature. Thermal radiation can be emitted from objects at any wavelength, and at very high temperatures such radiations are associated with spectra far above the infrared, extending into visible, ultraviolet, and even X-ray regions (e.g. the solar corona). Thus, the popular association of infrared radiation with thermal radiation is only a coincidence based on typical (comparatively low) temperatures often found near the surface of planet Earth.
The concept of emissivity is important in understanding the infrared emissions of objects. This is a property of a surface that describes how its thermal emissions deviate from the ideal of a black body. To further explain, two objects at the same physical temperature will not show the same infrared image if they have differing emissivity. For example, for any pre-set emissivity value, objects with higher emissivity will appear hotter, and those with a lower emissivity will appear cooler. For that reason, incorrect selection of emissivity will give inaccurate results when using infrared cameras and pyrometers.
Applications
Night vision

Active-infrared night vision : the camera illuminates the scene at infrared wavelengths invisible to the human eye. Despite a dark back-lit scene, active-infrared night vision delivers identifying details, as seen on the display monitor.
Infrared is used in night vision equipment when there is insufficient visible light to see.[22] Night vision devices operate through a process involving the conversion of ambient light photons into electrons that are then amplified by a chemical and electrical process and then converted back into visible light.[22] Infrared light sources can be used to augment the available ambient light for conversion by night vision devices, increasing in-the-dark visibility without actually using a visible light source.[22]
The use of infrared light and night vision devices should not be confused with thermal imaging, which creates images based on differences in surface temperature by detecting infrared radiation (heat) that emanates from objects and their surrounding environment.[23]
Thermography
Thermography helped to determine the temperature profile of the Space Shuttle thermal protection system during re-entry.
Infrared radiation can be used to remotely determine the temperature of objects (if the emissivity is known). This is termed thermography, or in the case of very hot objects in the NIR or visible it is termed pyrometry. Thermography (thermal imaging) is mainly used in military and industrial applications but the technology is reaching the public market in the form of infrared cameras on cars due to the massively reduced production costs.
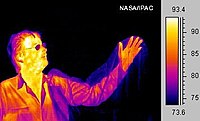
Thermographic cameras detect radiation in the infrared range of the electromagnetic spectrum (roughly 900–14,000 nanometers or 0.9–14 μm) and produce images of that radiation. Since infrared radiation is emitted by all objects based on their temperatures, according to the black body radiation law, thermography makes it possible to "see" one's environment with or without visible illumination. The amount of radiation emitted by an object increases with temperature, therefore thermography allows one to see variations in temperature (hence the name).
Hyperspectral imaging

Hyperspectral thermal infrared emission measurement, an outdoor scan in winter conditions, ambient temperature −15 °C, image produced with a Specim LWIR hyperspectral imager. Relative radiance spectra from various targets in the image are shown with arrows. The infrared spectra
of the different objects such as the watch clasp have clearly
distinctive characteristics. The contrast level indicates the
temperature of the object.[24]
Infrared light from the LED of a remote control as recorded by a digital camera.
A hyperspectral image is a "picture" containing continuous spectrum through a wide spectral range at each pixel. Hyperspectral imaging is gaining importance in the field of applied spectroscopy particularly with NIR, SWIR, MWIR, and LWIR spectral regions. Typical applications include biological, mineralogical, defence, and industrial measurements.
Thermal infrared hyperspectral imaging can be similarly performed using a Thermographic camera, with the fundamental difference that each pixel contains a full LWIR spectrum. Consequently, chemical identification of the object can be performed without a need for an external light source such as the sun or the moon. Such cameras are typically applied for geological measurements, outdoor surveillance and UAV applications.[25]
Other imaging
In infrared photography, infrared filters are used to capture the near-infrared spectrum. Digital cameras often use infrared blockers. Cheaper digital cameras and camera phones have less effective filters and can "see" intense near-infrared, appearing as a bright purple-white color. This is especially pronounced when taking pictures of subjects near IR-bright areas (such as near a lamp), where the resulting infrared interference can wash out the image. There is also a technique called 'T-ray' imaging, which is imaging using far-infrared or terahertz radiation. Lack of bright sources can make terahertz photography more challenging than most other infrared imaging techniques. Recently T-ray imaging has been of considerable interest due to a number of new developments such as terahertz time-domain spectroscopy.
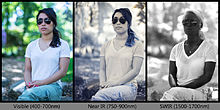
Reflected light photograph in various infrared spectra to illustrate the appearance as the wavelength of light changes.
Tracking
Infrared tracking, also known as infrared homing, refers to a passive missile guidance system, which uses the emission from a target of electromagnetic radiation in the infrared part of the spectrum to track it. Missiles that use infrared seeking are often referred to as "heat-seekers", since infrared (IR) is just below the visible spectrum of light in frequency and is radiated strongly by hot bodies. Many objects such as people, vehicle engines, and aircraft generate and retain heat, and as such, are especially visible in the infrared wavelengths of light compared to objects in the background.[26]Heating
Infrared radiation can be used as a deliberate heating source. For example, it is used in infrared saunas to heat the occupants. It may also be used in other heating applications, such as to remove ice from the wings of aircraft (de-icing).[27] Infrared can be used in cooking and heating food as it predominantly heats the opaque, absorbent objects, rather than the air around them.Infrared heating is also becoming more popular in industrial manufacturing processes, e.g. curing of coatings, forming of plastics, annealing, plastic welding, and print drying. In these applications, infrared heaters replace convection ovens and contact heating.
Efficiency is achieved by matching the wavelength of the infrared heater to the absorption characteristics of the material.
Communications
IR data transmission is also employed in short-range communication among computer peripherals and personal digital assistants. These devices usually conform to standards published by IrDA, the Infrared Data Association. Remote controls and IrDA devices use infrared light-emitting diodes (LEDs) to emit infrared radiation that is focused by a plastic lens into a narrow beam. The beam is modulated, i.e. switched on and off, to prevent interference from other sources of infrared (like sunlight or artificial lighting). The receiver uses a silicon photodiode to convert the infrared radiation to an electric current. It responds only to the rapidly pulsing signal created by the transmitter, and filters out slowly changing infrared radiation from ambient light. Infrared communications are useful for indoor use in areas of high population density. IR does not penetrate walls and so does not interfere with other devices in adjoining rooms. Infrared is the most common way for remote controls to command appliances. Infrared remote control protocols like RC-5, SIRC, are used to communicate with infrared.Free space optical communication using infrared lasers can be a relatively inexpensive way to install a communications link in an urban area operating at up to 4 gigabit/s, compared to the cost of burying fiber optic cable, except for the radiation damage. "Since the eye cannot detect IR, blinking or closing the eyes to help prevent or reduce damage may not happen."[28]
Infrared lasers are used to provide the light for optical fiber communications systems. Infrared light with a wavelength around 1,330 nm (least dispersion) or 1,550 nm (best transmission) are the best choices for standard silica fibers.
IR data transmission of encoded audio versions of printed signs is being researched as an aid for visually impaired people through the RIAS (Remote Infrared Audible Signage) project. Transmitting IR data from one device to another is sometimes referred to as beaming.
Spectroscopy
Infrared vibrational spectroscopy (see also near-infrared spectroscopy) is a technique that can be used to identify molecules by analysis of their constituent bonds. Each chemical bond in a molecule vibrates at a frequency characteristic of that bond. A group of atoms in a molecule (e.g., CH2) may have multiple modes of oscillation caused by the stretching and bending motions of the group as a whole. If an oscillation leads to a change in dipole in the molecule then it will absorb a photon that has the same frequency. The vibrational frequencies of most molecules correspond to the frequencies of infrared light. Typically, the technique is used to study organic compounds using light radiation from 4000–400 cm−1, the mid-infrared. A spectrum of all the frequencies of absorption in a sample is recorded. This can be used to gain information about the sample composition in terms of chemical groups present and also its purity (for example, a wet sample will show a broad O-H absorption around 3200 cm−1).Thin film metrology
In the semiconductor industry, infrared light can be used to characterize materials such as thin films and periodic trench structures. By measuring the reflectance of light from the surface of a semiconductor wafer, the index of refraction (n) and the extinction Coefficient (k) can be determined via the Forouhi-Bloomer dispersion equations. The reflectance from the infrared light can also be used to determine the critical dimension, depth, and sidewall angle of high aspect ratio trench structures.Meteorology
IR Satellite picture taken 1315 Z on 15th October 2006. A frontal system can be seen in the Gulf of Mexico with embedded Cumulonimbus cloud. Shallower Cumulus and Stratocumulus can be seen off the Eastern Seaboard.
Weather satellites equipped with scanning radiometers produce thermal or infrared images, which can then enable a trained analyst to determine cloud heights and types, to calculate land and surface water temperatures, and to locate ocean surface features. The scanning is typically in the range 10.3–12.5 µm (IR4 and IR5 channels).
High, cold ice clouds such as Cirrus or Cumulonimbus show up bright white, lower warmer clouds such as Stratus or Stratocumulus show up as grey with intermediate clouds shaded accordingly. Hot land surfaces will show up as dark-grey or black. One disadvantage of infrared imagery is that low cloud such as stratus or fog can be a similar temperature to the surrounding land or sea surface and does not show up. However, using the difference in brightness of the IR4 channel (10.3–11.5 µm) and the near-infrared channel (1.58–1.64 µm), low cloud can be distinguished, producing a fog satellite picture. The main advantage of infrared is that images can be produced at night, allowing a continuous sequence of weather to be studied.
These infrared pictures can depict ocean eddies or vortices and map currents such as the Gulf Stream, which are valuable to the shipping industry. Fishermen and farmers are interested in knowing land and water temperatures to protect their crops against frost or increase their catch from the sea. Even El Niño phenomena can be spotted. Using color-digitized techniques, the gray-shaded thermal images can be converted to color for easier identification of desired information.
The main water vapour channel at 6.40 to 7.08 µm can be imaged by some weather satellites and shows the amount of moisture in the atmosphere.
Climatology
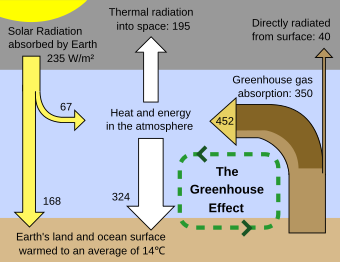
In the field of climatology, atmospheric infrared radiation is monitored to detect trends in the energy exchange between the earth and the atmosphere. These trends provide information on long-term changes in Earth's climate. It is one of the primary parameters studied in research into global warming, together with solar radiation.
Schematic of the greenhouse effect
A pyrgeometer is utilized in this field of research to perform continuous outdoor measurements. This is a broadband infrared radiometer with sensitivity for infrared radiation between approximately 4.5 µm and 50 µm.
Astronomy

Beta Pictoris
with its planet Beta Pictoris b, the light-blue dot off-center, as seen
in infrared. It combines two images, the inner disc is at 3.6 µm.
Astronomers observe objects in the infrared portion of the electromagnetic spectrum using optical components, including mirrors, lenses and solid state digital detectors. For this reason it is classified as part of optical astronomy. To form an image, the components of an infrared telescope need to be carefully shielded from heat sources, and the detectors are chilled using liquid helium.
The sensitivity of Earth-based infrared telescopes is significantly limited by water vapor in the atmosphere, which absorbs a portion of the infrared radiation arriving from space outside of selected atmospheric windows. This limitation can be partially alleviated by placing the telescope observatory at a high altitude, or by carrying the telescope aloft with a balloon or an aircraft. Space telescopes do not suffer from this handicap, and so outer space is considered the ideal location for infrared astronomy.
The infrared portion of the spectrum has several useful benefits for astronomers. Cold, dark molecular clouds of gas and dust in our galaxy will glow with radiated heat as they are irradiated by imbedded stars. Infrared can also be used to detect protostars before they begin to emit visible light. Stars emit a smaller portion of their energy in the infrared spectrum, so nearby cool objects such as planets can be more readily detected. (In the visible light spectrum, the glare from the star will drown out the reflected light from a planet.)
Infrared light is also useful for observing the cores of active galaxies, which are often cloaked in gas and dust. Distant galaxies with a high redshift will have the peak portion of their spectrum shifted toward longer wavelengths, so they are more readily observed in the infrared.[8]
Infrared cleaning
Infrared cleaning is a technique used by some motion picture film scanners, film scanners and flatbed scanners to reduce or remove the effect of dust and scratches upon the finished scan. It works by collecting an additional infrared channel from the scan at the same position and resolution as the three visible color channels (red, green, and blue). The infrared channel, in combination with the other channels, is used to detect the location of scratches and dust. Once located, those defects can be corrected by scaling or replaced by inpainting.[29]Art conservation and analysis
Infrared reflectography, as called by art conservators,[30] can be applied to paintings to reveal underlying layers in a completely non-destructive manner, in particular the underdrawing or outline drawn by the artist as a guide. This often reveals the artist's use of carbon black, which shows up well in reflectograms, as long as it has not also been used in the ground underlying the whole painting. Art conservators are looking to see whether the visible layers of paint differ from the underdrawing or layers in between – such alterations are called pentimenti when made by the original artist. This is very useful information in deciding whether a painting is the prime version by the original artist or a copy, and whether it has been altered by over-enthusiastic restoration work. In general, the more pentimenti the more likely a painting is to be the prime version. It also gives useful insights into working practices.[31]Among many other changes in the Arnolfini Portrait of 1434 (left), the man's face was originally higher by about the height of his eye; the woman's was higher, and her eyes looked more to the front. Each of his feet was underdrawn in one position, painted in another, and then overpainted in a third. These alterations are seen in infrared reflectograms.[32]
Recent progress in the design of infrared sensitive cameras made it possible to discover and depict not only underpaintings and pentimenti but entire paintings which were later overpainted by the artist.[33] Notable examples are Picasso's "Woman ironing" and "Blue room", where in both cases, a portrait of a man has been made visible under the painting as it is known today.
Similar uses of infrared are made by conservators and scientists on various types of objects, especially very old written documents such as the Dead Sea Scrolls, the Roman works in the Villa of the Papyri, and the Silk Road texts found in the Dunhuang Caves.[34] Carbon black used in ink can show up extremely well.
Biological systems

Thermographic image of a snake eating a mouse
The pit viper has a pair of infrared sensory pits on its head. There is uncertainty regarding the exact thermal sensitivity of this biological infrared detection system.[35][36]
Other organisms that have thermoreceptive organs are pythons (family Pythonidae), some boas (family Boidae), the Common Vampire Bat (Desmodus rotundus), a variety of jewel beetles (Melanophila acuminata),[37] darkly pigmented butterflies (Pachliopta aristolochiae and Troides rhadamantus plateni), and possibly blood-sucking bugs (Triatoma infestans).[38]
Although near-infrared vision (780–1000 nm) has long been deemed impossible due to noise in visual pigments,[39] sensation of near-infrared light was reported in the common carp and in three cichlid species.[39][40][41][42][43] Fish use NIR to capture prey[39] and for phototactic swimming orientation.[43] NIR sensation in fish may be relevant under poor lighting conditions during twilight[39] and in turbid surface waters.[43]
Photobiomodulation
Near-infrared light, or photobiomodulation, is used for treatment of chemotherapy-induced oral ulceration as well as wound healing. There is some work relating to anti-herpes virus treatment.[44] Research projects include work on central nervous system healing effects via cytochrome c oxidase upregulation and other possible mechanisms.[45]Health hazard
Strong infrared radiation in certain industry high-heat settings may be hazardous to the eyes, resulting in damage or blindness to the user. Since the radiation is invisible, special IR-proof goggles must be worn in such places.[46]History of infrared science
The discovery of infrared radiation is ascribed to William Herschel, the astronomer, in the early 19th century. Herschel published his results in 1800 before the Royal Society of London. Herschel used a prism to refract light from the sun and detected the infrared, beyond the red part of the spectrum, through an increase in the temperature recorded on a thermometer. He was surprised at the result and called them "Calorific Rays". The term 'Infrared' did not appear until late in the 19th century.[47][48]Other important dates include:[17]
Infrared radiation was discovered in 1800 by William Herschel.
- 1737: Émilie du Châtelet predicted what is today known as infrared radiation in Dissertation sur la nature et la propagation du feu.
- 1835: Macedonio Melloni made the first thermopile IR detector.
- 1840: John Herschel produces the first thermal image thermogram.
- 1860: Gustav Kirchhoff formulated the blackbody theorem
.
- 1873: Willoughby Smith discovered the photoconductivity of selenium.
- 1879: Stefan-Boltzmann law formulated empirically that the power radiated by a blackbody is proportional to T4.
- 1880s & 1890s: Lord Rayleigh and Wilhelm Wien solved part of the blackbody equation, but both solutions diverged in parts of the electromagnetic spectrum. This problem was called the "Ultraviolet catastrophe and Infrared Catastrophe".
- 1901: Max Planck published the blackbody equation and theorem. He solved the problem by quantizing the allowable energy transitions.
- 1905: Albert Einstein developed the theory of the photoelectric effect.
- 1917: Theodore Case developed the thallous sulfide detector; British scientist built the first infra-red search and track (IRST) device able to detect aircraft at a range of one mile (1.6 km).
- 1935: Lead salts – early missile guidance in World War II.
- 1938: Teau Ta – predicted that the pyroelectric effect could be used to detect infrared radiation.
- 1945: The Zielgerät 1229 "Vampir" infrared weapon system was introduced as the first portable infrared device for military applications.
- 1952: H. Welker grew synthetic InSb crystals.
- 1950s: Paul Kruse (at Honeywell) and Texas Instruments recorded infrared images.
- 1950s and 1960s: Nomenclature and radiometric units defined by Fred Nicodemenus, G.J. Zissis and R. Clark; Robert Clark Jones defined D*.
- 1958: W.D. Lawson (Royal Radar Establishment in Malvern) discovered IR detection properties of HgCdTe.
- 1958: Falcon and Sidewinder missiles were developed using infrared technology.
- 1961: J. Cooper demonstrated pyroelectric detection.
- 1964: W.G. Evans discovered infrared thermoreceptors in a pyrophile beetle.[37]
- 1965: First IR Handbook; first commercial imagers (Barnes, Agema {now part of FLIR Systems Inc.}; Richard Hudson's landmark text; F4 TRAM FLIR by Hughes; phenomenology pioneered by Fred Simmons and A.T. Stair; U.S. Army's night vision lab formed (now Night Vision and Electronic Sensors Directorate (NVESD), and Rachets develops detection, recognition and identification modeling there.
- 1970: Willard Boyle and George E. Smith proposed CCD at Bell Labs for picture phone.
- 1972: Common module program started by NVESD.
- 1978: Infrared imaging astronomy came of age, observatories planned, IRTF on Mauna Kea opened; 32 by 32 and 64 by 64 arrays produced using InSb, HgCdTe and other materials.
- 2013: On February 14 researchers developed a neural implant that gives rats the ability to sense infrared light which for the first time provides living creatures with new abilities, instead of simply replacing or augmenting existing abilities.[49]
