Search This Blog

Monday, May 14, 2018

Evolutionary arms race

From Wikipedia, the free encyclopedia

In evolutionary biology, an evolutionary arms race is a struggle between competing sets of co-evolving genes, traits, or species, that develop adaptations and counter-adaptations against each other, resembling an arms race. These are often described as examples of positive feedback.[1] The co-evolving gene sets may be in different species, as in an evolutionary arms race between a predator species and its prey (Vermeij, 1987), or a parasite and its host. Alternatively, the arms race may be between members of the same species, as in the manipulation/sales resistance model of communication (Dawkins & Krebs, 1979) or as in runaway evolution or Red Queen effects. One example of an evolutionary arms race is in sexual conflict between the sexes, often described with the term Fisherian runaway. Thierry Lodé[2] emphasized the role of such antagonistic interactions in evolution leading to character displacements and antagonist coevolution. The escalation hypothesis put forward by Geerat Vermeij speaks of more general conflicts and was originally based on his work with marine gastropod fossils.

Co-evolution itself is not necessarily an arms race. For example, mutualism may drive co-operative adaptations in a pair of species. This is the case with certain flowers' ultra-violet color patterns, whose function is to guide bees to the center of the flower and promote pollination. Co-evolution is also interspecific by definition; it excludes intraspecific arms races such as sexual conflict.

Evolutionary arms races can even be displayed between humans and micro-organisms, where medical researchers make antibiotics, and micro-organisms evolve into new strains that are more resistant.

Evolutionary arms races often evolve when a trait is only beneficial compared to the population. For instance, if a tree has a mutation making it taller, it will have an advantage due to more sunlight. But as soon as other trees reach the same height, it loses that advantage. As soon as a taller tree appears, it has the advantage. In this example, the nearest peak of the evolutionary landscape moves as the population approaches it. Another example of runaway evolution in sexual selection is an elk's antlers. Having big antlers makes a male elk more likely to win a mate. In fact, having big antlers is a requirement to mate. As a result, elk evolve antlers that are incredibly costly to build, maintain, and fight with. By the end of the mating season, the average male loses 25% of his body weight [3] due to fighting, which he has to make up before winter starts.

Symmetrical versus asymmetrical arms races

Arms races may be classified as either symmetrical or asymmetrical. In a symmetrical arms race, selection pressure acts on participants in the same direction. An example of this is trees growing taller as a result of competition for light, where the selective advantage for either species is increased height. An asymmetrical arms race involves contrasting selection pressures, such as the case of cheetahs and gazelles, where cheetahs evolve to be better at hunting and killing while gazelles evolve not to hunt and kill, but rather to evade capture.[4]

Host-parasite dynamic

Selective pressure between two species can include host-parasite coevolution. This antagonistic relationship leads to the necessity for the pathogen to have the best virulent alleles to infect the organism and for the host to have the best resistant alleles to survive parasitism. As a consequence, allele frequencies vary through time depending on the size of virulent and resistant populations (fluctuation of genetic selection pressure) and generation time (mutation rate) where some genotypes are preferentially selected thanks to the individual fitness gain. Genetic change accumulation in both population explains a constant adaptation to have lower fitness costs and avoid extinction in accordance with the Red Queen's hypothesis suggested by Leigh Van Valen in 1973.

Examples

The Phytophthora infestans/Bintje potato interaction

The Bintje Potato is derived from a cross between Munstersen and Fransen potato varieties. It was created in the Netherlands and now is mainly cultivated in the North of France and Belgium. The oomycete Phytophthora infestans is responsible for the potato blight, in particular during the European famine in 1840. Zoospores (mobile spores, characteristics of oomycetes) are liberated by zoosporangia provided from a mycelium and brought by rain or wind before infecting tubers and leaves. Black colours appear on the plant because of the infection of its cellular system necessary for the multiplication of the oomycete infectious population. The parasite contains virulent-avirulent allelic combinations in several microsatellite loci, likewise the host contains several multiloci resistance genes (or R gene). That interaction is called gene-for-gene relationship and is, in general, widespread in plant diseases. Expression of genetic patterns in the two species is a combination of resistance and virulence characteristics in order to have the best survival rate.

Bats and moths

Bats have evolved to use echolocation to detect and catch their prey. Moths have in turn evolved to detect the echolocation calls of hunting bats, and evoke evasive flight maneuvers,[5][6] or reply with their own ultrasonic clicks to confuse the bat's echolocation.[7] The Arctiidae subfamily of Noctuid moths uniquely respond to bat echolocation in three prevailing hypotheses: startle, sonar jamming, and acoustic aposematic defense.[8] All these differences depend on specific environmental settings and the type of echolocation call; however, these hypotheses are not mutually exclusive and can be used by the same moth for defense.[8] The different defense mechanisms have been shown to be directly responsive to bat echolocation through sympatry studies. In places with spatial or temporal isolation between bats and their prey, the moth species hearing mechanism tends to regress. Fullard et al. (2004) compared adventive and endemic Noctiid moth species in a bat-free habitat to ultrasound and found that all of the adventive species reacted to the ultrasound by slowing their flight times, while only one of the endemic species reacted to the ultrasound signal, indicating a loss of hearing over time in the endemic population.[5] However, the degree of loss or regression depends on the amount of evolutionary time and whether or not the moth species has developed secondary uses for hearing.[9] Some bats are known to use clicks at frequencies above or below moths' hearing ranges.[7] This is known as the allotonic frequency hypothesis. It argues that the auditory systems in moths have driven their bat predators to use higher or lower frequency echolocation to circumvent the moth hearing.[10]Barbastelle bats have evolved to use a quieter mode of echolocation, calling at a reduced volume and further reducing the volume of their clicks as they close in on prey moths.[7] The lower volume of clicks reduces the effective successful hunting range, but results in a significantly higher number of moths caught than other, louder bat species.[7][11] Moths have further evolved the ability to discriminate between high and low echolocation click rates, which indicates whether the bat has just detected their presence or is actively pursuing them.[7] This allows them to decide whether or not defensive ultrasonic clicks are worth the time and energy expenditure.[12]

The rough-skinned newt and the common garter snake

Rough-skinned newts have skin glands that contain tetrodotoxin (TTX) as a defense against predation. This toxin binds reversibly to sodium channels in nerve cells and interferes with the normal flow of sodium ions in and out of the cell. This has the effect of inducing paralysis and death. Throughout much of the newt’s range, the common garter snake has been observed to exhibit resistance to the tetrodotoxin in the newts' skin. While in principle the toxin binds to a tube shaped protein that acts as a sodium channel in the snake's nerve cells, researchers have identified a genetic mutation in several snake populations where the protein is configured in such a way as to hamper or prevent binding of the toxin. In each of these populations, the snakes exhibit resistance to the toxin and successfully prey upon the newts. The mutations in the snake’s genes that conferred resistance to the toxin have resulted in a selective pressure that favors newts that produce more potent levels of toxin. Increases in newt toxicity then apply a selective pressure favoring snakes with mutations conferring even greater resistance. This evolutionary arms race has resulted in the newts producing levels of toxin far in excess of what is needed to kill any other conceivable predator. Toxin-resistant garter snakes are the only known animals today that can eat a rough-skinned newt and survive.[13][14][15] The interactions between garter snakes and newts have been studied to understand the coevolution between the two species. In populations where the two live together, higher levels of TTX and resistance to TTX are observed in newts and garter snakes respectively. In populations where the species are separated, the TTX levels and resistance are lower when compared to the sympatric populations.[16] While isolated garter snakes have lower resistance, they still demonstrate an ability to resist low levels of TTX exposure. This fact suggests that garter snakes are predisposed to the development of TTX resistance and that it may be an ancestral trait.[17] The resistance of garter snakes is measured by observing a snake’s crawling speed after it has ingested or been injected with TTX. The most resistant snakes continue to crawl at normal speeds even after high levels of TTX have been given. The snakes on the lower end of the spectrum show decreased movement and signs of paralysis when exposed to TTX.[18] The lower levels of resistance observed in separated populations of newts and garter snakes suggest that there is a fitness cost associated with both TTX production and resistance. The snakes with high levels of TTX resistance have slower average crawl speeds when compared to isolated populations of snakes.[19] Slower crawl speeds make the snakes more susceptible to predators. This illustrates that while it is advantageous to be resistant to TTX when newts are present, it becomes more costly in the absence of selective pressures from the newt. The same pattern is seen in isolated populations of newts. In these populations, where garter snakes are absent, newts have lower levels of TTX in their skin. This demonstrates that there is some cost to the newt to have a high level of toxin.[20] This relationship creates a geographic pattern of resistance in populations. There are areas known as hotspots in which levels of TTX and resistance are extremely high. This alludes to a close interaction between newts and snakes. There are also areas of coldspots where newts and snakes have minimal interaction, leading to lower levels of TTX production and resistance.[19]

Predator whelk and the hard-shelled bivalve prey

The whelk predators used their own shell to open the shell of their prey, oftentimes breaking both shells of the predator and prey in the process. This led to the fitness of larger-shelled prey to be higher and then more selected for through generations, however, the predator’s population selected for those who were more efficient at opening the larger-shelled prey.[21] This example is an excellent example of asymmetrical arms race because while the prey is evolving a physical trait, the predators are adapting in a much different way.

Floodplain death adders and separate species of frogs

Phillips and Shine did a study with the chemical defenses of toxic frogs in response to a snake predator, the floodplain death adders. These snakes eat three types of frogs, one nontoxic, one producing mucus when taken by the predator, and the highly toxic frogs, however, the snakes have also found if they wait to consume their toxic prey the potency decreases. In this specific case, the asymmetry enabled the snakes to overcome the chemical defenses of the toxic frogs after their death.[22] The results of the study showed that the snake became accustomed to the differences in the frogs by their hold and release timing, always holding the nontoxic, while always releasing the highly toxic frogs, with the frogs that discharge mucus somewhere in between. The snakes would also spend generously more time gaped between the release of the highly toxic frogs than the short gaped time between the release of the frogs that discharge mucus. Therefore, the snakes have a much higher advantage of being able to cope with the different frogs defensive mechanisms, while the frogs could eventually increase the potency of their toxic knowing the snakes would adapt to that change as well, such as the snakes having venom themselves for the initial attack.[22] This study showed that even with the dangerous prey, the coevolution is still highly asymmetrical because of the incredible advantage the predators have compared to the prey.

Introduced species

Cane Toads have experienced a massive population explosion in Australia due to the lack of competition.

When a species has not been subject to an arms race previously, it may be at a severe disadvantage and face extinction well before it could ever hope to adapt to a new predator, competitor, etc. This should not seem surprising, as one species may have been in evolutionary struggles for millions of years while the other might never have faced such pressures. This is a common problem in isolated ecosystems such as Australia or the Hawaiian Islands. In Australia, many invasive species, such as cane toads and rabbits, have spread rapidly due to a lack of competition and a lack of adaptations to cane toad bufotenine on the part of potential predators. Introduced species are a major reason why some indigenous species become endangered or even extinct, as was the case with the dodo.

Phylogenetic tree

From Wikipedia, the free encyclopedia
 
Bacteria Archaea Eucaryota Aquifex Thermotoga Cytophaga Bacteroides Bacteroides-Cytophaga Planctomyces Cyanobacteria Proteobacteria Spirochetes Gram-positive bacteria Green filantous bacteria Pyrodicticum Thermoproteus Thermococcus celer Methanococcus Methanobacterium Methanosarcina Halophiles Entamoebae Slime mold Animal Fungus Plant Ciliate Flagellate Trichomonad Microsporidia Diplomonad
A speculatively rooted tree for rRNA genes, showing the three life domains Bacteria, Archaea, and Eukaryota, and linking the three branches of living organisms to the LUCA (the black trunk at the bottom of the tree); cf. next graphic.
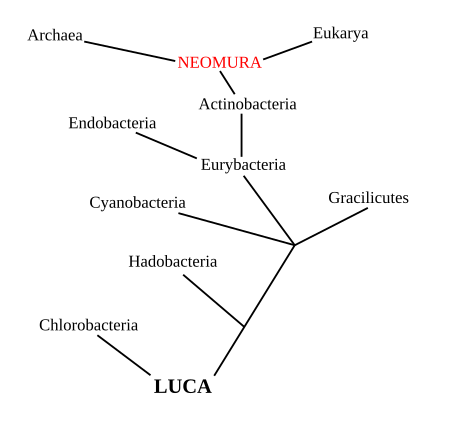
A rooted phylogenetic tree, illustrating how Eukaryota and Archaea are more closely related to each other than to Bacteria (based on Cavalier-Smith's theory of bacterial evolution). Neomura is a clade composed of two life domains, Archaea and Eukaryota. LUCA, a variant of LUA, stands for last universal common ancestor.

A phylogenetic tree or evolutionary tree is a branching diagram or "tree" showing the inferred evolutionary relationships among various biological species or other entities—their phylogeny—based upon similarities and differences in their physical or genetic characteristics. The taxa joined together in the tree are implied to have descended from a common ancestor. Phylogenetic trees are central to the field of phylogenetics.

In a rooted phylogenetic tree, each node with descendants represents the inferred most recent common ancestor of the descendants, and the edge lengths in some trees may be interpreted as time estimates. Each node is called a taxonomic unit. Internal nodes are generally called hypothetical taxonomic units, as they cannot be directly observed. Trees are useful in fields of biology such as bioinformatics, systematics, and phylogenetic comparative methods.

Unrooted trees illustrate only the relatedness of the leaf nodes and do not require the ancestral root to be known or inferred.

History

The idea of a "tree of life" arose from ancient notions of a ladder-like progression from lower into higher forms of life (such as in the Great Chain of Being). Early representations of "branching" phylogenetic trees include a "paleontological chart" showing the geological relationships among plants and animals in the book Elementary Geology, by Edward Hitchcock (first edition: 1840).
Charles Darwin (1859) also produced one of the first illustrations and crucially popularized the notion of an evolutionary "tree" in his seminal book The Origin of Species. Over a century later, evolutionary biologists still use tree diagrams to depict evolution because such diagrams effectively convey the concept that speciation occurs through the adaptive and semirandom splitting of lineages. Over time, species classification has become less static and more dynamic.

The term phylogenetic, or phylogeny, derives from the two ancient greek words φῦλον (phûlon), meaning "genus, species", and γένεσις (génesis), meaning "origin, source".[1][2]

Types

Rooted tree

A rooted phylogenetic tree (see two graphics at top) is a directed tree with a unique node — the root — corresponding to the (usually imputed) most recent common ancestor of all the entities at the leaves of the tree. The root node does not have a parent node, but serves as the parent of all other nodes in the tree. The root is therefore a node of degree 2 while other internal nodes have a minimum degree of 3 (where "degree" here refers to the total number of incoming and outgoing edges).

The most common method for rooting trees is the use of an uncontroversial outgroup—close enough to allow inference from trait data or molecular sequencing, but far enough to be a clear outgroup.

Unrooted tree

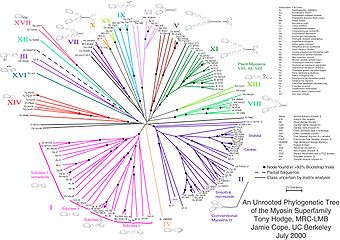
An unrooted phylogenetic tree for myosin, a superfamily of proteins.[3]

Unrooted trees illustrate the relatedness of the leaf nodes without making assumptions about ancestry. They do not require the ancestral root to be known or inferred.[4] Unrooted trees can always be generated from rooted ones by simply omitting the root. By contrast, inferring the root of an unrooted tree requires some means of identifying ancestry. This is normally done by including an outgroup in the input data so that the root is necessarily between the outgroup and the rest of the taxa in the tree, or by introducing additional assumptions about the relative rates of evolution on each branch, such as an application of the molecular clock hypothesis.[5]

Bifurcating tree

Both rooted and unrooted phylogenetic trees can be either bifurcating or multifurcating, and either labeled or unlabeled. A rooted bifurcating tree has exactly two descendants arising from each interior node (that is, it forms a binary tree), and an unrooted bifurcating tree takes the form of an unrooted binary tree, a free tree with exactly three neighbors at each internal node. In contrast, a rooted multifurcating tree may have more than two children at some nodes and an unrooted multifurcating tree may have more than three neighbors at some nodes. A labeled tree has specific values assigned to its leaves, while an unlabeled tree, sometimes called a tree shape, defines a topology only. The number of possible trees for a given number of leaf nodes depends on the specific type of tree, but there are always more multifurcating than bifurcating trees, more labeled than unlabeled trees, and more rooted than unrooted trees. The last distinction is the most biologically relevant; it arises because there are many places on an unrooted tree to put the root. For labeled bifurcating trees, there are:
{\displaystyle (2n-3)!!={\frac {(2n-3)!}{2^{n-2}(n-2)!}}\,\,{\text{for}}\,n\geq 2}
total rooted trees and
{\displaystyle (2n-5)!!={\frac {(2n-5)!}{2^{n-3}(n-3)!}}\,\,{\text{for}}\,n\geq 3}
total unrooted trees, where n represents the number of leaf nodes. Among labeled bifurcating trees, the number of unrooted trees with n leaves is equal to the number of rooted trees with n-1 leaves.[6]

Special tree types

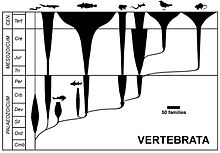
A spindle diagram, showing the evolution of the vertebrates at class level, width of spindles indicating number of families. Spindle diagrams are often used in evolutionary taxonomy.
 
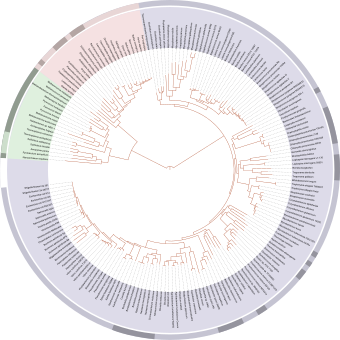
A highly resolved, automatically generated tree of life, based on completely sequenced genomes.[7][8]
  • A dendrogram is a general name for a tree, whether phylogenetic or not, and hence also for the diagrammatic representation of a phylogenetic tree [9].
  • A cladogram is a phylogenetic tree formed using cladistic methods. This type of tree only represents a branching pattern; i.e., its branch spans do not represent time or relative amount of character change [10].
  • A phylogram is a phylogenetic tree that has branch spans proportional to the amount of character change [11].
  • A chronogram is a phylogenetic tree that explicitly represents evolutionary time through its branch spans.
  • A spindle diagram (often called a Romerogram after the American palaeontologist Alfred Romer) is the representation of the evolution and abundance of the various taxa through time.
  • A Dahlgrenogram is a diagram representing a cross section of a phylogenetic tree
  • A phylogenetic network is not strictly speaking a tree, but rather a more general graph, or a directed acyclic graph in the case of rooted networks. They are used to overcome some of the limitations inherent to trees.

Construction

Phylogenetic trees composed with a nontrivial number of input sequences are constructed using computational phylogenetics methods. Distance-matrix methods such as neighbor-joining or UPGMA, which calculate genetic distance from multiple sequence alignments, are simplest to implement, but do not invoke an evolutionary model. Many sequence alignment methods such as ClustalW also create trees by using the simpler algorithms (i.e. those based on distance) of tree construction. Maximum parsimony is another simple method of estimating phylogenetic trees, but implies an implicit model of evolution (i.e. parsimony). More advanced methods use the optimality criterion of maximum likelihood, often within a Bayesian Framework, and apply an explicit model of evolution to phylogenetic tree estimation.[6] Identifying the optimal tree using many of these techniques is NP-hard,[6] so heuristic search and optimization methods are used in combination with tree-scoring functions to identify a reasonably good tree that fits the data.
Tree-building methods can be assessed on the basis of several criteria:[12]
  • efficiency (how long does it take to compute the answer, how much memory does it need?)
  • power (does it make good use of the data, or is information being wasted?)
  • consistency (will it converge on the same answer repeatedly, if each time given different data for the same model problem?)
  • robustness (does it cope well with violations of the assumptions of the underlying model?)
  • falsifiability (does it alert us when it is not good to use, i.e. when assumptions are violated?)
Tree-building techniques have also gained the attention of mathematicians. Trees can also be built using T-theory.[13]

Limitations

Although phylogenetic trees produced on the basis of sequenced genes or genomic data in different species can provide evolutionary insight, they have important limitations. Most importantly, they do not necessarily accurately represent the evolutionary history of the included taxa. In fact, they are literally scientific hypotheses, subject to falsification by further study (e.g., gathering of additional data, analyzing the existing data with improved methods). The data on which they are based is noisy;[14] the analysis can be confounded by genetic recombination,[15] horizontal gene transfer,[16] hybridisation between species that were not nearest neighbors on the tree before hybridisation takes place, convergent evolution, and conserved sequences.

Also, there are problems in basing the analysis on a single type of character, such as a single gene or protein or only on morphological analysis, because such trees constructed from another unrelated data source often differ from the first, and therefore great care is needed in inferring phylogenetic relationships among species. This is most true of genetic material that is subject to lateral gene transfer and recombination, where different haplotype blocks can have different histories. In general, the output tree of a phylogenetic analysis is an estimate of the character's phylogeny (i.e. a gene tree) and not the phylogeny of the taxa (i.e. species tree) from which these characters were sampled, though ideally, both should be very close. For this reason, serious phylogenetic studies generally use a combination of genes that come from different genomic sources (e.g., from mitochondrial or plastid vs. nuclear genomes), or genes that would be expected to evolve under different selective regimes, so that homoplasy (false homology) would be unlikely to result from natural selection.

When extinct species are included in a tree, they are terminal nodes, as it is unlikely that they are direct ancestors of any extant species. Skepticism might be applied when extinct species are included in trees that are wholly or partly based on DNA sequence data, because little useful "ancient DNA" is preserved for longer than 100,000 years, and except in the most unusual circumstances no DNA sequences long enough for use in phylogenetic analyses have yet been recovered from material over 1 million years old.

The range of useful DNA materials has expanded with advances in extraction and sequencing technologies. Development of technologies able to infer sequences from smaller fragments, or from spatial patterns of DNA degradation products, would further expand the range of DNA considered useful.

In some organisms, endosymbionts have an independent genetic history from the host.

Phylogenetic networks are used when bifurcating trees are not suitable, due to these complications which suggest a more reticulate evolutionary history of the organisms sampled.

Most recent common ancestor

From Wikipedia, the free encyclopedia

In biology and genealogy, the most recent common ancestor (MRCA, also last common ancestor LCA, or concestor[1]) of any set of organisms is the most recent individual from which all the organisms are directly descended. The term is also used in reference to the ancestry of groups of genes (haplotypes) rather than organisms.

The MRCA of a set of individuals can sometimes be determined by referring to an established pedigree. However, in general, it is impossible to identify the exact MRCA of a large set of individuals, but an estimate of the time at which the MRCA lived can often be given. Such time to MRCA (TMRCA) estimates can be given based on DNA test results and established mutation rates as practiced in genetic genealogy, or by reference to a non-genetic, mathematical model or computer simulation.

In organisms using sexual reproduction, the matrilinear MRCA and patrilinear MRCA are the MRCAs of a given population considering only matrilineal and patrilineal descent, respectively. The MRCA of a population by definition cannot be older than either its matrilinear or its patrilinear MRCA. In the case of Homo sapiens, the matrilinear and patrilinear MRCA are also known as "Mitochondrial Eve" (mt-MRCA) and "Y-chromosomal Adam" (Y-MRCA) respectively.

The age of the human MRCA is unknown. It is necessarily younger than the age of both Y-MRCA and mt-MRCA, estimated at around 200,000 years, and it may be as recent as some 3,000 years ago.[2]

The Last Universal Common Ancestor (LUCA) is the most recent common ancestor of all current life on Earth, estimated to have lived some 3.5 to 3.8 billion years ago (in the Paleoarchean).[3]

MRCA of different species


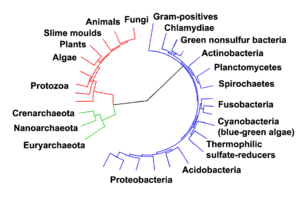
Evolutionary tree showing the divergence of modern species from the last universal ancestor in the center.[4] The three domains are colored, with bacteria blue, archaea green, and eukaryotes red.

The project of a complete description of the phylogeny of biological species is dubbed the "Tree of Life". This involves time estimates of all known speciation events; for example, the MRCA of all Carnivora (i.e. the MRCA of "cats and dogs") is estimated to have lived of the order of 42 million years ago (Miacidae).[5]

The concept of the last common ancestor from the perspective of human evolution is described for a popular audience in The Ancestor's Tale by Richard Dawkins (2004). Dawkins lists "concestors" of the human lineage in order of increasing age, including hominin (human-chimpanzee), hominine (human-gorilla), hominid (human-orangutan), hominoid (human-gibbon), and so on in 40 stages in total, down to the last universal ancestor (human-bacteria).

MRCA of a population identified by a single genetic marker

It is also possible to consider the ancestry of individual genes (or groups of genes, haplotypes) instead of an organism as a whole. Coalescent theory describes a stochastic model of how the ancestry of such genetic markers maps to the history of a population.
Unlike organisms, a gene is passed down from a generation of organisms to the next generation either as perfect replicas of itself or as slightly mutated descendant genes. While organisms have ancestry graphs and progeny graphs via sexual reproduction, a gene has a single chain of ancestors and a tree of descendants. An organism produced by sexual cross-fertilization (allogamy) has at least two ancestors (its immediate parents), but a gene always has one ancestor per generation.

Patrilineal and matrilineal MRCA

Through random drift or selection, lineage will trace back to a single person. In this example over 5 generations, the colors represent extinct matrilineal lines and black the matrilineal line descended from the mt-MRCA.

Mitochondrial DNA (mtDNA) is nearly immune to sexual mixing, unlike the nuclear DNA whose chromosomes are shuffled and recombined in Mendelian inheritance. Mitochondrial DNA, therefore, can be used to trace matrilineal inheritance and to find the Mitochondrial Eve (also known as the African Eve), the most recent common ancestor of all humans via the mitochondrial DNA pathway.

Likewise, Y chromosome is present as a single sex chromosome in the male individual and is passed on to male descendants without recombination. It can be used to trace patrilineal inheritance and to find the Y-chromosomal Adam, the most recent common ancestor of all humans via the Y-DNA pathway.

Mitochondrial Eve and Y-chromosomal Adam have been established by researchers using genealogical DNA tests. Mitochondrial Eve is estimated to have lived about 200,000 years ago. A paper published in March 2013 determined that, with 95% confidence and that provided there are no systematic errors in the study's data, Y-chromosomal Adam lived between 237,000 and 581,000 years ago.[6][7]

The MRCA of humans alive today would, therefore, need to have lived more recently than either.[8][9]

It is more complicated to infer human ancestry via autosomal chromosomes. Although an autosomal chromosome contains genes that are passed down from parents to children via independent assortment from only one of the two parents, genetic recombination (chromosomal crossover) mixes genes from non-sister chromatids from both parents during meiosis, thus changing the genetic composition of the chromosome.

Time to MRCA estimates

Different types of MRCAs are estimated to have lived at different times in the past. These time to MRCA (TMRCA) estimates are also computed differently depending on the type of MRCA being considered. Patrilineal and matrilineal MRCAs (Mitochondrial Eve and Y-chromosomal Adam) are traced by single gene markers, thus their TMRCA are computed based on DNA test results and established mutation rates as practiced in genetic genealogy. Time to genealogical MRCA of all living humans is computed based on non-genetic, mathematical models and computer simulations.

Since Mitochondrial Eve and Y-chromosomal Adam are traced by single genes via a single ancestral parent line, the time to these genetic MRCAs will necessarily be greater than that for the genealogical MRCA. This is because single genes will coalesce more slowly than tracing of conventional human genealogy via both parents. The latter considers only individual humans, without taking into account whether any gene from the computed MRCA actually survives in every single person in the current population.[10]

TMRCA via genetic markers

Mitochondrial DNA can be used to trace the ancestry of a set of populations. In this case, populations are defined by the accumulation of mutations on the mtDNA, and special trees are created for the mutations and the order in which they occurred in each population. The tree is formed through the testing of a large number of individuals all over the world for the presence or lack of a certain set of mutations. Once this is done it is possible to determine how many mutations separate one population from another. The number of mutations, together with estimated mutation rate of the mtDNA in the regions tested, allows scientists to determine the approximate time to MRCA (TMRCA) which indicates time passed since the populations last shared the same set of mutations or belonged to the same haplogroup.

In the case of Y-Chromosomal DNA, TMRCA is arrived at in a different way. Y-DNA haplogroups are defined by single-nucleotide polymorphism in various regions of the Y-DNA. The time to MRCA within a haplogroup is defined by the accumulation of mutations in STR sequences of the Y-Chromosome of that haplogroup only. Y-DNA network analysis of Y-STR haplotypes showing a non-star cluster indicates Y-STR variability due to multiple founding individuals. Analysis yielding a star cluster can be regarded as representing a population descended from a single ancestor. In this case the variability of the Y-STR sequence, also called the microsatellite variation, can be regarded as a measure of the time passed since the ancestor founded this particular population. The descendants of Genghis Khan or one of his ancestors represents a famous star cluster that can be dated back to the time of Genghis Khan.[11]

TMRCA calculations are considered critical evidence when attempting to determine migration dates of various populations as they spread around the world. For example, if a mutation is deemed to have occurred 30,000 years ago, then this mutation should be found amongst all populations that diverged after this date. If archeological evidence indicates cultural spread and formation of regionally isolated populations then this must be reflected in the isolation of subsequent genetic mutations in this region. If genetic divergence and regional divergence coincide it can be concluded that the observed divergence is due to migration as evidenced by the archaeological record. However, if the date of genetic divergence occurs at a different time than the archaeological record, then scientists will have to look at alternate archaeological evidence to explain the genetic divergence. The issue is best illustrated in the debate surrounding the demic diffusion versus cultural diffusion during the European Neolithic.[12]

TMRCA of all living humans

The age of the MRCA of all living humans is unknown. It is necessarily younger than the age of either the matrilinear or the patrilinear MRCA, both of which have an estimated age of between roughly 100,000 and 200,000 years ago.[13]

A mathematical, but non-genealogical study by mathematicians Joseph T. Chang, Douglas Rhode and Steve Olson calculated that the MRCA lived remarkably recently, about 3,000 years ago. This model took into account that people do not truly mate randomly, but that, particularly in the past, people almost always mated with people who lived nearby, and usually with people who lived in their own town or village. It would have been especially rare to mate with somebody who lived in another country. However, Chang et al found that a rare person who mates with a person far away will in time connect the worldwide family tree, and that no population is truly completely isolated. [14]

The MRCA of all humans almost certainly lived in East Asia, which would have given them key access to extremely isolated populations in Australia and the Americas. Possible locations for the MRCA include places such as the Chuckchi and Kamchatka Peninsulas that are close to Alaska, places such as Indonesia and Malaysia that are close to Australia or a place such as Taiwan or Japan that is more intermediate to Australia and the Americas. European colonization of the Americas and Australia was found by Chang to be too recent to have had a substantial impact on the age of the MRCA. In fact, if the Americas and Australia had never been discovered, the MRCA would only be about 2.3% further back in the past than it is. [15] [16]

Note that the age of the MRCA of a population does not correspond to a population bottleneck, let alone a "first couple". It rather reflects the presence of a single individual with high reproductive success in the past, whose genetic contribution has become pervasive throughout the population over time. It is also incorrect to assume that the MRCA passed all, or indeed any, genetic information to every living person. Through sexual reproduction, an ancestor passes half of his or her genes to each descendant in the next generation; after more than 32 generations the contribution of a single ancestor would be on the order of 2−32, a number proportional to less than a single basepair within the human genome.[17][18]

Identical ancestors point

The MRCA is the most recent common ancestor shared by all individuals in the population under consideration. This MRCA may well have contemporaries who are also ancestral to some but not all of the extant population. The identical ancestors point is a point in the past more remote than the MRCA at which time there are no longer organisms which are ancestral to some but not all of the modern population. Due to pedigree collapse, modern individuals may still exhibit clustering, due to vastly different contributions from each of ancestral population.

Genetic genealogy

From Wikipedia, the free encyclopedia

Genetic genealogy is the use of DNA testing in combination with traditional genealogical methods to infer relationships between individuals and find ancestors. Genetic genealogy involves the use of genealogical DNA testing to determine the level and type of the genetic relationship between individuals. This application of genetics became popular with family historians in the 21st century, as tests became affordable. The tests have been promoted by amateur groups, such as surname study groups, or regional genealogical groups, as well as research projects such as the genographic project. As of 2018, 12 million people had been tested. As this field has developed, the aims of practitioners broadened, with many seeking knowledge of their ancestry beyond the recent centuries for which traditional pedigrees can be constructed.

History

George Darwin was the first to estimate the frequency of first-cousin marriages

The investigation of surnames in genetics can be said to go back to George Darwin, a son of Charles Darwin. In 1875, George Darwin used surnames to estimate the frequency of first-cousin marriages and calculated the expected incidence of marriage between people of the same surname (isonymy). He arrived at a figure between 2.25% and 4.5% for cousin-marriage in the population of Great Britain, higher among the upper classes and lower among the general rural population.[1]

Surname studies

One famous study examined the lineage of descendants of Thomas Jefferson’s paternal line and male lineage descendants of the freed slave, Sally Hemmings.[2]

Bryan Sykes, a molecular biologist at Oxford University tested the new methodology in general surname research. His study of the Sykes surname obtained results by looking at four STR markers on the male chromosome. It pointed the way to genetics becoming a valuable assistant in the service of genealogy and history.[3]

Direct to consumer DNA testing

The first company to provide direct-to-consumer genetic DNA testing was the now defunct GeneTree. However, it did not offer multi-generational genealogy tests. In fall 2001, GeneTree sold its assets to Salt Lake City-based Sorenson Molecular Genealogy Foundation (SMGF) which originated in 1999.[4] While in operation, SMGF provided free Y-Chromosome and mitochondrial DNA tests to thousands.[5] Later, GeneTree returned to genetic testing for genealogy in conjunction with the Sorenson parent company and eventually was part of the assets acquired in the Ancestry.com buyout of SMGF.[6]
In 2000, Family Tree DNA, founded by Bennett Greenspan and Max Blankfeld, was the first company dedicated to direct-to-consumer testing for genealogy research. They initially offered eleven marker Y-Chromosome STR tests and HVR1 mitochondrial DNA tests. They originally tested in partnership with the University of Arizona.[7][8][9][10][11]

In 2007, 23andMe was the first company to offer a saliva-based direct-to-consumer genetic testing.[12] It was also the first to implement using autosomal DNA for ancestry testing, which all other major companies now use.[13][14]

By 2018, over 12 million people had had their DNA tested for genealogical purposes - most of whom were American.[15]

The genetic genealogy revolution

The publication of The Seven Daughters of Eve by Sykes in 2001, which described the seven major haplogroups of European ancestors, helped push personal ancestry testing through DNA tests into wide public notice. With the growing availability and affordability of genealogical DNA testing, genetic genealogy as a field grew rapidly. By 2003, the field of DNA testing of surnames was declared officially to have “arrived” in an article by Jobling and Tyler-Smith in Nature Reviews Genetics.[16] The number of firms offering tests, and the number of consumers ordering them, rose dramatically.[17]

The Genographic Project

The original Genographic Project was a five-year research study launched in 2005 by the National Geographic Society and IBM, in partnership with the University of Arizona and Family Tree DNA. Its goals were primarily anthropological. The project announced that by April 2010 it had sold more than 350,000 of its public participation testing kits, which test the general public for either twelve STR markers on the Y-Chromosome or mutations on the HVR1 region of the mtDNA.[18]

In 2007, annual sales of genetic genealogical tests for all companies, including the laboratories that support them, were estimated to be in the area of $60 million (2006).[5]

Typical customers and interest groups

Genetic genealogy has enabled groups of people to trace their ancestry even though they are not able to use conventional genealogical techniques. This may be because they do not know one or both of their birth parents or because conventional genealogical records have been lost, destroyed or never existed. These groups include adoptees, foundlings, Holocaust survivors, GI babies, child migrants, descendants of children from orphan trains and people with slave ancestry.[19][20]

The earliest test takers were customers most often those who started with a Y-Chromosome test to determine their father's paternal ancestry. These men often took part in surname projects. The first phase of the Genographic project brought new participants into genetic genealogy. Those who tested were as likely to be interested in direct maternal heritage as their paternal. The number of those taking mtDNA tests increased. The introduction of autosomal SNP tests based on microarray chip technology changed the demographics. Women were as likely as men to test themselves.

Citizen science and ISOGG

Members of the growing genetic genealogy community have been credited with making useful contributions to knowledge in the field.[21]
One of the earliest interest groups to emerge was the International Society of Genetic Genealogy (ISOGG). Their stated goal is to promote DNA testing for genealogy.[22] Members advocate the use of genetics in genealogical research and the group facilitates networking among genetic genealogists.[23] Since 2006 ISOGG has maintained the regularly updated ISOGG Y-chromosome phylogenetic tree.[23][24] ISOGG aims to keep the tree as up-to-date as possible, incorporating new SNPs.[25] However, the tree has been described by academics as not completely academically verified, phylogenetic trees of Y chromosome haplogroups.[26]

Autosomal DNA 2007-present

In 2007, 23andMe was the first major company to begin offering a test of the autosome. This is the DNA excluding the Y-chromosomes and mitochondria. It is inherited from all ancestors in recent generations and so can be used to match with other testers who may be related. Later on, companies were also able to use this data to estimate how much of each ethnicity a customer has.

FamilyTreeDNA entered this market in 2010, and AncestryDNA in 2012. Since then the number of DNA tests has expanded rapidly. By 2017, the combined totals of customers at the four largest companies was nearly 10 million.[27][28][29] Autosomal testing is now the dominant type of genealogical DNA test, and for many companies the only test they offer.

Uses

Direct maternal lineages

mtDNA testing involves sequencing at least part of the mitochondria. The mitochondria is inherited from mother to child, and so can reveal information about the direct maternal line. When two individuals have matching or near mitochondria, is can be projected that they share a common maternal-line ancestor at some point in the recent past.

Direct paternal lineages

Y-Chromosome DNA (Y-DNA) testing involves short tandem repeat (STR) and, sometimes, single nucleotide polymorphism (SNP) testing of the Y-Chromosome. The Y-Chromosome is present only in males and only reveals information on the strict-paternal line. As with the mitochondria, close matches with individuals indicate a recent common ancestor. Because surnames in many cultures are transmitted down the paternal line, this testing is often used by [Surname DNA Project]s.

Ancestral origins

A common component of many autosomal tests is a prediction of biogeographical origin. The company offering the test uses computer algorithms and calculations to make a prediction of what percentage of an individual's DNA comes from particular ancestral groups. A typical number of populations is at least 20. Despite this aspect of the tests being heavily promoted and advertised, many genetic genealogists have warned consumers that the results may be inaccurate, and at best are only approximate.[30]
Modern DNA sequencing has identified various ancestral components in contemporary populations. A number of these genetic elements have West Eurasian origins. They include the following ancestral components, with their geographical hubs and main associated populations:

# West Eurasian component Geographical hub Peak population Notes
1 Ancestral North Indian North India, Pakistan North Indians, Pakistanis Main West Eurasian component in the Indian subcontinent. Peaks among Indo-European-speaking caste populations in the northern areas, but also found at significant frequencies among some Dravidian-speaking caste groups. Associated with either the arrival of Indo-European speakers from West Asia or Central Asia between 3,000 and 4,000 years before present, or with the spread of agriculture and West Asian crops beginning around 8,000-9,000 ybp, or with migrations from West Asia in the pre-agricultural period. Contrasted with the indigenous Ancestral South Indian component, which peaks among the Onge Andamanese inhabiting the Andaman Islands.[31][32]
2 Arabian Arabian peninsula Yemenis, Saudis, Qataris, Bedouins Main West Eurasian component in the Persian Gulf region. Most closely associated with local Arabic, Semitic-speaking populations.[33] Also found at significant frequencies in parts of the Levant, Egypt and Libya.[33][34]
3 Coptic Nile Valley Copts, Beja, Afro-Asiatic Ethiopians, Sudanese Arabs, Nubians Main West Eurasian component in Northeast Africa.[35] Roughly equivalent with the Ethio-Somali component.[35][36] Peaks among Egyptian Copts in Sudan. Also found at high frequencies among other Afro-Asiatic (Hamito-Semitic) speakers in Ethiopia and Sudan, as well as among many Nubians. Associated with Ancient Egyptian ancestry, without the later Arabian influence present among modern Egyptians. Contrasted with the indigenous Nilo-Saharan component, which peaks among Nilo-Saharan- and Kordofanian-speaking populations inhabiting the southern part of the Nile Valley.[35]
4 Ethio-Somali Horn of Africa Somalis, Afars, Amhara, Oromos, Tigrinya Main West Eurasian component in the Horn.[36] Roughly equivalent with the Coptic component.[35][36] Associated with the arrival of Afro-Asiatic speakers in the region during antiquity. Peaks among Cushitic- and Ethiopian Semitic-speaking populations in the northern areas. Diverged from the Maghrebi component around 23,000 ybp, and from the Arabian component about 25,000 ybp. Contrasted with the indigenous Omotic component, which peaks among the Omotic-speaking Ari ironworkers inhabiting southern Ethiopia.[36]
5 European Europe Europeans Main West Eurasian component in Europe. Also found at significant frequencies in adjacent geographical areas outside of the continent, in Anatolia, the Caucasus, the Iranian plateau, and parts of the Levant.[33]
6 Levantine Near East, Caucasus Druze, Lebanese, Cypriots, Syrians, Jordanians, Palestinians, Armenians, Georgians, Sephardic Jews, Ashkenazi Jews, Iranians, Turks, Sardinians, Adygei Main West Eurasian component in the Near East and Caucasus. Peaks among Druze populations in the Levant. Found amongst local Afro-Asiatic, Indo-European, Caucasus and Turkish speakers alike. Diverged from the European component around 9,100-15,900 ybp, and from the Arabian component about 15,500-23,700 ypb. Also found at significant frequencies in Southern Europe as well as parts of the Arabian peninsula.[33]
7 Maghrebi Northwest Africa Berbers, Maghrebis, Sahrawis, Tuareg Main West Eurasian component in the Maghreb. Peaks among the Berber (non-Arabized) populations in the region.[34] Diverged from the Ethio-Somali/Coptic, Arabian, Levantine and European components prior to the Holocene.[34][36]

Human migration

Genealogical DNA testing methods are in use on a longer time scale to trace human migratory patterns. For example, they determined when the first humans came to North America and what path they followed.
For several years, researchers and laboratories from around the world sampled indigenous populations from around the globe in an effort to map historical human migration patterns. The National Geographic Society's Genographic Project aims to map historical human migration patterns by collecting and analyzing DNA samples from over 100,000 people across five continents. The DNA Clans Genetic Ancestry Analysis measures a person's precise genetic connections to indigenous ethnic groups from around the world.

Biodiversity loss

From Wikipedia, the free encyclopedia https://en.wikipedia.org/wiki/Biodiversity_loss   ...