Search This Blog

Monday, December 10, 2018

Agrivoltaic

From Wikipedia, the free encyclopedia

Agrivoltaics is co-developing the same area of land for both solar photovoltaic power as well as for conventional agriculture. This technique was originally conceived by Adolf Goetzberger and Armin Zastrow in 1981. The coexistence of solar panels and crops implies a sharing of light between these two types of production.

Agrivoltaics has been massively implemented in Japan since 2004 and then, Agrivoltaics has expanded in Asia and Europe. Several crops can benefit from these systems, including fruit production.

History

In 1981, Adolf Goetzberger and Armin Zastrow were the first to propose the concept of a dual use of arable land for solar energy production and plant cultivation in order to improve overall production. They were addressing the ongoing discussion on the competition for the use of arable land between solar energy production and crop. The light saturation point is the maximum amount of photons absorbable by a plant species. As more photons won’t increase to the rate of photosynthesis, Akira Nagashima suggest to combine PV systems and farming to use the excess of light. He developed the first prototypes in Japan in 2004.

The term “agrivoltaic“ was used for the first time in a publication in 2011. The concept is known under several names in the world: "agrophotovoltaics" in Germany, "agrovoltaics" in Italy, "solar sharing" in Asia. Facilities such as photovoltaic greenhouses can be considered as agrivoltaic systems. 

As one of the objectives of the agricultural systems is to preserve agricultural land, it is generally considered that agricultural production in agrivoltaic should not be neglected. The constraints on agricultural production vary from one country to another according to the legislation or according to the type of crop and to the objectives of the agrivoltaic system (optimization of the volume of agricultural production, quality of agricultural products, energy production...).

Agrivoltaics in the world

Asia

Japan has been the forerunner in the development of open field agrivoltaics worldwide since 2004. Between 2004 and 2017, more than 1,000 open field power plants were developed in Japan.

Japan

In 2004 in Japan, Akira Nagashima developed a demountable structure that he tested on several crops. Since then, many field projects have been installed in Japan with a large number of crops (citrus fruits, peanuts, eggplants, cucumbers, cabbage, rice, vines, mushrooms ...) or livestock. Removable structures allow farmers to remove or move facilities based on crop rotations and their needs. Increasingly large plants with capacities of several MW have been developed since 2004 with permanent structures and dynamic systems. For example, a 35 MW power plant, installed on 54 ha of crops, was commissioned in 2017. The shading rate of this plant is 50%, a value higher than the 30% shading usually used on Japanese agrivoltaic power plants. Farmers cultivate, among others, ginseng, ashitaba and coriander. Soon, the island of Ukujima should host a solar power plant of 480 MW, part of which will be agrivoltaics. The project has been under study since 2013 and the various partners have signed an agreement for the start of construction in 2019.

To obtain permission to exploit solar panels over crops, Japanese law requires farmers to maintain at least 80% of agricultural production.

China

In 2016, the Italian company REM TEC built a 0.5 MWp agrivoltaic power plant in Jinzhai County, Anhui Province. Chinese companies have developed several GWs of solar power plants combining agriculture and solar energy production, either photovoltaic greenhouses or open-field installations. For example, in August 2016, Panda Green Energy installed solar panels over vineyards in Turpan, Xinjiang Uygur Autonomous Region. The 0.2 MW plant was connected to the grid. The project was audited in October 2017 and the company has received approval to roll out its system across the country. Projects of several tens of MW have been deployed. For instance, in 2016, in Jiangxi Province, a 70 MW agrivoltaic plant was installed on agricultural and forestry crops.

For 30 years, the Elion Group has been trying to combat desertification in the Kubuqi region. Among the techniques used, agrivoltaic systems were installed to protect crops and produce electricity. Regarding the equipment for the desert areas, Wan You-Bao patented in 2007 on a shade system to protect crops in the desert. The shades are equipped with solar panels.

South Korea

South Korea is conducting initial tests of agrivoltaic power plants, drawing on the Japanese example since 2017. Agrivoltaic is one of the solutions studied to increase the share of renewable energies in Korea's energy mix. Their goal is to reach 20% renewable energy in 2030 against 5% in 2017.

India

Projects for isolated sites are being studied by Amity University in Noida, northern India. A study published in 2017 looks at the potential of agrivoltaism for vineyards in India. The agrivoltaic systems studied in this article consist of solar panels intercalated between crops to limit shading on plants. This study suggests that agrivoltaic systems can significantly increase the incomes of Indian farmers.

Malaysia

The Universiti Putra Malaysia, which specializes in agronomy, launched experiments in 2015 on plantations of Orthosiphon stamineus (Java tea). It is a fixed structure installed on an experimental surface of about 0.4 ha.

Vietnam

Fraunhofer ISE has deployed their agrivoltaic system on a shrimp farm located in Bac Liêu in the Mekong Delta. According to this institute, the results of their pilot project indicate that water consumption has been reduced by 75%. Their system would offer other benefits such as shading for workers as well as a lower and stable water temperature for better shrimp growth.

Europe

In Europe in the early 2000s, photovoltaic greenhouses are emerging. Part of the greenhouse roof is replaced by solar panels. In Austria and then in Italy, open field agrivoltaic systems appeared from 2007, followed by France and Germany.

Austria

In 2004, Günter Czaloun proposed a photovoltaic tracking system with a rope rack system. The first prototype is built in South Tyrol in 2007 on a 0.1 ha area. The cable structure is more than five meters above ground. A new system was presented at the Intersolar 2017 conference in Munich. This technology is potentially less expensive than other open field systems because it requires less steel.

Italy

In 2009 and 2011, agrivoltaic systems with fixed panels were installed above vineyards. Experiments showed a slight decrease of the yield and late harvests. 

In 2009, the Italian company REM TEC develops a dual-axis solar tracking system. In 2011 and 2012, REM TEC built several MWp of open field agrivoltaic power plants. The solar panels are installed 5 m above the ground to operate agricultural machinery. The cover of photovoltaic panels shadow is less than 15% to minimize the effect on the crops. They are the first to offer automated integrated shading net systems into the supporting structure. REM TEC also designs dual-axis solar tracking systems integrated into greenhouse structure. The control of the position of the solar panels would optimize the greenhouse microclimate.

France

Photovoltaic greenhouses
Since the beginning of the 2000s, photovoltaic greenhouses have been built in France. Photovoltaic greenhouse designers continue to innovate to improve both agricultural production and power generation. For instance, the concept of Agrinergie has been developed by Akuo Energy [fr] since 2007. The first power plants consisted of alternation of crops and solar panels. The new power plants are greenhouses. In 2017, the Tenergie company began the deployment of photovoltaic greenhouses with an architecture that diffuses light in order to reduce the contrasts between light bands and shade bands created by solar panels.
Open field systems
Since 2009, INRA, IRSTEA and Sun'R [fr] have been working on the Sun'Agri program. A first prototype installed in the field with fixed panels is built in 2009 on a surface of 0.1 ha in Montpellier. Other prototypes with 1-axis mobile panels were built in 2014 and 2017. The aim of these studies is to manage the microclimate received by plants and to produce electricity, by optimizing the position of the panels. and to study how radiation is distributed between crops and solar panels. The first agrivoltaic plant in the open field of Sun'R is built in the spring of 2018 in Tresserre in the Pyrénées-Orientales. This plant has a capacity of 2.2 MWp installed on 4.5 ha of vineyards. It will evaluate, on a large scale and in real conditions, the performance of the Sun'Agri system on vineyards

In 2016, the Agrivolta company specialized on the agrivoltaïcs. After a first prototype built in 2017 in Aix-en-Provence, Agrivolta deployed its system on a plot of the National Research Institute of Horticulture (Astredhor) in Hyères. Agrivolta win several innovation prizes Agrivolta presented its technology at the CES in Las Vegas in January 2018.

Germany

In 2011, the Fraunhofer Institute ISE started a reaserch project on agrivoltaics. Research continues with the APV-Resola project, which began in 2015 and is scheduled to end in 2020. A first prototype of 194.4 kWp is being built in 2016 on a 0.5 ha site belonging to the Hofgemeinschaft Heggelbach cooperative farm in Herdwangen (Baden-Württemberg). They estimate that such structures will be profitable without government fundings after 2022.

Danemark

The Agronomy Department of the Aarhus University has launched a study project of agrivoltaic system on orchards in 2014.

Croatia

In 2017, Work-ing d.o.o installed a 500 kW open field power plant near Virovitica-Podravina. The agronomic studies are supported by the University of Osijek and the agricultural engineering school of Slatina. The electricity production is used for the irrigation system and agricultural machinery. At first, shade-adapted cultures will be tested under the device.

America

USA

In the United States, SolAgra is interested in the concept in collaboration with the Department of Agronomy at the University of California at Davis. A first poxer plant on 0.4 ha is under development. An area of 2.8 ha is used as a control. Several types of crops are studied: alfalfa, sorghum, lettuce, spinach, beets, carrots, chard, radishes, potatoes, arugula, mint, turnips, kale, parsley, coriander, beans, peas, shallots, mustard ... Projects for isolated sites are also studied. Experimental systems are being studied by several universities: the Biosphere 2 project at the University of Arizona, the Stockbridge School of Agriculture project (University of Massachusetts at Amherst).

Chile

Three 13 kWp agro-photovoltaic systems were built in Chile in 2017. The goal of this project, supported by the Metropolitan Region of Santiago, was to study the plants that can benefit from the shading of the agrivoltaic system. The electricity produced was used to power agricultural facilities: cleaning, packaging and cold storage of agricultural production, incubator for eggs ... One of the systems was installed in a region with a lot of power outages.

Methods

There are three types of Agrivoltaics that are being actively researched: solar arrays with space between for crops, stilted solar array above crops and greenhouse solar array. All three of these systems have several variables used to maximize solar energy absorbed in both the panels and the crops. The main variable taken into account for agrivoltaic systems is the angle of the solar panels-called the tilt angle. Other variables taken into account for choosing the location of the agrivoltaic system are the crops chosen, height of the panels, solar irradiation in the area and climate of the area.

Configuration of agrivoltaic systems

There are different configurations of agrivoltaic devices. Goetzberger and Zastrow have studied the conditions for optimizing agrivoltaic installations. Presented in the early 1980s, these conditions still serve as a reference in the definition of agrivoltaic systems:
  • Orientation of solar panels in the south for fixed or east-west panels for panels rotating on an axis;
  • Sufficient spacing between solar panels for sufficient light transmission to ground crops;
  • Elevation of the supporting structure of the solar panels to homogenize the amounts of radiation on the ground.
Experimental facilities often have a control agricultural area. The control zone is exploited under the same conditions as the agrivoltaic device in order to study the effects of the device on the development of crops.

Fixed solar panels over crops

The simplest approach is to install fixed solar panels on agricultural greenhouses, above open fields crops or between open fields crops. It is possible to optimize the installation by modifying the density of solar panels or the inclination of the panels. In Japan, agrivoltaic systems generally consist of dismountable light structures with light and small size solar panels to reduce wind resistance.

Dynamic Agrivoltaic

In more elaborate configurations, agrivoltaic system use a tracking system. Solar panels can be controlled to optimize their positioning to improve agricultural production or electricity production.
The first dynamic agrivoltaic devices were developed in Japan. The panels are manually adjustable. Farmers can modify the position of the solar panels according to the season or stage of crop development to increase or decrease shading and power generation. Japanese companies have also developed several more sophisticated systems. For example, crops grow under systems composed of tables (25 solar panels) fixed dual axis tracker.

In 2004, Günter Czaloun proposed a photovoltaic tracking system with a rope rack system. Panels can be oriented to improve power generation or shade crops as needed. The first prototype is built in 2007 in Austria. The company REM TEC has deployed several plants equipped with dual axis tracking system in Italy and China. They have also developed an equivalent system used for agricultural greenhouses

In France, Sun'R and Agrivolta companies are developing single axis tracking systems. According to these companies, their systems can be adapgted to the needs of plants. The Sun'R system is east-west axis tracking system. According to this company, complex models of plant growth, weather forecasts, calculation and optimization software are used. The device from Agrivolta is equipped with south-facing solar panels that can be erased by a sliding system.

The Artigianfer company developed a photovoltaic greenhouse whose solar panels are installed on movable shutters. The panels can follow the course of the Sun along an east-west axis.

The difficulty of such systems is to find the mode of operation to maintain the good balance between the two types of production according to the goals of the system. Fine control of the panels to adapt shading to the need of plants requires advanced agronomic skills to understand the development of plants. Experimental devices are usually developed in collaboration with research centers.

Effects

The solar panels of Agrivoltaics affects crops and land they cover in ways more than providing shade. Two ways are affecting water flow and heat. They also allow for more revenue per acre to be created. For example, grape farms with appropriate spacing could increase revenue 15 times.

Water Flow

In experiments testing evaporation levels under PVP for shade resistant crops cucumbers and lettuce watered by irrigation, a 14-29% savings in evaporation was found. Agrivoltaics could be used for crops or areas where water efficiency is imperative.

Heat

A study was done on the heat of the land, air and crops under solar panels for a growing season. It was found that while the air beneath the panels stayed consistent, the land and plants had lower temperatures recorded. With rising temperature from climate change this may become important for some food crops.

Advantages

Simulations and studies on Agrivoltaics indicate electricity and shade-resistant crop production do not decrease in productivity, allowing both to be simultaneously produced efficiently. Dinesh et al. found lettuce output was found to be comparable in Agrivoltaics to monocultures. Agrivoltaics work best for plants that are shade resistant, with potential functioning crops being "hog peanut, alfalfa, yam, taro, cassava, sweet potato" along with lettuce. Simulations performed by Dupraz et al. found the potential of land productivity to increase by 60-70%. Furthermore, Dinesh et al. found that the value of solar generated electricity coupled to shade-tolerant crop production created an over 30% increase in economic value from farms deploying agrivoltaic systems instead of conventional agriculture. It has been postulated that Agrivoltaics would be beneficial for summer crops for the microclimate they create and the side effect of heat and water flow control.

Disadvantages

Shade resistant crops are not typically grown in industrial agricultural systems. For instance, wheat crops do not fare well in a low light environment, meaning they would not work with Agrivoltaics. Agrivoltaics do not yet work with greenhouses. Greenhouses with half of the roof covered in panels were simulated, and the resulting crop output reduced by 64% and panel productivity reduced by 84%.
Theory of solar cells

From Wikipedia, the free encyclopedia

The theory of solar cells explains the process by which light energy in photons is converted into electric current when the photons strike a suitable semiconductor device. The theoretical studies are of practical use because they predict the fundamental limits of a solar cell, and give guidance on the phenomena that contribute to losses and solar cell efficiency.
 
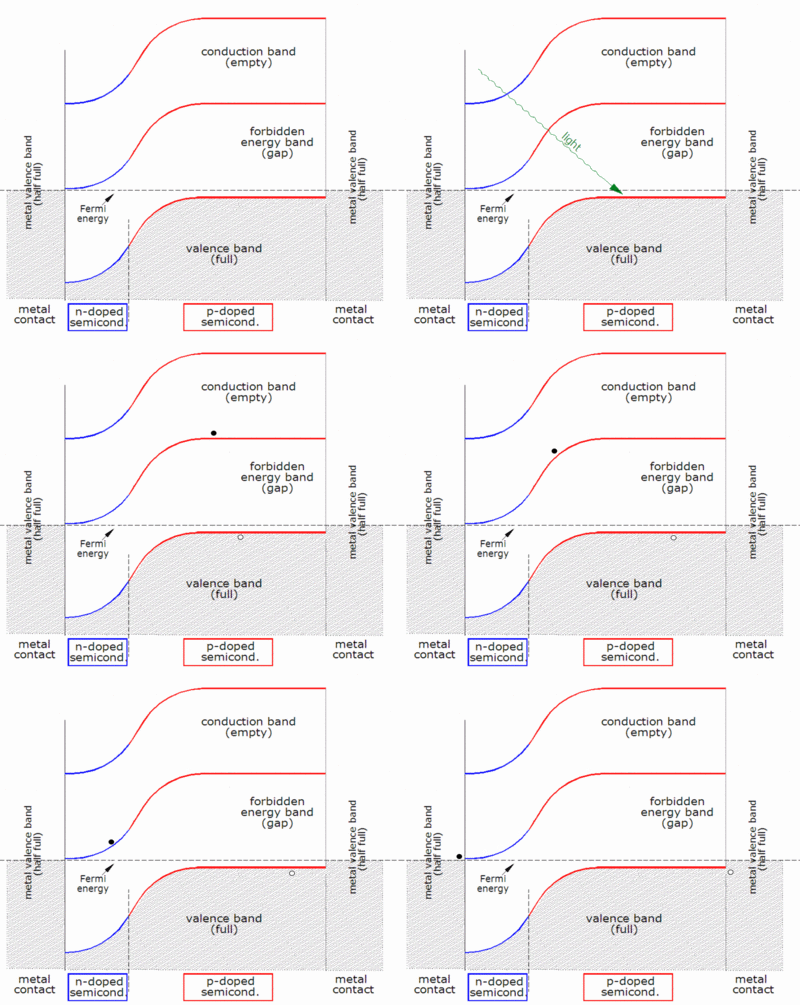
Band diagram of a solar cell, corresponding to very low current (horizontal Fermi level), very low voltage (metal valence bands at same height), and therefore very low illumination

Simple explanation

  • Photons in sunlight hit the solar panel and are absorbed by semi-conducting materials.
  • Electrons (negatively charged) are knocked loose from their atoms as they are excited. Due to their special structure and the materials in solar cells, the electrons are only allowed to move in a single direction. The electronic structure of the materials is very important for the process to work, and often silicon incorporating small amounts of boron or phosphorus is used in different layers.
  • An array of solar cells converts solar energy into a usable amount of direct current (DC) electricity.

Photogeneration of charge carriers

When a photon hits a piece of silicon, one of three things can happen:
  1. The photon can pass straight through the silicon — this (generally) happens for lower energy photons.
  2. The photon can reflect off the surface.
  3. The photon can be absorbed by the silicon if the photon energy is higher than the silicon band gap value. This generates an electron-hole pair and sometimes heat depending on the band structure.
Band diagram of a silicon solar cell, corresponding to very low current (horizontal Fermi level), very low voltage (metal valence bands at same height), and therefore very low illumination

When a photon is absorbed, its energy is given to an electron in the crystal lattice. Usually this electron is in the valence band. The energy given to the electron by the photon "excites" it into the conduction band where it is free to move around within the semiconductor. The network of covalent bonds that the electron was previously a part of now has one fewer electron. This is known as a hole. The presence of a missing covalent bond allows the bonded electrons of neighboring atoms to move into the "hole," leaving another hole behind, thus propagating holes throughout the lattice. It can be said that photons absorbed in the semiconductor create electron-hole pairs. 

A photon only needs to have energy greater than that of the band gap in order to excite an electron from the valence band into the conduction band. However, the solar frequency spectrum approximates a black body spectrum at about 5,800 K, and as such, much of the solar radiation reaching the Earth is composed of photons with energies greater than the band gap of silicon. These higher energy photons will be absorbed by the solar cell, but the difference in energy between these photons and the silicon band gap is converted into heat (via lattice vibrations — called phonons) rather than into usable electrical energy. The photovoltaic effect can also occur when two photons are absorbed simultaneously in a process called two-photon photovoltaic effect. However, high optical intensities are required for this nonlinear process.

The p-n junction

The most commonly known solar cell is configured as a large-area p-n junction made from silicon. As a simplification, one can imagine bringing a layer of n-type silicon into direct contact with a layer of p-type silicon. In practice, p-n junctions of silicon solar cells are not made in this way, but rather by diffusing an n-type dopant into one side of a p-type wafer (or vice versa). 

If a piece of p-type silicon is placed in close contact with a piece of n-type silicon, then a diffusion of electrons occurs from the region of high electron concentration (the n-type side of the junction) into the region of low electron concentration (p-type side of the junction). When the electrons diffuse across the p-n junction, they recombine with holes on the p-type side. However (in the absence of an external circuit) this diffusion of carriers does not go on indefinitely because charges build up on either side of the junction and create an electric field. The electric field promotes charge flow, known as drift current, that opposes and eventually balances out the diffusion of electrons and holes. This region where electrons and holes have diffused across the junction is called the depletion region because it contains practically no mobile charge carriers. It is also known as the space charge region, although space charge extends a bit further in both directions than the depletion region.

Charge carrier separation

There are two causes of charge carrier motion and separation in a solar cell:
  1. drift of carriers, driven by the electric field, with electrons being pushed one way and holes the other way
  2. diffusion of carriers from zones of higher carrier concentration to zones of lower carrier concentration (following a gradient of chemical potential).
These two "forces" may work one against the other at any given point in the cell. For instance, an electron moving through the junction from the p region to the n region (as in the diagram at the beginning of this article) is being pushed by the electric field against the concentration gradient. The same goes for a hole moving in the opposite direction. 

It is easiest to understand how a current is generated when considering electron-hole pairs that are created in the depletion zone, which is where there is a strong electric field. The electron is pushed by this field toward the n side and the hole toward the p side. (This is opposite to the direction of current in a forward-biased diode, such as a light-emitting diode in operation.) When the pair is created outside the space charge zone, where the electric field is smaller, diffusion also acts to move the carriers, but the junction still plays a role by sweeping any electrons that reach it from the p side to the n side, and by sweeping any holes that reach it from the n side to the p side, thereby creating a concentration gradient outside the space charge zone. 

In thick solar cells there is very little electric field in the active region outside the space charge zone, so the dominant mode of charge carrier separation is diffusion. In these cells the diffusion length of minority carriers (the length that photo-generated carriers can travel before they recombine) must be large compared to the cell thickness. In thin film cells (such as amorphous silicon), the diffusion length of minority carriers is usually very short due to the existence of defects, and the dominant charge separation is therefore drift, driven by the electrostatic field of the junction, which extends to the whole thickness of the cell.

Once the minority carrier enters the drift region, it is 'swept' across the junction and, at the other side of the junction, becomes a majority carrier. This reverse current is a generation current, fed both thermally and (if present) by the absorption of light. On the other hand, majority carriers are driven into the drift region by diffusion (resulting from the concentration gradient), which leads to the forward current; only the majority carriers with the highest energies (in the so-called Boltzmann tail; cf. Maxwell–Boltzmann statistics) can fully cross the drift region. Therefore, the carrier distribution in the whole device is governed by a dynamic equilibrium between reverse current and forward current.

Connection to an external load

Ohmic metal-semiconductor contacts are made to both the n-type and p-type sides of the solar cell, and the electrodes connected to an external load. Electrons that are created on the n-type side, or created on the p-type side, "collected" by the junction and swept onto the n-type side, may travel through the wire, power the load, and continue through the wire until they reach the p-type semiconductor-metal contact. Here, they recombine with a hole that was either created as an electron-hole pair on the p-type side of the solar cell, or a hole that was swept across the junction from the n-type side after being created there. 

The voltage measured is equal to the difference in the quasi Fermi levels of the majority carriers (electrons in the n-type portion and holes in the p-type portion) at the two terminals.

Equivalent circuit of a solar cell

The equivalent circuit of a solar cell
 
The schematic symbol of a solar cell

To understand the electronic behavior of a solar cell, it is useful to create a model which is electrically equivalent, and is based on discrete ideal electrical components whose behavior is well defined. An ideal solar cell may be modelled by a current source in parallel with a diode; in practice no solar cell is ideal, so a shunt resistance and a series resistance component are added to the model. The resulting equivalent circuit of a solar cell is shown on the left. Also shown, on the right, is the schematic representation of a solar cell for use in circuit diagrams.

Characteristic equation

From the equivalent circuit it is evident that the current produced by the solar cell is equal to that produced by the current source, minus that which flows through the diode, minus that which flows through the shunt resistor:
where
  • I = output current (ampere)
  • IL = photogenerated current (ampere)
  • ID = diode current (ampere)
  • ISH = shunt current (ampere).
The current through these elements is governed by the voltage across them:
where
  • Vj = voltage across both diode and resistor RSH (volt)
  • V = voltage across the output terminals (volt)
  • I = output current (ampere)
  • RS = series resistance (Ω).
By the Shockley diode equation, the current diverted through the diode is:
where
By Ohm's law, the current diverted through the shunt resistor is:
where
  • RSH = shunt resistance (Ω).
Substituting these into the first equation produces the characteristic equation of a solar cell, which relates solar cell parameters to the output current and voltage:
An alternative derivation produces an equation similar in appearance, but with V on the left-hand side. The two alternatives are identities; that is, they yield precisely the same results. 

Since the parameters I0, n, RS, and RSH cannot be measured directly, the most common application of the characteristic equation is nonlinear regression to extract the values of these parameters on the basis of their combined effect on solar cell behavior. 

When RS is not zero, the above equation does not give the current I directly, but it can then be solved using the Lambert W function:
When an external load is used with the cell, its resistance can simply be added to RS and V set to zero in order to find the current.

When RSH is infinite there is a solution for V for any less than :
Otherwise one can solve for V using the Lambert W function:
However, when RSH is large it's better to solve the original equation numerically.

The general form of the solution is a curve with I decreasing as V increases (see graphs lower down). The slope at small or negative V (where the W function is near zero) approaches , whereas the slope at high V approaches .

Open-circuit voltage and short-circuit current

When the cell is operated at open circuit, I = 0 and the voltage across the output terminals is defined as the open-circuit voltage. Assuming the shunt resistance is high enough to neglect the final term of the characteristic equation, the open-circuit voltage VOC is:
Similarly, when the cell is operated at short circuit, V = 0 and the current I through the terminals is defined as the short-circuit current. It can be shown that for a high-quality solar cell (low RS and I0, and high RSH) the short-circuit current ISC is:
It is not possible to extract any power from the device when operating at either open circuit or short circuit conditions.

Effect of physical size

The values of IL, I0, RS, and RSH are dependent upon the physical size of the solar cell. In comparing otherwise identical cells, a cell with twice the junction area of another will, in principle, have double the IL and I0 because it has twice the area where photocurrent is generated and across which diode current can flow. By the same argument, it will also have half the RS of the series resistance related to vertical current flow; however, for large-area silicon solar cells, the scaling of the series resistance encountered by lateral current flow is not easily predictable since it will depend crucially on the grid design (it is not clear what "otherwise identical" means in this respect). Depending on the shunt type, the larger cell may also have half the RSH because it has twice the area where shunts may occur; on the other hand, if shunts occur mainly at the perimeter, then RSH will decrease according to the change in circumference, not area. 

Since the changes in the currents are the dominating ones and are balancing each other, the open-circuit voltage is practically the same; VOC starts to depend on the cell size only if RSH becomes too low. To account for the dominance of the currents, the characteristic equation is frequently written in terms of current density, or current produced per unit cell area:
where
  • J = current density (ampere/cm2)
  • JL = photogenerated current density (ampere/cm2)
  • J0 = reverse saturation current density (ampere/cm2)
  • rS = specific series resistance (Ω-cm2)
  • rSH = specific shunt resistance (Ω-cm2).
This formulation has several advantages. One is that since cell characteristics are referenced to a common cross-sectional area they may be compared for cells of different physical dimensions. While this is of limited benefit in a manufacturing setting, where all cells tend to be the same size, it is useful in research and in comparing cells between manufacturers. Another advantage is that the density equation naturally scales the parameter values to similar orders of magnitude, which can make numerical extraction of them simpler and more accurate even with naive solution methods. 

There are practical limitations of this formulation. For instance, certain parasitic effects grow in importance as cell sizes shrink and can affect the extracted parameter values. Recombination and contamination of the junction tend to be greatest at the perimeter of the cell, so very small cells may exhibit higher values of J0 or lower values of RSH than larger cells that are otherwise identical. In such cases, comparisons between cells must be made cautiously and with these effects in mind. 

This approach should only be used for comparing solar cells with comparable layout. For instance, a comparison between primarily quadratical solar cells like typical crystalline silicon solar cells and narrow but long solar cells like typical thin film solar cells can lead to wrong assumptions caused by the different kinds of current paths and therefore the influence of, for instance, a distributed series resistance contribution to rS. Macro-architecture of the solar cells could result in different surface areas being placed in any fixed volume - particularly for thin film solar cells and flexible solar cells which may allow for highly convoluted folded structures. If volume is the binding constraint, then efficiency density based on surface area may be of less relevance.

Transparent conducting electrodes

Schematic of charge collection by solar cell electrodes. Light transmits through transparent conducting electrode creating electron hole pairs, which are collected by both the electrodes.
 
Transparent conducting electrodes are essential components of solar cells. It is either a continuous film of indium tin oxide or a conducting wire network, in which wires are charge collectors while voids between wires are transparent for light. An optimum density of wire network is essential for the maximum solar cell performance as higher wire density blocks the light transmittance while lower wire density leads to high recombination losses due to more distance traveled by the charge carriers.

Cell temperature

Effect of temperature on the current-voltage characteristics of a solar cell

Temperature affects the characteristic equation in two ways: directly, via T in the exponential term, and indirectly via its effect on I0 (strictly speaking, temperature affects all of the terms, but these two far more significantly than the others). While increasing T reduces the magnitude of the exponent in the characteristic equation, the value of I0 increases exponentially with T. The net effect is to reduce VOC (the open-circuit voltage) linearly with increasing temperature. The magnitude of this reduction is inversely proportional to VOC; that is, cells with higher values of VOC suffer smaller reductions in voltage with increasing temperature. For most crystalline silicon solar cells the change in VOC with temperature is about -0.50%/°C, though the rate for the highest-efficiency crystalline silicon cells is around -0.35%/°C. By way of comparison, the rate for amorphous silicon solar cells is -0.20%/°C to -0.30%/°C, depending on how the cell is made. 

The amount of photogenerated current IL increases slightly with increasing temperature because of an increase in the number of thermally generated carriers in the cell. This effect is slight, however: about 0.065%/°C for crystalline silicon cells and 0.09% for amorphous silicon cells. 

The overall effect of temperature on cell efficiency can be computed using these factors in combination with the characteristic equation. However, since the change in voltage is much stronger than the change in current, the overall effect on efficiency tends to be similar to that on voltage. Most crystalline silicon solar cells decline in efficiency by 0.50%/°C and most amorphous cells decline by 0.15-0.25%/°C. The figure above shows I-V curves that might typically be seen for a crystalline silicon solar cell at various temperatures.

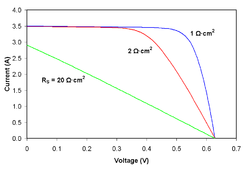
Series resistance

Effect of series resistance on the current-voltage characteristics of a solar cell

As series resistance increases, the voltage drop between the junction voltage and the terminal voltage becomes greater for the same current. The result is that the current-controlled portion of the I-V curve begins to sag toward the origin, producing a significant decrease in the terminal voltage and a slight reduction in ISC, the short-circuit current. Very high values of RS will also produce a significant reduction in ISC; in these regimes, series resistance dominates and the behavior of the solar cell resembles that of a resistor. These effects are shown for crystalline silicon solar cells in the I-V curves displayed in the figure to the right. 

Losses caused by series resistance are in a first approximation given by Ploss=VRsI=I2RS and increase quadratically with (photo-)current. Series resistance losses are therefore most important at high illumination intensities.

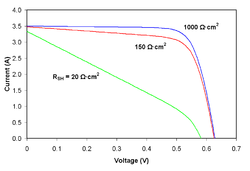
Shunt resistance

Effect of shunt resistance on the current–voltage characteristics of a solar cell

As shunt resistance decreases, the current diverted through the shunt resistor increases for a given level of junction voltage. The result is that the voltage-controlled portion of the I-V curve begins to sag far from the origin, producing a significant decrease in the terminal current I and a slight reduction in VOC. Very low values of RSH will produce a significant reduction in VOC. Much as in the case of a high series resistance, a badly shunted solar cell will take on operating characteristics similar to those of a resistor. These effects are shown for crystalline silicon solar cells in the I-V curves displayed in the figure to the right.

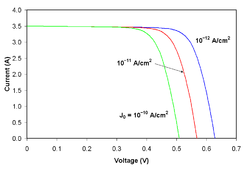
Reverse saturation current

Effect of reverse saturation current on the current-voltage characteristics of a solar cell

If one assumes infinite shunt resistance, the characteristic equation can be solved for VOC:
Thus, an increase in I0 produces a reduction in VOC proportional to the inverse of the logarithm of the increase. This explains mathematically the reason for the reduction in VOC that accompanies increases in temperature described above. The effect of reverse saturation current on the I-V curve of a crystalline silicon solar cell are shown in the figure to the right. Physically, reverse saturation current is a measure of the "leakage" of carriers across the p-n junction in reverse bias. This leakage is a result of carrier recombination in the neutral regions on either side of the junction.

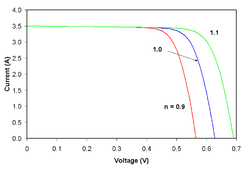
Ideality factor

Effect of ideality factor on the current-voltage characteristics of a solar cell

The ideality factor (also called the emissivity factor) is a fitting parameter that describes how closely the diode's behavior matches that predicted by theory, which assumes the p-n junction of the diode is an infinite plane and no recombination occurs within the space-charge region. A perfect match to theory is indicated when n = 1. When recombination in the space-charge region dominate other recombination, however, n = 2. The effect of changing ideality factor independently of all other parameters is shown for a crystalline silicon solar cell in the I-V curves displayed in the figure to the right. 

Most solar cells, which are quite large compared to conventional diodes, well approximate an infinite plane and will usually exhibit near-ideal behavior under Standard Test Condition (n ≈ 1). Under certain operating conditions, however, device operation may be dominated by recombination in the space-charge region. This is characterized by a significant increase in I0 as well as an increase in ideality factor to n ≈ 2. The latter tends to increase solar cell output voltage while the former acts to erode it. The net effect, therefore, is a combination of the increase in voltage shown for increasing n in the figure to the right and the decrease in voltage shown for increasing I0 in the figure above. Typically, I0 is the more significant factor and the result is a reduction in voltage.

Sometimes, the ideality factor is observed to be greater than 2, which is generally attributed to the presence of Schottky diode or heterojunction in the solar cell. The presence of a heterojunction offset reduces the collection efficiency of the solar cell and may contribute to low fill-factor.

Inequality (mathematics)

From Wikipedia, the free encyclopedia https://en.wikipedia.org/wiki/Inequality...