Search This Blog

Wednesday, February 19, 2020

Ural Mountains

From Wikipedia, the free encyclopedia
https://en.wikipedia.org/wiki/Ural_Mountains
 
Ural Mountains
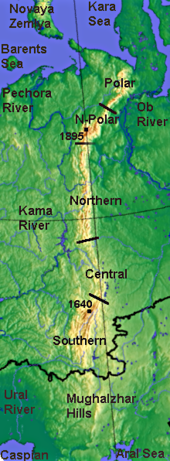
Ural Mountains Map 2.png
Highest point
PeakMount Narodnaya
Elevation1,895 m (6,217 ft)
Coordinates60°N 60°ECoordinates: 60°N 60°E
Dimensions
Length2,500 km (1,600 mi)
Width150 km (93 mi)
Geography
CountriesRussia and Kazakhstan
Geology
Age of rockCarboniferous

The Ural Mountains (/ˈjʊərəl/; Russian: Ура́льские го́ры, tr. Uralskiye gory, IPA: [ʊˈralʲskʲɪjə ˈgorɨ]; Bashkir: Урал тауҙары, Ural tauźarı), or simply the Urals, are a mountain range that runs approximately from north to south through western Russia, from the coast of the Arctic Ocean to the Ural River and northwestern Kazakhstan. The mountain range forms part of the conventional boundary between the continents of Europe and Asia. Vaygach Island and the islands of Novaya Zemlya form a further continuation of the chain to the north into the Arctic Ocean.

The mountains lie within the Ural geographical region and significantly overlap with the Ural Federal District and with the Ural economic region. They have rich resources, including metal ores, coal, and precious and semi-precious stones. Since the 18th century the mountains have contributed significantly to the mineral sector of the Russian economy.

Etymology

As attested by Sigismund von Herberstein, in the 16th century Russians called the range by a variety of names derived from the Russian words for rock (stone) and belt. The modern Russian name for the Urals (Урал, Ural), first appearing in the 16th–17th century when the Russian conquest of Siberia was in its heroic phase, was initially applied to its southern parts and gained currency as the name of the entire range during the 18th century. It might have been a borrowing from either Turkic "stone belt" (Bashkir, where the same name is used for the range), or Ob-Ugric. From the 13th century, in Bashkortostan there has been a legend about a hero named Ural. He sacrificed his life for the sake of his people and they poured a stone pile over his grave, which later turned into the Ural Mountains. Possibilities include Bashkir үр "elevation; upland" and Mansi ур ала "mountain peak, top of the mountain", V.N. Tatischev believes that this oronym is set to "belt" and associates it with the Turkic verb oralu- "gird". I.G. Dobrodomov suggests a transition from Aral to Ural explained on the basis of ancient Bulgar-Chuvash dialects. Geographer E.V. Hawks believes that the name goes back to the Bashkir folklore Ural-Batyr. The Evenk geographical term era "mountain" has also been theorized. Finno-Ugrist scholars consider Ural deriving from the Ostyak word urr meaning "chain of mountains". Turkologists, on the other hand, have achieved majority support for their assertion that 'ural' in Tatar means a belt, and recall that an earlier name for the range was 'stone belt'.

History

UralMountains1.png

As Middle-Eastern merchants traded with the Bashkirs and other people living on the western slopes of the Ural as far north as Great Perm, since at least the 10th century medieval mideastern geographers had been aware of the existence of the mountain range in its entirety, stretching as far as to the Arctic Ocean in the north. The first Russian mention of the mountains to the east of the East European Plain is provided by the Primary Chronicle, when it describes the Novgorodian expedition to the upper reaches of the Pechora in 1096. During the next few centuries Novgorodians engaged in fur trading with the local population and collected tribute from Yugra and Great Perm, slowly expanding southwards. The rivers Chusovaya and Belaya were first mentioned in the chronicles of 1396 and 1468, respectively. In 1430 the town of Solikamsk (Kama Salt) was founded on the Kama at the foothills of the Ural, where salt was produced in open pans. Ivan III of Moscow captured Perm, Pechora and Yugra from the declining Novgorod Republic in 1472. With the excursions of 1483 and 1499–1500 across the Ural Moscow managed to subjugate Yugra completely.

A fragment of von Herberstein's map
 
Nevertheless, around that time early 16th century Polish geographer Maciej of Miechów in his influential Tractatus de duabus Sarmatiis (1517) argued that there were no mountains in Eastern Europe at all, challenging the point of view of some authors of Classical antiquity, popular during the Renaissance. Only after Sigismund von Herberstein in his Notes on Muscovite Affairs (1549) had reported, following Russian sources, that there are mountains behind the Pechora and identified them with the Riphean Mountains and Hyperboreans of ancient authors, did the existence of the Ural, or at least of its northern part, become firmly established in the Western geography. The Middle and Southern Ural were still largely unavailable and unknown to the Russian or Western European geographers.

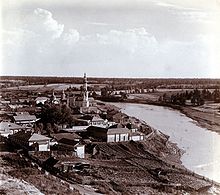
Verkhoturye in 1910

In the 1550s, after the Tsardom of Russia had defeated the Khanate of Kazan and proceeded to gradually annex the lands of the Bashkirs, the Russians finally reached the southern part of the mountain chain. In 1574 they founded Ufa. The upper reaches of the Kama and Chusovaya in the Middle Ural, still unexplored, as well as parts of Transuralia still held by the hostile Siberian Khanate, were granted to the Stroganovs by several decrees of the tsar in 1558–1574. The Stroganovs' land provided the staging ground for Yermak's incursion into Siberia. Yermak crossed the Ural from the Chusovaya to the Tagil around 1581. In 1597 Babinov's road was built across the Ural from Solikamsk to the valley of the Tura, where the town of Verkhoturye (Upper Tura) was founded in 1598. Customs was established in Verkhoturye shortly thereafter and the road was made the only legal connection between European Russia and Siberia for a long time. In 1648 the town of Kungur was founded at the western foothills of the Middle Ural. During the 17th century the first deposits of iron and copper ores, mica, gemstones and other minerals were discovered in the Ural. 

Iron and copper smelting works emerged. They multiplied particularly quickly during the reign of Peter I of Russia. In 1720–1722 he commissioned Vasily Tatishchev to oversee and develop the mining and smelting works in the Ural. Tatishchev proposed a new copper smelting factory in Yegoshikha, which would eventually become the core of the city of Perm and a new iron smelting factory on the Iset, which would become the largest in the world at the time of construction and give birth to the city of Yekaterinburg. Both factories were actually founded by Tatishchev's successor, Georg Wilhelm de Gennin, in 1723. Tatishchev returned to the Ural on the order of Empress Anna to succeed de Gennin in 1734–1737. Transportation of the output of the smelting works to the markets of European Russia necessitated the construction of the Siberian Route from Yekaterinburg across the Ural to Kungur and Yegoshikha (Perm) and further to Moscow, which was completed in 1763 and rendered Babinov's road obsolete. In 1745 gold was discovered in the Ural at Beryozovskoye and later at other deposits. It has been mined since 1747.

The first ample geographic survey of the Ural Mountains was completed in the early 18th century by the Russian historian and geographer Vasily Tatishchev under the orders of Peter I. Earlier, in the 17th century, rich ore deposits were discovered in the mountains and their systematic extraction began in the early 18th century, eventually turning the region into the largest mineral base of Russia.

One of the first scientific descriptions of the mountains was published in 1770–71. Over the next century, the region was studied by scientists from a number of countries, including Russia (geologist Alexander Karpinsky, botanist Porfiry Krylov and zoologist Leonid Sabaneyev), the United Kingdom (geologist Sir Roderick Murchison), France (paleontologist Édouard de Verneuil), and Germany (naturalist Alexander von Humboldt, geologist Alexander Keyserling). In 1845, Murchison, who had according to Encyclopædia Britannica "compiled the first geologic map of the Ural in 1841", published The Geology of Russia in Europe and the Ural Mountains with de Verneuil and Keyserling.

The first railway across the Ural had been built by 1878 and linked Perm to Yekaterinburg via Chusovoy, Kushva and Nizhny Tagil. In 1890 a railway linked Ufa and Chelyabinsk via Zlatoust. In 1896 this section became a part of the Trans-Siberian Railway. In 1909 yet another railway connecting Perm and Yekaterinburg passed through Kungur by the way of the Siberian Route. It has eventually replaced the Ufa – Chelyabinsk section as the main trunk of the Trans-Siberian railway.

The highest peak of the Ural, Mount Narodnaya, (elevation 1,895 m (6,217 ft)) was identified in 1927.

Wooded Ural Mountains

During the Soviet industrialization in the 1930s the city of Magnitogorsk was founded in the South-Eastern Ural as a center of iron smelting and steelmaking. During the German invasion of the Soviet Union in 1941–1942, the mountains became a key element in Nazi planning for the territories which they expected to conquer in the USSR. Faced with the threat of having a significant part of the Soviet territories occupied by the enemy, the government evacuated many of the industrial enterprises of European Russia and Ukraine to the eastern foothills of the Ural, considered a safe place out of reach of the German bombers and troops. Three giant tank factories were established at the Uralmash in Sverdlovsk (as Yekaterinburg used to be known), Uralvagonzavod in Nizhny Tagil, and Chelyabinsk Tractor Plant in Chelyabinsk. After the war, in 1947–1948, Chum – Labytnangi railway, built with the forced labor of Gulag inmates, crossed the Polar Ural.

Mayak, 150 km southeast of Yekaterinburg, was a center of the Soviet nuclear industry and site of the Kyshtym disaster. 
 

Geography and topography

The Ural Mountains extend about 2,500 km (1,600 mi) from the Kara Sea to the Kazakh Steppe along the border of Kazakhstan. Vaygach Island and the island of Novaya Zemlya form a further continuation of the chain on the north. Geographically this range marks the northern part of the border between the continents of Europe and Asia. Its highest peak is Mount Narodnaya, approximately 1,895 m (6,217 ft) in elevation.


By topography and other natural features, the Urals are divided, from north to south, into the Polar (or Arctic), Nether-Polar (or Sub-Arctic), Northern, Central and Southern parts. 

Polar Ural

The Polar Urals extend for about 385 kilometers (239 mi) from Mount Konstantinov Kamen in the north to the Khulga River in the south; they have an area of about 25,000 km2 (9,700 sq mi) and a strongly dissected relief. The maximum height is 1,499 m (4,918 ft) at Payer Mountain and the average height is 1,000 to 1,100 m (3,300 to 3,600 ft).

The mountains of the Polar Ural have exposed rock with sharp ridges, though flattened or rounded tops are also found.

Nether-polar Ural

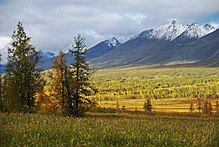
Ural Mountains in summer

The Nether-Polar Ural are higher, and up to 150 km (93 mi) wider than the Polar Urals. They include the highest peaks of the range: Mount Narodnaya (1,895 m (6,217 ft)), Mount Karpinsky (1,878 m (6,161 ft)) and Manaraga (1,662 m (5,453 ft)). They extend for more than 225 km (140 mi) south to the Shchugor River. The many ridges are sawtooth shaped and dissected by river valleys. Both Polar and Nether-Polar Urals are typically Alpine; they bear traces of Pleistocene glaciation, along with permafrost and extensive modern glaciation, including 143 extant glaciers.

Northern Ural

The Northern Ural consist of a series of parallel ridges up to 1,000–1,200 m (3,300–3,900 ft) in height and longitudinal hollows. They are elongated from north to south and stretch for about 560 km (350 mi) from the Usa River. Most of the tops are flattened, but those of the highest mountains, such as Telposiz, 1,617 m (5,305 ft) and Konzhakovsky Stone, 1,569 m (5,148 ft) have a dissected topography. Intensive weathering has produced vast areas of eroded stone on the mountain slopes and summits of the northern areas.

Middle Ural

The Central Ural are the lowest part of the Ural, with smooth mountain tops, the highest mountain being 994 m (3,261 ft) (Basegi); they extend south from the Ufa River.

Southern Ural

The relief of the Southern Ural is more complex, with numerous valleys and parallel ridges directed south-west and meridionally. The range includes the Ilmensky Mountains separated from the main ridges by the Miass River. The maximum height is 1,640 m (5,380 ft) (Mount Yamantau) and the width reaches 250 km (160 mi). Other notable peaks lie along the Iremel mountain ridge (Bolshoy Iremel and Maly Iremel). The Southern Urals extend some 550 km (340 mi) up to the sharp westward bend of the Ural River and terminate in the wide Mughalzhar Hills.

Geology

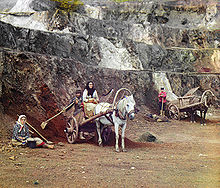
A mine in the Ural Mountains, early colour photograph by Sergey Prokudin-Gorsky, 1910
 
The Urals are among the world's oldest extant mountain ranges. For its age of 250 to 300 million years, the elevation of the mountains is unusually high. They formed during the Uralian orogeny due to the collision of the eastern edge of the supercontinent Laurussia with the young and rheologically weak continent of Kazakhstania, which now underlies much of Kazakhstan and West Siberia west of the Irtysh, and intervening island arcs. The collision lasted nearly 90 million years in the late Carboniferous – early Triassic. Unlike the other major orogens of the Paleozoic (Appalachians, Caledonides, Variscides), the Urals have not undergone post-orogenic extensional collapse and are unusually well preserved for their age, being underlaid by a pronounced crustal root. East and south of the Urals much of the orogen is buried beneath later Mesozoic and Cenozoic sediments. The adjacent Pay-Khoy Ridge to the north and Novaya Zemlya are not a part of the Uralian orogen and formed later. 

Many deformed and metamorphosed rocks, mostly of Paleozoic age, surface within the Urals. The sedimentary and volcanic layers are folded and faulted. The sediments to the west of the Ural Mountains are formed of limestone, dolomite and sandstone left from ancient shallow seas. The eastern side is dominated by basalts.

Wooded Ural Mountains in winter

The western slope of the Ural Mountains has predominantly karst topography, especially in the Sylva River basin, which is a tributary of the Chusovaya River. It is composed of severely eroded sedimentary rocks (sandstones and limestones) that are about 350 million years old. There are many caves, sinkholes and underground streams. The karst topography is much less developed on the eastern slopes. The eastern slopes are relatively flat, with some hills and rocky outcrops and contain alternating volcanic and sedimentary layers dated to the middle Paleozoic Era. Most high mountains consist of weather-resistant rocks such as quartzite, schist and gabbro that are between 570 and 395 million years old. The river valleys are underlain by limestone.

The Ural Mountains contain about 48 species of economically valuable ores and economically valuable minerals. Eastern regions are rich in chalcopyrite, nickel oxide, gold, platinum, chromite and magnetite ores, as well as in coal (Chelyabinsk Oblast), bauxite, talc, fireclay and abrasives. The Western Urals contain deposits of coal, oil, natural gas (Ishimbay and Krasnokamsk areas) and potassium salts. Both slopes are rich in bituminous coal and lignite, and the largest deposit of bituminous coal is in the north (Pechora field). The specialty of the Urals is precious and semi-precious stones, such as emerald, amethyst, aquamarine, jasper, rhodonite, malachite and diamond. Some of the deposits, such as the magnetite ores at Magnitogorsk, are already nearly depleted.

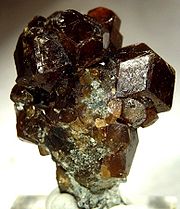
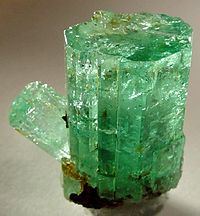
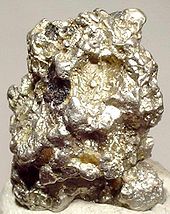
Minerals from the Ural Mountains
Andradite-23893.jpg Beryl-md20a.jpg Platinum-41654.jpg
Andradite Beryl Platinum

Rivers and lakes

Chusovaya River
 
Many rivers originate in the Ural Mountains. The western slopes south of the border between the Komi Republic and Perm Krai and the eastern slopes south of approximately 54°30'N drain into the Caspian Sea via the Kama and Ural River basins. The tributaries of the Kama include the Vishera, Chusovaya, and Belaya and originate on both the eastern and western slopes. The rest of the Urals drain into the Arctic Ocean, mainly via the Pechora basin in the west, which includes the Ilych, Shchugor, and the Usa, and via the Ob basin in the east, which includes the Tobol, Tavda, Iset, Tura and Severnaya Sosva. The rivers are frozen for more than half the year. Generally, the western rivers have higher flow volume than the eastern ones, especially in the Northern and Nether-Polar regions. Rivers are slower in the Southern Urals. This is because of low precipitation and the relatively warm climate resulting in less snow and more evaporation.

The mountains contain a number of deep lakes. The eastern slopes of the Southern and Central Urals have most of these, among the largest of which are the Uvildy, Itkul, Turgoyak, and Tavatuy lakes. The lakes found on the western slopes are less numerous and also smaller. Lake Bolshoye Shchuchye, the deepest lake in the Polar Urals, is 136 meters (446 ft) deep. Other lakes, too, are found in the glacial valleys of this region. Spas and sanatoriums have been built to take advantage of the medicinal muds found in some of the mountain lakes.

Climate

The climate of the Urals is continental. The mountain ridges, elongated from north to south, effectively absorb sunlight thereby increasing the temperature. The areas west of the Ural Mountains are 1–2 °C (1.8–3.6 °F) warmer in winter than the eastern regions because the former are warmed by Atlantic winds whereas the eastern slopes are chilled by Siberian air masses. The average January temperatures increase in the western areas from −20 °C (−4 °F) in the Polar to −15 °C (5 °F) in the Southern Urals and the corresponding temperatures in July are 10 °C (50 °F) and 20 °C (68 °F). The western areas also receive more rainfall than the eastern ones by 150–300 mm (5.9–11.8 in) per year. This is because the mountains trap clouds from the Atlantic Ocean. The highest precipitation, approximately 1,000 mm (39 in), is in the Northern Urals with up to 1,000 cm (390 in) snow. The eastern areas receive from 500–600 mm (20–24 in) in the north to 300–400 mm (12–16 in) in the south. Maximum precipitation occurs in the summer: the winter is dry because of the Siberian High.
 .

Flora


The landscapes of the Urals vary with both latitude and longitude and are dominated by forests and steppes. The southern area of the Mughalzhar Hills is a semidesert. Steppes lie mostly in the southern and especially south-eastern Urals. Meadow steppes have developed on the lower parts of mountain slopes and are covered with zigzag and mountain clovers, Serratula gmelinii, dropwort, meadow-grass and Bromus inermis, reaching the height of 60–80 cm. Much of the land is cultivated. To the south, the meadow steppes become more sparse, dry and low. The steep gravelly slopes of the mountains and hills of the eastern slopes of the Southern Urals are mostly covered with rocky steppes. River valleys contain willow, poplar and caragana shrubs.

Forest landscapes of the Urals are diverse, especially in the southern part. The western areas are dominated by dark coniferous taiga forests which change to mixed and deciduous forests in the south. The eastern mountain slopes have light coniferous taiga forests. The Northern Urals are dominated by conifers, namely Siberian fir, Siberian pine, Scots pine, Siberian spruce, Norway spruce and Siberian larch, as well as by silver and downy birches. The forests are much sparser in the Polar Urals. Whereas in other parts of the Ural Mountains they grow up to an altitude of 1000 m, in the Polar Urals the tree line is at 250–400 m. The polar forests are low and are mixed with swamps, lichens, bogs and shrubs. Dwarf birch, mosses and berries (blueberry, cloudberry, black crowberry, etc.) are abundant. The forests of the Southern Urals are the most diverse in composition: here, together with coniferous forests are also abundant broadleaf tree species such as English oak, Norway maple and elm. The Virgin Komi Forests in the northern Urals are recognized as a World Heritage site. 

Fauna

The Ural forests are inhabited by animals typical of Siberia, such as elk, brown bear, fox, wolf, wolverine, lynx, squirrel, and sable (north only). Because of the easy accessibility of the mountains there are no specifically mountainous species. In the Middle Urals, one can see a rare mixture of sable and pine marten named kidus. In the Southern Urals, badger and black polecat are common. Reptiles and amphibians live mostly in the Southern and Central Ural and are represented by the common viper, lizards and grass snakes. Bird species are represented by capercaillie, black grouse, hazel grouse, spotted nutcracker, and cuckoos. In summers, the South and Middle Urals are visited by songbirds, such as nightingale and redstart.

The steppes of the Southern Urals are dominated by hares and rodents such as gophers, susliks, and jerboa. There are many birds of prey such as lesser kestrel and buzzards. The animals of the Polar Urals are few and are characteristic of the tundra; they include Arctic fox, lemming, and reindeer. The birds of these areas include rough-legged buzzard, snowy owl, tundra partridge, and rock ptarmigan.

Ecology

The continuous and intensive economic development of the last centuries has affected the fauna, and wildlife is much diminished around all industrial centers. During World War II, hundreds of factories were evacuated from Western Russia before the German occupation, flooding the Urals with industry. The conservation measures include establishing national wildlife parks. There are nine strict nature reserves in the Urals: the Ilmen, the oldest one, mineralogical reserve founded in 1920 in Chelyabinsk Oblast, Pechora-Ilych in the Komi Republic, Bashkir and its former branch Shulgan-Tash in Bashkortostan, Visim in Sverdlovsk Oblast, Southern Ural in Bashkortostan, Basegi in Perm Krai, Vishera in Perm Krai and Denezhkin Kamen in Sverdlovsk Oblast.

The area has also been severely damaged by the plutonium-producing facility Mayak opened in Chelyabinsk-40 (later called Chelyabinsk-65, Ozyorsk), in the Southern Ural, after World War II. Its plants went into operation in 1948 and, for the first ten years, dumped unfiltered radioactive waste into the Techa River and Lake Karachay. In 1990, efforts were underway to contain the radiation in one of the lakes, which was estimated at the time to expose visitors to 500 millirem per day. As of 2006, 500 mrem in the natural environment was the upper limit of exposure considered safe for a member of the general public in an entire year (though workplace exposure over a year could exceed that by a factor of 10). Over 23,000 km2 (8,900 sq mi) of land were contaminated in 1957 from a storage tank explosion, only one of several serious accidents that further polluted the region. The 1957 accident expelled 20 million curies of radioactive material, 90% of which settled into the land immediately around the facility. Although some reactors of Mayak were shut down in 1987 and 1990, the facility keeps producing plutonium.

Cultural significance

The Urals have been viewed by Russians as a "treasure box" of mineral resources, which were the basis for its extensive industrial development. In addition to iron and copper the Urals were a source of gold, malachite, alexandrite, and other gems such as those used by the court jeweller Fabergé. As Russians in other regions gather mushrooms or berries, Uralians gather mineral specimens and gems. Dmitry Mamin-Sibiryak (1852–1912) Pavel Bazhov (1879–1950), as well as Aleksey Ivanov and Olga Slavnikova, post-Soviet writers, have written of the region.

The region served as a military stronghold during Peter the Great's Great Northern War with Sweden, during Stalin's rule when the Magnitogorsk Metallurgical Complex was built and Russian industry relocated to the Urals during the Nazi advance at the beginning of World War II, and as the center of the Soviet nuclear industry during the Cold War. Extreme levels of air, water, and radiological contamination and pollution by industrial wastes resulted. Population exodus resulted, and economic depression at the time of the collapse of the Soviet Union, but in post-Soviet times additional mineral exploration, particularly in the northern Urals, has been productive and the region has attracted industrial investment.

Pareto principle

From Wikipedia, the free encyclopedia
https://en.wikipedia.org/wiki/Pareto_principle
 
Pareto principle applied to community fundraising

The Pareto principle (also known as the 80/20 rule, the law of the vital few, or the principle of factor sparsity) states that, for many events, roughly 80% of the effects come from 20% of the causes. Management consultant Joseph M. Juran suggested the principle and named it after Italian economist Vilfredo Pareto, who noted the 80/20 connection while at the University of Lausanne in 1896, as published in his first work: Cours d'économie politique; in it, Pareto showed that approximately 80% of the land in Italy was owned by 20% of the population. 

It is an axiom of business management that "80% of sales come from 20% of clients".

Mathematically, the 80/20 rule is roughly followed by a power law distribution (also known as a Pareto distribution) for a particular set of parameters, and many natural phenomena have been shown empirically to exhibit such a distribution.

The Pareto principle is only tangentially related to Pareto efficiency. Pareto developed both concepts in the context of the distribution of income and wealth among the population.

In economics

The original observation was in connection with population and wealth. Pareto noticed that approximately 80% of Italy's land was owned by 20% of the population. He then carried out surveys on a variety of other countries and found to his surprise that a similar distribution applied.

A chart that gave the inequality a very visible and comprehensible form, the so-called "champagne glass" effect, was contained in the 1992 United Nations Development Program Report, which showed that distribution of global income is very uneven, with the richest 20% of the world's population controlling 82.7% of the world's income. Still, the Gini index of the world shows that nations have wealth distributions that vary greatly.


Distribution of world GDP, 1989
Quintile of population Income
Richest 20% 82.70%
Second 20% 11.75%
Third 20% 2.30%
Fourth 20% 1.85%
Poorest 20% 1.40%

The Pareto principle also could be seen as applying to taxation. In the US, the top 20% of earners have paid roughly 80-90% of Federal income taxes in 2000 and 2006, and again in 2018.

However, it is important to note that while there have been associations of such with meritocracy, the principle should not be confused with further reaching implications. As Alessandro Pluchino at the University of Catania in Italy points out, other attributes do not necessarily correlate. Using talent as an example, he and other researchers state, “The maximum success never coincides with the maximum talent, and vice-versa,” and that such factors are the result of chance.

In computing

In computer science the Pareto principle can be applied to optimization efforts. For example, Microsoft noted that by fixing the top 20% of the most-reported bugs, 80% of the related errors and crashes in a given system would be eliminated. Lowell Arthur expressed that "20 percent of the code has 80 percent of the errors. Find them, fix them!" It was also discovered that in general the 80% of a certain piece of software can be written in 20% of the total allocated time. Conversely, the hardest 20% of the code takes 80% of the time. This factor is usually a part of COCOMO estimating for software coding. 

In sports

It has been inferred the Pareto principle applies to athletic training, where roughly 20% of the exercises and habits have 80% of the impact and the trainee should not focus so much on a varied training. This does not necessarily mean that having a healthy diet or going to the gym are not important, but they are not as significant as the key activities. It is also important to note this 80/20 rule has yet to be scientifically tested in controlled studies of athletic training. 

In baseball, the Pareto principle has been perceived in Wins Above Replacement (an attempt to combine multiple statistics to determine a player's overall importance to a team). "15% of all the players last year produced 85% of the total wins with the other 85% of the players creating 15% of the wins. The Pareto principle holds up pretty soundly when it is applied to baseball."

Occupational health and safety

Occupational health and safety professionals use the Pareto principle to underline the importance of hazard prioritization. Assuming 20% of the hazards account for 80% of the injuries, and by categorizing hazards, safety professionals can target those 20% of the hazards that cause 80% of the injuries or accidents. Alternatively, if hazards are addressed in random order, a safety professional is more likely to fix one of the 80% of hazards that account only for some fraction of the remaining 20% of injuries.

Aside from ensuring efficient accident prevention practices, the Pareto principle also ensures hazards are addressed in an economical order, because the technique ensures the utilized resources are best used to prevent the most accidents.

Other applications

In engineering control theory, such as for electromechanical energy converters, the 80/20 principle applies to optimization efforts.

The law of the few can be also seen in betting, where it is said that with 20% effort you can match the accuracy of 80% of the bettors.

In the systems science discipline, Joshua M. Epstein and Robert Axtell created an agent-based simulation model called Sugarscape, from a decentralized modeling approach, based on individual behavior rules defined for each agent in the economy. Wealth distribution and Pareto's 80/20 principle became emergent in their results, which suggests the principle is a collective consequence of these individual rules.
The Pareto principle has many applications in quality control. It is the basis for the Pareto chart, one of the key tools used in total quality control and Six Sigma techniques. The Pareto principle serves as a baseline for ABC-analysis and XYZ-analysis, widely used in logistics and procurement for the purpose of optimizing stock of goods, as well as costs of keeping and replenishing that stock.

In health care in the United States, in one instance 20% of patients have been found to use 80% of health care resources.

Some cases of super-spreading conform to the 20/80 rule, where approximately 20% of infected individuals are responsible for 80% of transmissions, although super-spreading can still be said to occur when super-spreaders account for a higher or lower percentage of transmissions. In epidemics with super-spreading, the majority of individuals infect relatively few secondary contacts.

The Dunedin Study has found 80% of crimes are committed by 20% of criminals. This statistic has been used to support both stop-and-frisk policies and broken windows policing, as catching those criminals committing minor crimes will supposedly net many criminals wanted for (or who would normally commit) larger ones.

Many video rental shops reported in 1988 that 80% of revenue came from 20% of videotapes. A video-chain executive discussed the "Gone with the Wind syndrome", however, in which every store had to offer classics like Gone with the Wind, Casablanca, or The African Queen to appear to have a large inventory, even if customers very rarely rented them.

Mathematical notes

The idea has a rule of thumb application in many places, but it is commonly misused. For example, it is a misuse to state a solution to a problem "fits the 80/20 rule" just because it fits 80% of the cases; it must also be that the solution requires only 20% of the resources that would be needed to solve all cases. Additionally, it is a misuse of the 80/20 rule to interpret a small number of categories or observations. 

This is a special case of the wider phenomenon of Pareto distributions. If the Pareto index α, which is one of the parameters characterizing a Pareto distribution, is chosen as α = log45 ≈ 1.16, then one has 80% of effects coming from 20% of causes.

It follows that one also has 80% of that top 80% of effects coming from 20% of that top 20% of causes, and so on. Eighty percent of 80% is 64%; 20% of 20% is 4%, so this implies a "64/4" law; and similarly implies a "51.2/0.8" law. Similarly for the bottom 80% of causes and bottom 20% of effects, the bottom 80% of the bottom 80% only cause 20% of the remaining 20%. This is broadly in line with the world population/wealth table above, where the bottom 60% of the people own 5.5% of the wealth, approximating to a 64/4 connection. 

The 64/4 correlation also implies a 32% 'fair' area between the 4% and 64%, where the lower 80% of the top 20% (16%) and upper 20% of the bottom 80% (also 16%) relates to the corresponding lower top and upper bottom of effects (32%). This is also broadly in line with the world population table above, where the second 20% control 12% of the wealth, and the bottom of the top 20% (presumably) control 16% of the wealth.

The term 80/20 is only a shorthand for the general principle at work. In individual cases, the distribution could just as well be, say, nearer to 90/10 or 70/30. There is no need for the two numbers to add up to the number 100, as they are measures of different things, (e.g., 'number of customers' vs 'amount spent'). However, each case in which they do not add up to 100%, is equivalent to one in which they do. For example, as noted above, the "64/4 law" (in which the two numbers do not add up to 100%) is equivalent to the "80/20 law" (in which they do add up to 100%). Thus, specifying two percentages independently does not lead to a broader class of distributions than what one gets by specifying the larger one and letting the smaller one be its complement relative to 100%. Thus, there is only one degree of freedom in the choice of that parameter.

Adding up to 100 leads to a nice symmetry. For example, if 80% of effects come from the top 20% of sources, then the remaining 20% of effects come from the lower 80% of sources. This is called the "joint ratio", and can be used to measure the degree of imbalance: a joint ratio of 96:4 is very imbalanced, 80:20 is significantly imbalanced (Gini index: 76%), 70:30 is moderately imbalanced (Gini index: 28%), and 55:45 is just slightly imbalanced (Gini index 14%).

The Pareto principle is an illustration of a "power law" relationship, which also occurs in phenomena such as brush fires and earthquakes. Because it is self-similar over a wide range of magnitudes, it produces outcomes completely different from Normal or Gaussian distribution phenomena. This fact explains the frequent breakdowns of sophisticated financial instruments, which are modeled on the assumption that a Gaussian relationship is appropriate to something like stock price movements.

Equality measures


Gini coefficient and Hoover index

Using the "A : B" notation (for example, 0.8:0.2) and with A + B = 1, inequality measures like the Gini index (G) and the Hoover index (H) can be computed. In this case both are the same.

Tuesday, February 18, 2020

Only child

From Wikipedia, the free encyclopedia
https://en.wikipedia.org/wiki/Only_child
 
An only child is a person with no siblings, biological nor adopted.

Children who have half-siblings or step-siblings, either living at the same house or a different house - especially those who were born considerably later - may have a similar family environment to only children, as may children who have much younger siblings from both of the same parents (generally ten or more years).
 

Overview

Throughout history, only children were relatively uncommon. From around the middle of the 20th century, birth rates and average family sizes fell sharply, for a number of reasons including increasing costs of raising children and more women having their first child later in life. The proportion of families in the U.S. with only children increased during the Great Depression but fell during the Post–World War II baby boom. After the Korean War ended in 1953, the South Korean government suggested citizens each have one or two children to boost economic prosperity, which resulted in significantly lowered birth rates and a larger number of only children to the country.

From 1979 to 2015, the one-child policy in the People's Republic of China restricted most parents to having only one child, although it was subject to local relaxations and individual circumstances (for instance when twins were conceived).

Families may have an only child for a variety of reasons, including: personal preference, family planning, financial and emotional or physical health issues, desire to travel, stress in the family, educational advantages, late marriage, stability, focus, time constraints, fears over pregnancy, advanced age, illegitimate birth, infertility, divorce, and death of a sibling or parent. The premature death of one parent also contributed to a small percentage of marriages producing just one child until around the mid 20th century, not to mention the then rare occurrence of divorce. 

Only children are sometimes said to be more likely to develop precocious interests (from spending more time with adults) and to feel lonely. Sometimes they compensate for the aloneness by developing a stronger relationship with themselves or developing an active fantasy life that includes imaginary friends. Children whose only siblings are much older than them sometimes report feeling like an only child. Advantages cited of having an only child are the decreased financial burden, the absence of any sibling rivalry, and that it becomes possible to take the child to an event suitable for their age without having to bring along an uninterested sibling. A disadvantage is that it can be harder for an only child to singlehandedly look after their aging parents.

Stereotypes

In Western countries, only children can be the subject of a stereotype that equates them with "spoiled brats". G. Stanley Hall was one of the first commentators to give only children a bad reputation when he referred to their situation as "a disease in itself". Even today, only children are commonly stereotyped as "spoiled, selfish, and bratty". While many only children receive a lot of attention and resources for their development, it is not clear that as a class they are overindulged or differ significantly from children with siblings. Susan Newman, a social psychologist at Rutgers University and the author of Parenting an Only Child, says that this is a myth. "People articulate that only children are spoiled, they're aggressive, they're bossy, they're lonely, they're maladjusted", she said. "There have been hundreds and hundreds of research studies that show that only children are no different from their peers." However, differences have been found. Research involving teacher ratings of U.S. children's social and interpersonal skills has scored only children lower in self-control and interpersonal skills. While a later study failed to find evidence this continued through middle and high school, a further study showed that deficits persisted until at least the fifth grade.

In China, perceived behavioral problems in only children has been called the Little Emperor Syndrome and the lack of siblings has been blamed for a number of social ills such as materialism and crime. However, recent studies do not support these claims, and show no significant differences in personality between only children and children in larger families. The one child policy has also been speculated to be the underlying cause of forced abortions, female infanticide, underreporting of female births, and has been suggested as a possible cause behind China's increasing number of crimes and gender imbalance. Regardless, a 2008 survey given by the Pew Research Center reports that 76% of the Chinese population supports the policy.

The popular media often posit that it is more difficult for only children to cooperate in a conventional family environment, as they have no competitors for the attention of their parents and other relatives. It is suggested that confusion arises about the norms of ages and roles and that a similar effect exists in understanding during relationships with other peers and youth, all throughout life. Furthermore, it is suggested that many feel that their parents place extra pressure and expectations on the only child, and that often, only children are perfectionists. Only children are noted to have a tendency to mature faster.

Scientific research

A 1987 quantitative review of 141 studies on 16 different personality traits failed to support the opinion, held by theorists including Alfred Adler, that only children are more likely to be maladjusted due to pampering. The study found no evidence of any greater prevalence of maladjustment in only children. The only statistically significant difference discovered was that only children possessed a higher achievement motivation, which Denise Polit and Toni Falbo attributed to their greater share of parental resources, expectations, and scrutiny exposing them to a greater degree of reward, and greater likelihood of punishment for falling short. A second analysis by the authors revealed that only children, children with only one sibling, and first-borns in general, score higher on tests of verbal ability than later-borns and children with multiple siblings.

According to the Resource Dilution Model, parental resources (e.g. time to read to the child) are important in development. Because these resources are finite, children with many siblings are thought to receive fewer resources. However, the Confluence Model suggests there is an opposing effect from the benefits to the non-youngest children of tutoring younger siblings, though being tutored does not make up the reduced share of parental resources. This provides one explanation for the poorer performance on tests of ability of only children compared to first-borns, commonly seen in the literature, though explanations such as the increased and earlier likelihood of experiencing parental separation or loss for last-born and only children have also been suggested, as this may be the cause of their very status.

In his book Maybe One, the environmental campaigner Bill McKibben argues in favor of a voluntary one child policy on the grounds of climate change and overpopulation. He reassures the reader with a narrative constructed from interviews with researchers and writers on only children, combined with snippets from the research literature, that this would not be harmful to child development. He argues that most cultural stereotypes are false, that there are not many differences between only children and other children, and where there are differences, they are favorable to the only child.

Most research on only children has been quantitative and focused on the behaviour of only-children and on how others, for example teachers, assess that behaviour. Bernice Sorensen, in contrast, used qualitative methods in order to elicit meaning and to discover what only-children themselves understand, feel or sense about their lives that are lived without siblings. Her research showed that during their life span only children often become more aware of their only child status and are very much affected by society's stereotype of the only-child whether or not the stereotype is true or false. She argues in her book, Only Child Experience and Adulthood, that growing up in a predominantly sibling society affects only children and that their lack of sibling relationships can have an important effect on both the way they see themselves and others and how they interact with the world.

The latest research by Cameron et al. (2011) controls for endogeneity associated with being only children. Parents that choose to have only one child could differ systematically in their characteristics from parents who choose to have more than one child. The paper concludes that "those who grew up as only children as a consequence of the (one-child) policy (in China) are found to be less trusting, less trustworthy, less likely to take risks, and less competitive than if they had had siblings. They are also less optimistic, less conscientious, and more prone to neuroticism". Furthermore, according to Professor Cameron, it was found that "greater exposure to other children in childhood – for example, frequent interactions with cousins and/or attending childcare – was not a substitute for having siblings."

In his book Born to Rebel, Frank Sulloway provides evidence that birth order influences the development of the "big five personality traits" (also known as the Five Factor Model). Sulloway suggests that firstborns and only children are more conscientious, more socially dominant, less agreeable, and less open to new ideas compared to laterborns. However, his conclusions have been challenged by other researchers, who argue that birth order effects are weak and inconsistent. In one of the largest studies conducted on the effect of birth order on the Big Five, data from a national sample of 9,664 subjects found no association between birth order and scores on the NEO PI-R personality test.

Marriage gap

From Wikipedia, the free encyclopedia
https://en.wikipedia.org/wiki/Marriage_gap

The marriage gap describes observed economic and political disparities in the United States between those who are married and those who are single. The marriage gap can be compared to, but should not be confused with, the gender gap. As noted by Dr. W. Bradford Wilcox, American sociologist and director of the National Marriage Project at the University of Virginia, and Wendy Wang, director of research at the Institute for Family Studies, "College-educated and more affluent Americans enjoy relatively strong and stable marriages and the economic and social benefits that flow from such marriages. By contrast, not just poor but also working-class Americans face rising rates of family instability, single parenthood, and lifelong singleness."

Politics and marriage

As part of the marriage gap, unmarried people are "considerably more liberal" than married people.[1] With little variation between professed moderates, married people respond to be conservative 9 percent more, and single people respond to be liberal 10 percent more. Married people tend to hold political opinions that differ from those of people who have never married. 

Party affiliation in the United States

In the U.S., being a married woman is correlated with a higher level of support for the Republican Party, and being single with the Democratic Party. Marriage seems to have a moderate effect on party affiliation among single people. As of 2004, 32 percent of married people called themselves Republicans while 31 percent said they were Democrats. Among single people, 19 percent were Republicans and 38 percent Democrats. The difference is most striking between married and single women. Married women respond as being Republicans 15 percent more; single women respond as being Democrats 11 percent more.

Political issues

The marriage gap is evident on a range of political issues in the United States:
  • same-sex marriage, 11% more married people favour Constitutional amendments disallowing it
  • abortion, 14% more married people favour completely banning it
  • school vouchers, 3% more married people favour them

Marriage and cohabitation

It is not clear that legally or religiously formalized marriages are associated with better outcomes than long-term cohabitation. Part of the issue is that in many western countries, married couples will have cohabited before marrying so that the stability of the resulting marriage might be attributable to the cohabitation having worked.

A chief executive of an organisation that studies relationships are quoted for having said:
"Because we now have the acceptance of long-term cohabitation, people who go into marriage and stay in marriage are a more homogenous group. They are people who believe in certain things that contribute to stability. So the selection effect is really important. Yes, it's true that married couples on average stay together longer than cohabiting couples. But cohabitation is such an unhelpful word because it covers a whole ragbag of relationships, so it's not really comparable. We're better off talking about formal and informal marriages: those that have legal certificates, and those that don't. Is there any difference between a formal and informal marriage? If we really compare like with like, I'm not sure you'd see much difference." – Penny Mansfield

Interpreting the data

American marriage and family life are divided more today than it ever has been. "Less than half of poor Americans age 18 to 55 ( just 26 percent) and 39 percent of working-class Americans are currently married, compared to more than half (56 percent) of middle- and upper-class Americans." (cite) And when it comes to coupling, poor and working-class Americans are more likely to substitute cohabitation for marriage: poor Americans are almost three times more likely to cohabit (13%), and working-class Americans are twice as likely to cohabit (10%), compared with their middle- and upper-class peers age 18–55 (5%). These findings suggest that lower income and less-educated Americans are more likely to be living outside of a partnership. Specifically, about six in 10 poor Americans are single, about five in 10 working-class Americans are single, and about four in 10 middle- and upper-class Americans are single.

And when it comes to childbearing, working-class and especially poor women are more likely to have children than their middle- and upper-class peers and these children of poor women have a significantly higher chance of being born out of wedlock. Estimates derived from the 2013–15 National Survey of Family Growth indicate that poor women currently have about 2.4 children, compared with 1.8 children for working-class women and 1.7 children for middle- and upper-class women. According to the 2015 American Community Survey, 64 percent of children born to poor women are born out of wedlock, compared with 36 percent of children born to working-class women, and 13 percent of children born to middle- and upper-class children.

With respect to divorce, working-class and poor adults age 18-55 are more likely to divorce than are their middle- and upper-class counterparts. 46 percent of poor Americans aged 18–55 are divorced, compared with 41% of working-class adults and 30 percent of middle- and upper-class adults.

The marriage gap is susceptible to multiple interpretations because it is not clear to what extent it is attributable to causation and what to correlation. It may be that people who already have a number of positive indicators of future wellbeing in terms of wealth and education are more likely to get married. "The distinction between correlation and causation cuts to the heart of the debate about marriage. The evidence is unequivocal; children raised by married couples are healthier, do better at school, commit fewer crimes, go further in education, report higher levels of wellbeing. It is easy for politicians to deduce - and assert - that married couples, therefore, produce superior children. But the children do not necessarily do better because their parents are married and there is actually very little evidence that marriage alone, in the absence of anything else, benefits children." – Penny Mansfield

Why the marriage divide?

As noted by W. Bradford Wilcox and Wendy Wang,
A series of interlocking economic, policy, civic, and cultural changes since the 1960s in America combined to create a perfect family storm for poor and working-class Americans.12 On the economic front, the move to a postindustrial economy in the 1970s made it more difficult for poor and working-class men to find and hold stable, decent-paying jobs.13 See, for example, the increase in unemployment for less-educated but not college-educated men depicted in Figure 9.14 The losses that less-educated men have experienced since the 1970s in job stability and real income have rendered them less “marriageable,” that is, less attractive as husbands—and more vulnerable to divorce.
Wilcox and Wang continue, however, and contend that it is not only economics. Citing Cornell sociologist Daniel Lichter and colleagues, they note that "shifts in state-level employment trends and macroeconomic performance do not explain the majority of the decline of marriage in this period; indeed, the retreat from marriage continued in the 1990s even as the economy boomed across much of the country in this decade." In the words of Lichter in colleagues, "“Our results call into question the appropriateness of monocausal economic explanations of declining marriage." In fact, "The decline of marriage and rise of single parenthood in the late 1960s preceded the economic changes that undercut men’s wages and job stability in the 1970s."

There exist several possible reasons for the emergence of the Marriage Divide. First, as posited by W. Bradford Wilcox, Wendy Wang, and Nicholas Wolfinger, "because working-class and poor Americans have less of a social and economic stake in stable marriage, they depend more on cultural supports for marriage than do their middle- and upper-class peers."

Second, "Working-class and poor Americans have fewer cultural and educational resources to successfully navigate the increasingly deinstitutionalized character of dating, childbearing, and marriage. The legal scholar Amy Wax argues that the “moral deregulation” of matters related to sex, parenthood, marriage, and divorce proved more difficult for poor and working-class Americans to navigate than for more educated and affluent Americans because the latter group was and remains more likely to approach these matters with a disciplined, long-term perspective." "Today’s ethos of freedom and choice when it comes to dating, childbearing, and marriage is more difficult for working-class and poor Americans to navigate."

Third, "in recent years, middle- and upper-class Americans have rejected the most permissive dimensions of the counterculture for themselves and their children, even as poor and working-class Americans have adopted a more permissive orientation toward matters such as divorce and premarital sex. The end result has been that key norms, values, and virtues— from fidelity to attitudes about teen pregnancy—that sustain a strong marriage culture are now generally weaker in poor and working-class communities."

Metallicity

From Wikipedia, the free encyclopedia
https://en.wikipedia.org/wiki/Metallicity
 
The globular cluster M80. Stars in globular clusters are mainly older metal-poor members of Population II.

In astronomy, metallicity is the abundance of elements present in an object that are heavier than hydrogen or helium. Most of the physical matter in the Universe is in the form of hydrogen and helium, so astronomers use the word "metals" as a convenient short term for "all elements except hydrogen and helium". This usage is distinct from the usual physical definition of a solid metal. For example, stars and nebulae with relatively high abundances of carbon, nitrogen, oxygen, and neon are called "metal-rich" in astrophysical terms, even though those elements are non-metals in chemistry.

The presence of heavier elements hails from stellar nucleosynthesis, the theory that the majority of elements heavier than hydrogen and helium in the Universe ("metals", hereafter) are formed in the cores of stars as they evolve. Over time, stellar winds and supernovae deposit the metals into the surrounding environment, enriching the interstellar medium and providing recycling materials for the birth of new stars. It follows that older generations of stars, which formed in the metal-poor early Universe, generally have lower metallicities than those of younger generations, which formed in a more metal-rich Universe.

Observed changes in the chemical abundances of different types of stars, based on the spectral peculiarities that were later attributed to metallicity, led astronomer Walter Baade in 1944 to propose the existence of two different populations of stars. These became commonly known as Population I (metal-rich) and Population II (metal-poor) stars. A third stellar population was introduced in 1978, known as Population III stars. These extremely metal-poor stars were theorised to have been the "first-born" stars created in the Universe.

Common methods of calculation

Astronomers use several different methods to describe and approximate metal abundances, depending on the available tools and the object of interest. Some methods include determining the fraction of mass that is attributed to gas versus metals, or measuring the ratios of the number of atoms of two different elements as compared to the ratios found in the Sun

Mass fraction

Stellar composition is often simply defined by the parameters X, Y and Z. Here X is the mass fraction of hydrogen, Y is the mass fraction of helium, and Z is the mass fraction of all the remaining chemical elements. Thus
In most stars, nebulae, H II regions, and other astronomical sources, hydrogen and helium are the two dominant elements. The hydrogen mass fraction is generally expressed as , where is the total mass of the system, and is the fractional mass of the hydrogen it contains. Similarly, the helium mass fraction is denoted as . The remainder of the elements are collectively referred to as "metals", and the metallicity—the mass fraction of elements heavier than helium—can be calculated as
For the surface of the Sun, these parameters are measured to have the following values:

Description Solar value
Hydrogen mass fraction
Helium mass fraction
Metallicity

Due to the effects of stellar evolution, neither the initial composition nor the present day bulk composition of the Sun is the same as its present-day surface composition.

Chemical abundance ratios

The overall stellar metallicity is often defined using the total iron content of the star, as iron is among the easiest to measure with spectral observations in the visible spectrum (even though oxygen is the most abundant heavy element – see metallicities in HII regions below). The abundance ratio is defined as the logarithm of the ratio of a star's iron abundance compared to that of the Sun and is expressed thus:
where and are the number of iron and hydrogen atoms per unit of volume respectively. The unit often used for metallicity is the dex, contraction of "decimal exponent". By this formulation, stars with a higher metallicity than the Sun have a positive logarithmic value, whereas those with a lower metallicity than the Sun have a negative value. For example, stars with a [Fe/H] value of +1 have 10 times the metallicity of the Sun (101); conversely, those with a [Fe/H] value of −1 have 1/10, while those with a [Fe/H] value of 0 have the same metallicity as the Sun, and so on. Young Population I stars have significantly higher iron-to-hydrogen ratios than older Population II stars. Primordial Population III stars are estimated to have a metallicity of less than −6.0, that is, less than a millionth of the abundance of iron in the Sun.

The same notation is used to express variations in abundances between other the individual elements as compared to solar proportions. For example, the notation "[O/Fe]" represents the difference in the logarithm of the star's oxygen abundance versus its iron content compared to that of the Sun. In general, a given stellar nucleosynthetic process alters the proportions of only a few elements or isotopes, so a star or gas sample with nonzero [X/Fe] values may be showing the signature of particular nuclear processes.

Photometric colors

Astronomers can estimate metallicities through measured and calibrated systems that correlate photometric measurements and spectroscopic measurements. For example, the Johnson UVB filters can be used to detect an ultraviolet (UV) excess in stars, where a larger UV excess indicates a larger presence of metals that absorb the UV radiation, thereby making the star appear "redder". The UV excess, δ(U−B), is defined as the difference between a star's U and B band magnitudes, compared to the difference between U and B band magnitudes of metal-rich stars in the Hyades cluster. Unfortunately, δ(U−B) is sensitive to both metallicity and temperature: if two stars are equally metal-rich, but one is cooler than the other, they will likely have different δ(U−B) values. To help mitigate this degeneracy, a star's B−V color can be used as an indicator for temperature. Furthermore, the UV excess and B−V color can be corrected to relate the δ(U−B) value to iron abundances.

Other photometric systems that can be used to determine metallicities of certain astrophysical objects include the Strӧmgren system, the Geneva system, the Washington system, and the DDO system.

Metallicities in various astrophysical objects

Stars

At a given mass and age, a metal-poor star will be slightly warmer. Population II stars' metallicities are roughly 1/1000 to 1/10 of the Sun's ([Z/H] = −3.0 to −1.0), but the group appears cooler than Population I overall, as heavy Population II stars have long since died. Above 40 solar masses, metallicity influences how a star will die: outside the pair-instability window, lower metallicity stars will collapse directly to a black hole, while higher metallicity stars undergo a Type Ib/c supernova and may leave a neutron star.

Relationship between stellar metallicity and planets

A star's metallicity measurement is one parameter that helps determine whether a star has planets and the type of planets, as there is a direct correlation between metallicity and the type of planets a star may have. Measurements have demonstrated the connection between a star's metallicity and gas giant planets, like Jupiter and Saturn. The more metals in a star and thus its planetary system and proplyd, the more likely the system may have gas giant planets and rocky planets. Current models show that the metallicity along with the correct planetary system temperature and distance from the star are key to planet and planetesimal formation. For two stars that have equal age and mass but different metallicity, the less metallic star is bluer. Among stars of the same color, less metallic stars emit more ultraviolet radiation. The Sun, with 8 planets and 5 known dwarf planets, is used as the reference, with a [Fe/H] of 0.00.

HII regions

Young, massive and hot stars (typically of spectral types O and B) in H II regions emit UV photons that ionize ground-state hydrogen atoms, knocking electrons and protons free; this process is known as photoionization. The free electrons can strike other atoms nearby, exciting bound metallic electrons into a metastable state, which eventually decay back into a ground state, emitting photons with energies that correspond to forbidden lines. Through these transitions, astronomers have developed several observational methods to estimate metal abundances in HII regions, where the stronger the forbidden lines in spectroscopic observations, the higher the metallicity. These methods are dependent on one or more of the following: the variety of asymmetrical densities inside HII regions, the varied temperatures of the embedded stars, and/or the electron density within the ionized region.

Theoretically, to determine the total abundance of a single element in an HII region, all transition lines should be observed and summed. However, this can be observationally difficult due to variation in line strength. Some of the most common forbidden lines used to determine metal abundances in HII regions are from oxygen (e.g. [O II] λ = (3727, 7318, 7324) Å, and [O III] λ = (4363, 4959, 5007) Å), nitrogen (e.g. [NII] λ = (5755, 6548, 6584) Å), and sulfur (e.g. [SII] λ = (6717,6731) Å and [SIII] λ = (6312, 9069, 9531) Å) in the optical spectrum, and the [OIII] λ = (52, 88) μm and [NIII] λ = 57 μm lines in the infrared spectrum. Oxygen has some of the stronger, more abundant lines in HII regions, making it a main target for metallicity estimates within these objects. To calculate metal abundances in HII regions using oxygen flux measurements, astronomers often use the R23 method, in which
where is the sum of the fluxes from oxygen emission lines measured at the rest frame λ = (3727, 4959 and 5007) Å wavelengths, divided by the flux from the Hβ emission line at the rest frame λ = 4861 Å wavelength. This ratio is well defined through models and observational studies, but caution should be taken, as the ratio is often degenerate, providing both a low and high metallicity solution, which can be broken with additional line measurements. Similarly, other strong forbidden line ratios can be used, e.g. for sulfur, where
Metal abundances within HII regions are typically less than 1%, with the percentage decreasing on average with distance from the Galactic Center.

Impact of the COVID-19 pandemic on the environment

From Wikipedia, the free encyclopedia https://en.wikipedia.org/wiki/Impact_of_the_COVID-19_pandemic_on_the_envi...