A fishery is an area with an associated fish or aquatic population which is harvested for its commercial value. Fisheries can be marine (saltwater) or freshwater. They can also be wild or farmed.
Wild fisheries are sometimes called capture fisheries. The aquatic life they support is not controlled in any meaningful way and needs to be "captured" or fished. Wild fisheries exist primarily in the oceans, and particularly around coasts and continental shelves. They also exist in lakes and rivers. Issues with wild fisheries are overfishing and pollution. Significant wild fisheries have collapsed or are in danger of collapsing, due to overfishing and pollution. Overall, production from the world's wild fisheries has levelled out, and may be starting to decline.
As a contrast to wild fisheries, farmed fisheries can operate in sheltered coastal waters, in rivers, lakes and ponds, or in enclosed bodies of water such as tanks. Farmed fisheries are technological in nature, and revolve around developments in aquaculture. Farmed fisheries are expanding, and Chinese aquaculture in particular is making many advances. Nevertheless, the majority of fish consumed by humans continues to be sourced from wild fisheries. As of the early 21st century, fish is humanity's only significant wild food source.
Marine and inland production
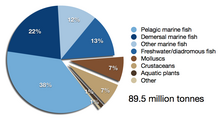
Global wild fish capture in million tonnes, 2010, as reported by the FAO
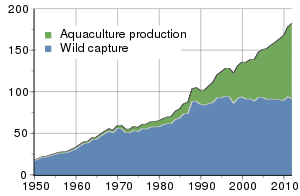
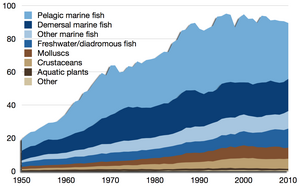
Global wild fish capture in million tonnes, 1950–2010, as reported by the FAO
According to the Food and Agriculture Organization (FAO), the world harvest by commercial fisheries in 2010 consisted of 88.6 million tonnes of aquatic animals captured in wild fisheries, plus another 0.9 million tons of aquatic plants (seaweed etc.). This can be contrasted with 59.9 million tonnes produced in fish farms, plus another 19.0 million tons of aquatic plants harvested in aquaculture.
Marine fisheries
Topography
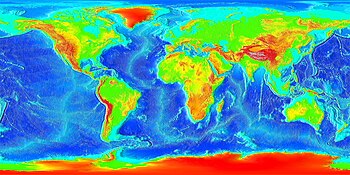
Map of underwater topography. (1995, NOAA)
The productivity of marine fisheries is largely determined by marine topography, including its interaction with ocean currents and the diminishment of sunlight with depth.
Fishing activities extracted from Automatic Identification Data of EU trawlers over the continental shelf,[2] highlighting the correlation with the bathymetry over the area (bottom-left, from the GEBCO world map 2014).
Marine topography is defined by various coastal and oceanic landforms, ranging from coastal estuaries and shorelines; to continental shelves and coral reefs; to underwater and deep sea features such as ocean rises and seamounts. |
Ocean currents
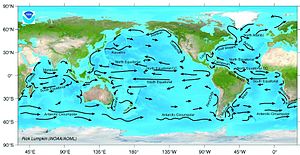
Major ocean surface currents. NOAA map.
An ocean current is continuous, directed movement of ocean water. Ocean currents are rivers of relatively warm or cold water within the ocean. The currents are generated from the forces acting upon the water like the planet rotation, the wind, the temperature and salinity (hence isopycnal) differences and the gravitation of the moon. The depth contours, the shoreline and other currents influence the current's direction and strength. |
| More on currents |
|---|
Gyres and upwelling
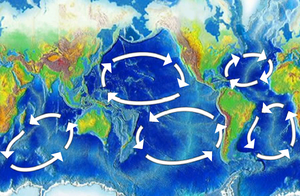
Map of Ocean Gyres
| Prominent gyres |
|---|
Biomass
Estimate of biomass produced by photosynthesis from September 1997 to August 2000. This is a rough indicator of the primary production potential in the oceans. Provided by the SeaWiFS Project, NASA/Goddard Space Flight Center and ORBIMAGE.
|
| Primary biomass |
|---|
Habitats
| Aquatic habitats have been classified into marine and freshwater ecoregions by the Worldwide Fund for Nature (WWF). An ecoregion is defined as a "relatively large unit of land or water containing a characteristic set of natural communities that share a large majority of their species, dynamics, and environmental conditions (Dinerstein et al. 1995, TNC 1997). |
Coastal waters
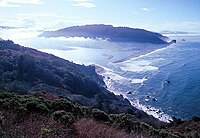
Estuary of Klamath River
- Estuaries are semi-enclosed coastal bodies of water with one or more rivers or streams flowing into them, and with a free connection to the open sea. Estuaries are often associated with high rates of biological productivity. They are small, in demand, impacted by events far upstream or out at sea, and concentrate materials such as pollutants and sediments.
- Lagoons are bodies of comparatively shallow salt or brackish water separated from the deeper sea by a shallow or exposed sandbank, coral reef, or similar feature. Lagoon refers to both coastal lagoons formed by the build-up of sandbanks or reefs along shallow coastal waters, and the lagoons in atolls, formed by the growth of coral reefs on slowly sinking central islands. Lagoons that are fed by freshwater streams are estuaries.
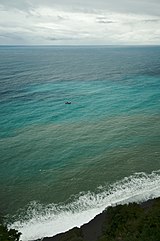
- The intertidal zone (foreshore) is the area that is exposed to the air at low tide and submerged at high tide, for example, the area between tide marks. This area can include many different types of habitats, including steep rocky cliffs, sandy beaches or vast mudflats. The area can be a narrow strip, as in Pacific islands that have only a narrow tidal range, or can include many meters of shoreline where shallow beach slope interacts with high tidal excursion.
Fixed-net fishing on the littoral zone along the Suhua Highway on the East coast of Taiwan
|
Continental shelves
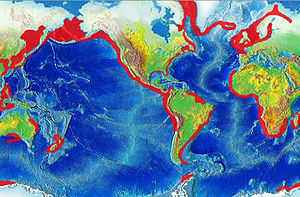
The global continental shelf, highlighted in cyan
Continental shelves are the extended perimeters of each continent and associated coastal plain, which is covered during interglacial periods such as the current epoch by relatively shallow seas (known as shelf seas) and gulfs. The shelf usually ends at a point of decreasing slope (called the shelf break). The sea floor below the break is the continental slope. Below the slope is the continental rise, which finally merges into the deep ocean floor, the abyssal plain. The continental shelf and the slope are part of the continental margin. Continental shelves are shallow (averaging 140 metres or 460 feet), and the sunlight available means they can teem with life. The shallowest parts of the continental shelf are called fishing banks. There the sunlight penetrates to the seafloor and the plankton, on which fish feed, thrive. |
Coral reefs
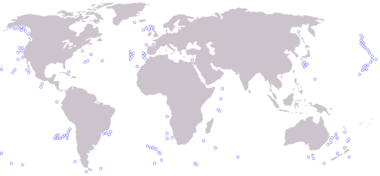
Locations of coral reefs.
Coral reefs are aragonite structures produced by living organisms, found in shallow, tropical marine waters with little to no nutrients in the water. High nutrient levels such as those found in runoff from agricultural areas can harm the reef by encouraging the growth of algae. Although corals are found both in temperate and tropical waters, reefs are formed only in a zone extending at most from 30°N to 30°S of the equator. |
Open sea
| In the deep ocean, much of the ocean floor is a flat, featureless underwater desert called the abyssal plain. Many pelagic fish migrate
across these plains in search of spawning or different feeding grounds.
Smaller migratory fish are followed by larger predator fish and can
provide rich, if temporary, fishing grounds.
|
Seamounts
The locations of the world's major seamounts
A seamount is an underwater mountain, rising from the seafloor that does not reach to the water's surface (sea level), and thus is not an island. They are defined by oceanographers as independent features that rise to at least 1,000 meters above the seafloor. Seamounts are common in the Pacific Ocean. Recent studies suggest there may be 30,000 seamounts in the Pacific, about 1,000 in the Atlantic Ocean and an unknown number in the Indian Ocean. |
Maritime species
Freshwater fisheries
Lakes
Worldwide, freshwater lakes have an area of 1.5 million square kilometres. Saline inland seas add another 1.0 million square kilometres.
There are 28 freshwater lakes with an area greater than 5,000 square
kilometres, totalling 1.18 million square kilometres or 79 percent of
the total.
Rivers
Pollution
Pollution
is the introduction of contaminants into an environment. Wild fisheries
flourish in oceans, lakes, and rivers, and the introduction of
contaminants is an issue of concern, especially as regards plastics,
pesticides, heavy metals, and other industrial and agricultural
pollutants which do not disintegrate rapidly in the environment. Land
run-off and industrial, agricultural, and domestic waste enter rivers
and are discharged into the sea. Pollution from ships is also a problem.
Plastic waste
Marine debris
is human-created waste that ends up floating in the sea. Oceanic debris
tends to accumulate at the centre of gyres and coastlines, frequently
washing aground where it is known as beach litter. Eighty percent of all
known marine debris is plastic - a component that has been rapidly
accumulating since the end of World War II. Plastics accumulate because they don't biodegrade as many other substances do; while they will photodegrade on exposure to the sun, they do so only under dry conditions, as water inhibits this process.
Discarded plastic bags, six pack rings and other forms of plastic waste which finish up in the ocean present dangers to wildlife and fisheries. Aquatic life can be threatened through entanglement, suffocation, and ingestion.
Nurdles,
also known as mermaids' tears, are plastic pellets typically under five
millimetres in diameter, and are a major contributor to marine debris.
They are used as a raw material in plastics manufacturing, and are
thought to enter the natural environment after accidental spillages. Nurdles are also created through the physical weathering of larger plastic debris. They strongly resemble fish eggs, only instead of finding a nutritious meal, any marine wildlife that ingests them will likely starve, be poisoned and die.
Many animals that live on or in the sea consume flotsam by mistake, as it often looks similar to their natural prey.
Plastic debris, when bulky or tangled, is difficult to pass, and may
become permanently lodged in the digestive tracts of these animals,
blocking the passage of food and causing death through starvation or
infection. Tiny floating particles also resemble zooplankton, which can lead filter feeders to consume them and cause them to enter the ocean food chain. In samples taken from the North Pacific Gyre in 1999 by the Algalita Marine Research Foundation, the mass of plastic exceeded that of zooplankton by a factor of six.
More recently, reports have surfaced that there may now be 30 times
more plastic than plankton, the most abundant form of life in the ocean.
Toxic additives used in the manufacture of plastic materials can leech out into their surroundings when exposed to water. Waterborne hydrophobic pollutants collect and magnify on the surface of plastic debris, thus making plastic far more deadly in the ocean than it would be on land.[46] Hydrophobic contaminants are also known to bioaccumulate in fatty tissues, biomagnifying up the food chain and putting great pressure on apex predators. Some plastic additives are known to disrupt the endocrine system when consumed, others can suppress the immune system or decrease reproductive rates.
Toxins
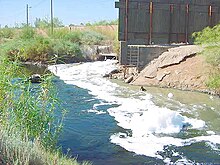
Septic river.
Polluted lagoon.
Apart from plastics, there are particular problems with other toxins
which do not disintegrate rapidly in the marine environment. Heavy
metals are metallic chemical elements that have a relatively high
density and are toxic or poisonous at low concentrations. Examples are mercury, lead, nickel, arsenic and cadmium. Other persistent toxins are PCBs, DDT, pesticides, furans, dioxins and phenols.
Such toxins can accumulate in the tissues of many species of aquatic life in a process called bioaccumulation. They are also known to accumulate in benthic environments, such as estuaries and bay muds: a geological record of human activities of the last century.
Some specific examples are
- Chinese and Russian industrial pollution such as phenols and heavy metals in the Amur River have devastated fish stocks and damaged its estuary soil.
- Wabamun Lake in Alberta, Canada, once the best whitefish lake in the area, now has unacceptable levels of heavy metals in its sediment and fish.
- Acute and chronic pollution events have been shown to impact southern California kelp forests, though the intensity of the impact seems to depend on both the nature of the contaminants and duration of exposure.
- Due to their high position in the food chain and the subsequent accumulation of heavy metals from their diet, mercury levels can be high in larger species such as bluefin and albacore. As a result, in March 2004 the United States FDA issued guidelines recommending that pregnant women, nursing mothers and children limit their intake of tuna and other types of predatory fish.
- Some shellfish and crabs can survive polluted environments, accumulating heavy metals or toxins in their tissues. For example, mitten crabs have a remarkable ability to survive in highly modified aquatic habitats, including polluted waters. The farming and harvesting of such species needs careful management if they are to be used as a food.
- Mining has a poor environmental track record. For example, according to the United States Environmental Protection Agency, mining has contaminated portions of the headwaters of over 40% of watersheds in the western continental US. Much of this pollution finishes up in the sea.
- Heavy metals enter the environment through oil spills - such as the Prestige oil spill on the Galician coast - or from other natural or anthropogenic sources.
Eutrophication
Effect of eutrophication on marine benthic life
Eutrophication is an increase in chemical nutrients, typically compounds containing nitrogen or phosphorus, in an ecosystem. It can result in an increase in the ecosystem's primary productivity
(excessive plant growth and decay), and further effects including lack
of oxygen and severe reductions in water quality, fish, and other animal
populations.
The biggest culprit are rivers that empty into the ocean, and with it the many chemicals used as fertilizers in agriculture as well as waste from livestock and humans. An excess of oxygen depleting chemicals in the water can lead to hypoxia and the creation of a dead zone.
Surveys have shown that 54% of lakes in Asia are eutrophic; in Europe, 53%; in North America, 48%; in South America, 41%; and in Africa, 28%. Estuaries
also tend to be naturally eutrophic because land-derived nutrients are
concentrated where run-off enters the marine environment in a confined
channel. The World Resources Institute
has identified 375 hypoxic coastal zones around the world, concentrated
in coastal areas in Western Europe, the Eastern and Southern coasts of
the US, and East Asia, particularly in Japan. In the ocean, there are frequent red tide algae blooms
that kill fish and marine mammals and cause respiratory problems in
humans and some domestic animals when the blooms reach close to shore.
In addition to land runoff, atmospheric anthropogenic fixed nitrogen
can enter the open ocean. A study in 2008 found that this could account
for around one third of the ocean's external (non-recycled) nitrogen
supply and up to three per cent of the annual new marine biological
production.
It has been suggested that accumulating reactive nitrogen in the
environment may have consequences as serious as putting carbon dioxide
in the atmosphere.
Acidification
The oceans are normally a natural carbon sink,
absorbing carbon dioxide from the atmosphere. Because the levels of
atmospheric carbon dioxide are increasing, the oceans are becoming more acidic.
The potential consequences of ocean acidification are not fully
understood, but there are concerns that structures made of calcium
carbonate may become vulnerable to dissolution, affecting corals and the
ability of shellfish to form shells.
A report from NOAA
scientists published in the journal Science in May 2008 found that
large amounts of relatively acidified water are upwelling to within four
miles of the Pacific continental shelf
area of North America. This area is a critical zone where most local
marine life lives or is born. While the paper dealt only with areas from
Vancouver to northern California, other continental shelf areas may be experiencing similar effects.
Effects of fishing
Habitat destruction
Fishing nets that have been left or lost in the ocean by fishermen are called ghost nets, and can entangle fish, dolphins, sea turtles, sharks, dugongs, crocodiles, seabirds, crabs,
and other creatures. Acting as designed, these nets restrict movement,
causing starvation, laceration and infection, and—in those that need to
return to the surface to breathe—suffocation.
Overfishing
Some specific examples of overfishing.
- On the east coast of the United States, the availability of bay scallops has been greatly diminished by the overfishing of sharks in the area. A variety of sharks have, until recently, fed on rays, which are a main predator of bay scallops. With the shark population reduced, in some places almost totally, the rays have been free to dine on scallops to the point of greatly decreasing their numbers.
- Chesapeake Bay's once-flourishing oyster populations historically filtered the estuary's entire water volume of excess nutrients every three or four days. Today that process takes almost a year, and sediment, nutrients, and algae can cause problems in local waters. Oysters filter these pollutants, and either eat them or shape them into small packets that are deposited on the bottom where they are harmless.
- The Australian government alleged in 2006 that Japan illegally overfished southern bluefin tuna by taking 12,000 to 20,000 tonnes per year instead of their agreed 6,000 tonnes; the value of such overfishing would be as much as US$2 billion. Such overfishing has resulted in severe damage to stocks. "Japan's huge appetite for tuna will take the most sought-after stocks to the brink of commercial extinction unless fisheries agree on more rigid quotas" stated the WWF. Japan disputes this figure, but acknowledges that some overfishing has occurred in the past.
- Jackson, Jeremy B C et al. (2001) Historical overfishing and the recent collapse of coastal ecosystems Science 293:629-638.
Loss of biodiversity
Each species in an ecosystem
is affected by the other species in that ecosystem. There are very few
single prey-single predator relationships. Most prey are consumed by
more than one predator, and most predators have more than one prey.
Their relationships are also influenced by other environmental factors.
In most cases, if one species is removed from an ecosystem, other
species will most likely be affected, up to the point of extinction.
Species biodiversity
is a major contributor to the stability of ecosystems. When an
organism exploits a wide range of resources, a decrease in biodiversity
is less likely to have an impact. However, for an organism which exploit
only limited resources, a decrease in biodiversity is more likely to
have a strong effect.
Reduction of habitat, hunting and fishing of some species to extinction or near extinction, and pollution tend to tip the balance of biodiversity. For a systematic treatment of biodiversity within a trophic level, see unified neutral theory of biodiversity.
Threatened species
The global standard for recording threatened marine species is the IUCN Red List of Threatened Species.
This list is the foundation for marine conservation priorities
worldwide. A species is listed in the threatened category if it is
considered to be critically endangered, endangered, or vulnerable. Other categories are near threatened and data deficient.
Marine
Many marine species are under increasing risk of extinction and marine biodiversity is undergoing potentially irreversible loss due to threats such as overfishing, bycatch, climate change, invasive species and coastal development.
By 2008, the IUCN
had assessed about 3,000 marine species. This includes assessments of
known species of shark, ray, chimaera, reef-building coral, grouper,
marine turtle, seabird, and marine mammal. Almost one-quarter (22%) of
these groups have been listed as threatened.
| Group | Species | Threatened | Near threatened | Data deficient |
|---|---|---|---|---|
| Sharks, rays, and chimaeras | 17% | 13% | 47% | |
| Groupers | 12% | 14% | 30% | |
| Reef-building corals | 845 | 27% | 20% | 17% |
| Marine mammals | 25% | |||
| Seabirds | 27% | |||
| Marine turtles | 7 | 86% |
- Sharks, rays, and chimaeras: are deep water pelagic species, which makes them difficult to study in the wild. Not a lot is known about their ecology and population status. Much of what is currently known is from their capture in nets from both targeted and accidental catch. Many of these slow growing species are not recovering from overfishing by shark fisheries around the world.
- Groupers: Major threats are overfishing, particularly the uncontrolled fishing of small juveniles and spawning adults.
- Coral reefs: The primary threats to corals are bleaching and disease which has been linked to an increase in sea temperatures. Other threats include coastal development, coral extraction, sedimentation and pollution. The coral triangle (Indo-Malay-Philippine archipelago) region has the highest number of reef-building coral species in threatened category as well as the highest coral species diversity. The loss of coral reef ecosystems will have devastating effects on many marine species, as well as on people that depend on reef resources for their livelihoods.
- Marine mammals: include whales, dolphins, porpoises, seals, sea lions, walruses, sea otter, marine otter, manatees, dugong and the polar bear. Major threats include entanglement in ghost nets, targeted harvesting, noise pollution from military and seismic sonar, and boat strikes. Other threats are water pollution, habitat loss from coastal development, loss of food sources due to the collapse of fisheries, and climate change.
- Seabirds: Major threats include longline fisheries and gillnets, oil spills, and predation by rodents and cats in their breeding grounds. Other threats are habitat loss and degradation from coastal development, logging and pollution.
- Marine turtles: Marine turtles lay their eggs on beaches, and are subject to threats such as coastal development, sand mining, and predators, including humans who collect their eggs for food in many parts of the world. At sea, marine turtles can be targeted by small scale subsistence fisheries, or become bycatch during longline and trawling activities, or become entangled in ghost nets or struck by boats.
An ambitious project, called the Global Marine Species Assessment, is
under way to make IUCN Red List assessments for another 17,000 marine
species by 2012. Groups targeted include the approximately 15,000 known
marine fishes, and important habitat-forming primary producers such mangroves, seagrasses, certain seaweeds and the remaining corals; and important invertebrate groups including molluscs and
echinoderms.
Freshwater
Freshwater
fisheries have a disproportionately high diversity of species compared
to other ecosystems. Although freshwater habitats cover less than 1% of
the world's surface, they provide a home for over 25% of known
vertebrates, more than 126,000 known animal species, about 24,800
species of freshwater fish, molluscs, crabs and dragonflies, and about 2,600 macrophytes.
Continuing industrial and agricultural developments place huge strain on
these freshwater systems. Waters are polluted or extracted at high
levels, wetlands are drained, rivers channelled, forests deforestated
leading to sedimentation, invasive species are introduced, and
over-harvesting occurs.
In the 2008 IUCN
Red List, about 6,000 or 22% of the known freshwater species have been
assessed at a global scale, leaving about 21,000 species still to be
assessed. This makes clear that, worldwide, freshwater species are
highly threatened, possibly more so than species in marine fisheries. However, a significant proportion of freshwater species are listed as data deficient, and more field surveys are needed.
Fisheries management
A recent paper published by the National Academy of Sciences of the USA warns that: "Synergistic effects of habitat destruction,
overfishing, introduced species, warming, acidification, toxins, and
massive runoff of nutrients are transforming once complex ecosystems
like coral reefs and kelp forests into monotonous level bottoms,
transforming clear and productive coastal seas into anoxic dead zones,
and transforming complex food webs topped by big animals into
simplified, microbially dominated ecosystems with boom and bust cycles
of toxic dinoflagellate blooms, jellyfish, and disease".
