| Energy development | |||||||||||||||||||||||||

World total primary energy production

US Energy Use/Flow in 2011

Energy flow charts show the relative size
of primary energy resources and end uses in the United States, with
fuels compared on a common energy unit basis (2011: 97.3 quads).
| |||||||||||||||||||||||||
Societies use energy for transportation, manufacturing, illumination, heating and air conditioning, and communication, for industrial, commercial, and domestic purposes. Energy resources may be classified as primary resources, where the resource can be used in substantially its original form, or as secondary resources, where the energy source must be converted into a more conveniently usable form. Non-renewable resources are significantly depleted by human use, whereas renewable resources are produced by ongoing processes that can sustain indefinite human exploitation.
Thousands of people are employed in the energy industry. The conventional industry comprises the petroleum industry, the natural gas industry, the electrical power industry, and the nuclear industry. New energy industries include the renewable energy industry, comprising alternative and sustainable manufacture, distribution, and sale of alternative fuels.
Classification of resources

Open System Model (basics)
Energy resources may be classified as primary resources, suitable for
end use without conversion to another form, or secondary resources,
where the usable form of energy required substantial conversion from a
primary source. Examples of primary energy resources are wind power, solar power, wood fuel, fossil fuels such as coal, oil and natural gas, and uranium. Secondary resources are those such as electricity, hydrogen, or other synthetic fuels.
Another important classification is based on the time required to
regenerate an energy resource. "Renewable" resources are those that
recover their capacity in a time significant by human needs. Examples
are hydroelectric power or wind power, when the natural phenomena that
are the primary source of energy are ongoing and not depleted by human
demands. Non-renewable resources are those that are significantly
depleted by human usage and that will not recover their potential
significantly during human lifetimes. An example of a non-renewable
energy source is coal, which does not form naturally at a rate that
would support human use.
Fossil fuels

The Moss Landing Power Plant in California is a fossil-fuel power station that burns natural gas in a turbine to produce electricity
Fossil fuel (primary non-renewable fossil) sources burn coal or hydrocarbon fuels, which are the remains of the decomposition of plants and animals. There are three main types of fossil fuels: coal, petroleum, and natural gas. Another fossil fuel, liquefied petroleum gas
(LPG), is principally derived from the production of natural gas. Heat
from burning fossil fuel is used either directly for space heating and
process heating, or converted to mechanical energy for vehicles, industrial processes, or electrical power generation. These fossil fuels are part of the carbon cycle and thus allow stored solar energy to be used today.
The use of fossil fuels in the 18th and 19th Century set the stage for the Industrial Revolution.
Fossil fuels make up the bulk of the world's current primary energy sources. In 2005, 81% of the world's energy needs was met from fossil sources.
The technology and infrastructure already exist for the use of fossil
fuels. Liquid fuels derived from petroleum deliver a great deal of
usable energy per unit of weight or volume, which is advantageous when
compared with lower energy density sources such as a battery. Fossil fuels are currently economical for decentralised energy use.

Energy dependence on imported fossil fuels creates energy security risks for dependent countries. Oil dependence in particular has led to war, funding of radicals, monopolization, and socio-political instability.
Fossil fuels are non-renewable resources, which will eventually decline in production and become exhausted. While the processes that created fossil fuels
are ongoing, fuels are consumed far more quickly than the natural rate
of replenishment. Extracting fuels becomes increasingly costly as
society consumes the most accessible fuel deposits. Extraction of fossil fuels results in environmental degradation, such as the strip mining and mountaintop removal of coal.
Fuel efficiency is a form of thermal efficiency, meaning the efficiency of a process that converts chemical potential energy contained in a carrier fuel into kinetic energy or work. The fuel economy is the energy efficiency of a particular vehicle, is given as a ratio of distance travelled per unit of fuel consumed. Weight-specific efficiency (efficiency per unit weight) may be stated for freight, and passenger-specific efficiency (vehicle efficiency per passenger). The inefficient atmospheric combustion (burning) of fossil fuels in vehicles, buildings, and power plants contributes to urban heat islands.
Conventional production of oil has peaked,
conservatively, between 2007 and 2010. In 2010, it was estimated that
an investment in non-renewable resources of $8 trillion would be
required to maintain current levels of production for 25 years. In 2010, governments subsidized fossil fuels by an estimated $500 billion a year. Fossil fuels are also a source of greenhouse gas emissions, leading to concerns about global warming if consumption is not reduced.
The combustion of fossil fuels leads to the release of pollution into the atmosphere. The fossil fuels are mainly carbon compounds. During combustion, carbon dioxide is released, and also nitrogen oxides, soot and other fine particulates. Man-made carbon dioxide according to the IPCC contributes to global warming.
Other emissions from fossil fuel power station include sulfur dioxide, carbon monoxide (CO), hydrocarbons, volatile organic compounds (VOC), mercury, arsenic, lead, cadmium, and other heavy metals including traces of uranium.
A typical coal plant generates billions of kilowatt hours per year.
Nuclear
Fission
,_USS_Long_Beach_(CGN-9)_and_USS_Bainbridge_(DLGN-25)_underway_in_the_Mediterranean_Sea_during_Operation_Sea_Orbit,_in_1964.jpg)
American nuclear powered ships,(top to bottom) cruisers USS Bainbridge, the USS Long Beach and the USS Enterprise, the longest ever naval vessel, and the first nuclear-powered aircraft carrier.
Picture taken in 1964 during a record setting voyage of 26,540 nmi
(49,190 km) around the world in 65 days without refueling. Crew members
are spelling out Einstein's mass-energy equivalence formula E = mc2 on the flight deck.

The Russian nuclear-powered icebreaker NS Yamal on a joint scientific expedition with the NSF in 1994
Nuclear power is the use of nuclear fission to generate useful heat and electricity. Fission of uranium produces nearly all economically significant nuclear power. Radioisotope thermoelectric generators form a very small component of energy generation, mostly in specialized applications such as deep space vehicles.
Nuclear power plants, excluding naval reactors, provided about 5.7% of the world's energy and 13% of the world's electricity in 2012.
In 2013, the IAEA report that there are 437 operational nuclear power reactors, in 31 countries, although not every reactor is producing electricity. In addition, there are approximately 140 naval vessels using nuclear propulsion in operation, powered by some 180 reactors. As of 2013, attaining a net energy gain from sustained nuclear fusion reactions, excluding natural fusion power sources such as the Sun, remains an ongoing area of international physics and engineering research. More than 60 years after the first attempts, commercial fusion power production remains unlikely before 2050.
There is an ongoing debate about nuclear power. Proponents, such as the World Nuclear Association, the IAEA and Environmentalists for Nuclear Energy contend that nuclear power is a safe, sustainable energy source that reduces carbon emissions. Opponents contend that nuclear power poses many threats to people and the environment.
Nuclear power plant accidents include the Chernobyl disaster (1986), Fukushima Daiichi nuclear disaster (2011), and the Three Mile Island accident (1979). There have also been some nuclear submarine accidents.
In terms of lives lost per unit of energy generated, analysis has
determined that nuclear power has caused less fatalities per unit of
energy generated than the other major sources of energy generation.
Energy production from coal, petroleum, natural gas and hydropower has caused a greater number of fatalities per unit of energy generated due to air pollution and energy accident effects.
However, the economic costs of nuclear power accidents is high, and
meltdowns can take decades to clean up. The human costs of evacuations
of affected populations and lost livelihoods is also significant.
Comparing Nuclear's latent cancer deaths, such as cancer with other energy sources immediate
deaths per unit of energy generated(GWeyr). This study does not include
fossil fuel related cancer and other indirect deaths created by the use
of fossil fuel consumption in its "severe accident" classification,
which would be an accident with more than 5 fatalities.
Nuclear power is a low carbon power generation method of producing electricity, with an analysis of the literature on its total life cycle emission intensity finding that it is similar to renewable sources in a comparison of greenhouse gas(GHG) emissions per unit of energy generated. Since the 1970s, nuclear fuel has displaced about 64 gigatonnes of carbon dioxide equivalent(GtCO2-eq) greenhouse gases, that would have otherwise resulted from the burning of oil, coal or natural gas in fossil-fuel power stations.
As of 2012, according to the IAEA, worldwide there were 68 civil nuclear power reactors under construction in 15 countries, approximately 28 of which in the People's Republic of China (PRC), with the most recent nuclear power reactor, as of May 2013, to be connected to the electrical grid, occurring on February 17, 2013 in Hongyanhe Nuclear Power Plant in the PRC. In the United States, two new Generation III reactors are under construction at Vogtle. U.S. nuclear industry officials expect five new reactors to enter service by 2020, all at existing plants. In 2013, four aging, uncompetitive, reactors were permanently closed.
Japan's 2011 Fukushima Daiichi nuclear accident, which occurred in a reactor design from the 1960s, prompted a rethink of nuclear safety and nuclear energy policy in many countries. Germany decided to close all its reactors by 2022, and Italy has banned nuclear power. Following Fukushima, in 2011 the International Energy Agency halved its estimate of additional nuclear generating capacity to be built by 2035.
Recent experiments in extraction of uranium use polymer ropes
that are coated with a substance that selectively absorbs uranium from
seawater. This process could make the considerable volume of uranium
dissolved in seawater exploitable for energy production. Since ongoing
geologic processes carry uranium to the sea in amounts comparable to the
amount that would be extracted by this process, in a sense the
sea-borne uranium becomes a sustainable resource.
Fission economics
.png)
Low global public support for nuclear fission in the aftermath of Fukushima (Ipsos-survey, 2011)
The economics of new nuclear power plants is a controversial subject,
since there are diverging views on this topic, and multibillion-dollar
investments ride on the choice of an energy source. Nuclear power plants
typically have high capital costs for building the plant, but low
direct fuel costs. In recent years there has been a slowdown of
electricity demand growth and financing has become more difficult, which
affects large projects such as nuclear reactors, with very large
upfront costs and long project cycles which carry a large variety of
risks.
In Eastern Europe, a number of long-established projects are struggling
to find finance, notably Belene in Bulgaria and the additional reactors
at Cernavoda in Romania, and some potential backers have pulled out. Where cheap gas is available and its future supply relatively secure, this also poses a major problem for nuclear projects.
Analysis of the economics of nuclear power must take into account
who bears the risks of future uncertainties. To date all operating
nuclear power plants were developed by state-owned or regulated utility monopolies
where many of the risks associated with construction costs, operating
performance, fuel price, and other factors were borne by consumers
rather than suppliers. Many countries have now liberalized the electricity market
where these risks, and the risk of cheaper competitors emerging before
capital costs are recovered, are borne by plant suppliers and operators
rather than consumers, which leads to a significantly different
evaluation of the economics of new nuclear power plants.
Fukushima
Following the 2011 Fukushima Daiichi nuclear disaster – the second worst nuclear incident, that displaced 50,000 households after radioactive material leaked into the air, soil and sea, and with subsequent radiation checks leading to bans on some shipments of vegetables and fish – a global public support survey by Ipsos (2011) for energy sources was published and nuclear fission was found to be the least popular
Costs
Costs are
likely to go up for currently operating and new nuclear power plants,
due to increased requirements for on-site spent fuel management and
elevated design basis threats.
While first of their kind designs, such as the EPRs under construction
are behind schedule and over-budget, of the seven South Korean APR-1400s presently under construction worldwide, two are in S.Korea at the Hanul Nuclear Power Plant and four are at the largest nuclear station construction project in the world as of 2016, in the United Arab Emirates at the planned Barakah nuclear power plant. The first reactor, Barakah-1 is 85% completed and on schedule for grid-connection during 2017.
Two of the four EPRs under construction (in Finland and France) are significantly behind schedule and substantially over cost.
Renewable sources

Renewable energy is generally defined as energy that comes from resources which are naturally replenished on a human timescale such as sunlight, wind, rain, tides, waves and geothermal heat. Renewable energy replaces conventional fuels in four distinct areas: electricity generation, hot water/space heating, motor fuels, and rural (off-grid) energy services.
About 16% of global final energy consumption presently comes from renewable resources, with 10% of all energy from traditional biomass, mainly used for heating, and 3.4% from hydroelectricity.
New renewables (small hydro, modern biomass, wind, solar, geothermal,
and biofuels) account for another 3% and are growing rapidly.
At the national level, at least 30 nations around the world already
have renewable energy contributing more than 20% of energy supply.
National renewable energy markets are projected to continue to grow
strongly in the coming decade and beyond. Wind power, for example, is growing at the rate of 30% annually, with a worldwide installed capacity of 282,482 megawatts (MW) at the end of 2012.
Renewable energy resources exist over wide geographical areas, in
contrast to other energy sources, which are concentrated in a limited
number of countries. Rapid deployment of renewable energy and energy efficiency is resulting in significant energy security, climate change mitigation, and economic benefits.
In international public opinion surveys there is strong support for
promoting renewable sources such as solar power and wind power.
While many renewable energy projects are large-scale, renewable technologies are also suited to rural and remote areas and developing countries, where energy is often crucial in human development. United Nations' Secretary-General Ban Ki-moon has said that renewable energy has the ability to lift the poorest nations to new levels of prosperity.
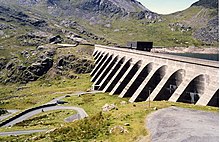
Hydroelectricity

Hydroelectricity is electric power generated by hydropower;
the force of falling or flowing water. In 2015 hydropower generated
16.6% of the world's total electricity and 70% of all renewable
electricity and was expected to increase about 3.1% each year for the following 25 years.
Hydropower is produced in 150 countries, with the Asia-Pacific
region generating 32 percent of global hydropower in 2010. China is the
largest hydroelectricity producer, with 721 terawatt-hours of production
in 2010, representing around 17 percent of domestic electricity use.
There are now three hydroelectricity plants larger than 10 GW: the Three Gorges Dam in China, Itaipu Dam across the Brazil/Paraguay border, and Guri Dam in Venezuela.
The cost of hydroelectricity is relatively low, making it a
competitive source of renewable electricity. The average cost of
electricity from a hydro plant larger than 10 megawatts is 3 to 5 U.S.
cents per kilowatt-hour.
Hydro is also a flexible source of electricity since plants can be
ramped up and down very quickly to adapt to changing energy demands.
However, damming interrupts the flow of rivers and can harm local
ecosystems, and building large dams and reservoirs often involves
displacing people and wildlife.
Once a hydroelectric complex is constructed, the project produces no
direct waste, and has a considerably lower output level of the greenhouse gas carbon dioxide than fossil fuel powered energy plants.
Wind


Wind power harnesses the power of the wind to propel the blades of wind turbines. These turbines cause the rotation of magnets, which creates electricity. Wind towers are usually built together on wind farms. There are offshore and onshore wind farms. Global wind power capacity has expanded rapidly to 336 GW in June 2014, and wind energy production was around 4% of total worldwide electricity usage, and growing rapidly.
Wind power is widely used in Europe, Asia, and the United States.
Several countries have achieved relatively high levels of wind power
penetration, such as 21% of stationary electricity production in Denmark, 18% in Portugal, 16% in Spain, 14% in Ireland, and 9% in Germany in 2010. By 2011, at times over 50% of electricity in Germany and Spain came from wind and solar power. As of 2011, 83 countries around the world are using wind power on a commercial basis.
Many of the world's largest onshore wind farms are located in the United States, China, and India. Most of the world's largest offshore wind farms are located in Denmark, Germany and the United Kingdom. The two largest offshore wind farm are currently the 630 MW London Array and Gwynt y Môr.
| Wind farm | Current capacity (MW) |
Country | |
|---|---|---|---|
| Alta (Oak Creek-Mojave) | 1,320 | ||
| Jaisalmer Wind Park | 1,064 | ||
| Roscoe Wind Farm | 781 | ||
| Horse Hollow Wind Energy Center | 735 | ||
| Capricorn Ridge Wind Farm | 662 | ||
| Fântânele-Cogealac Wind Farm | 600 | ||
| Fowler Ridge Wind Farm | 599 |
Solar


Solar energy, radiant light and heat from the sun, is harnessed using a range of ever-evolving technologies such as solar heating, solar photovoltaics, solar thermal electricity, solar architecture and artificial photosynthesis.
Solar technologies are broadly characterized as either passive solar or active solar
depending on the way they capture, convert and distribute solar energy.
Active solar techniques include the use of photovoltaic panels and solar thermal
collectors to harness the energy. Passive solar techniques include
orienting a building to the Sun, selecting materials with favorable thermal mass or light dispersing properties, and designing spaces that naturally circulate air.
In 2011, the International Energy Agency
said that "the development of affordable, inexhaustible and clean solar
energy technologies will have huge longer-term benefits. It will
increase countries’ energy security through reliance on an indigenous,
inexhaustible and mostly import-independent resource, enhance sustainability, reduce pollution, lower the costs of mitigating climate change, and keep fossil fuel
prices lower than otherwise. These advantages are global. Hence the
additional costs of the incentives for early deployment should be
considered learning investments; they must be wisely spent and need to
be widely shared". More than 100 countries use solar PV.
.jpg)
The Topaz Solar Farm is one of the world's largest solar power stations
Photovoltaics (PV) is a method of generating electrical power by converting solar radiation into direct current electricity using semiconductors that exhibit the photovoltaic effect. Photovoltaic power generation employs solar panels composed of a number of solar cells containing a photovoltaic material. Materials presently used for photovoltaics include monocrystalline silicon, polycrystalline silicon, amorphous silicon, cadmium telluride, and copper indium gallium selenide/sulfide. Due to the increased demand for renewable energy sources, the manufacturing of solar cells and photovoltaic arrays has advanced considerably in recent years.
Solar photovoltaics is a sustainable energy source. By the end of 2018, a total of 505 GW had been installed worldwide with 100 GW installed in that year.
Driven by advances in technology and increases in manufacturing
scale and sophistication, the cost of photovoltaics has declined
steadily since the first solar cells were manufactured, and the levelised cost of electricity (LCOE) from PV is competitive with conventional electricity sources in an expanding list of geographic regions. Net metering and financial incentives, such as preferential feed-in tariffs for solar-generated electricity, have supported solar PV installations in many countries. The Energy Payback Time (EPBT), also known as energy amortization, depends on the location's annual solar insolation and temperature profile, as well as on the used type of PV-technology. For conventional crystalline silicon photovoltaics, the EPBT is higher than for thin-film technologies such as CdTe-PV or CPV-systems. Moreover, the payback time decreased in the recent years due to a number of improvements such as solar cell efficiency
and more economic manufacturing processes. As of 2014, photovoltaics
recoup on average the energy needed to manufacture them in 0.7 to 2
years. This results in about 95% of net-clean energy produced by a solar
rooftop PV system over a 30-year life-time.
Installations may be ground-mounted (and sometimes integrated with
farming and grazing) or built into the roof or walls of a building
(either building-integrated photovoltaics or simply rooftop).
Biofuels


Information on pump regarding ethanol fuel blend up to 10%, California
A biofuel is a fuel that contains energy from geologically recent carbon fixation. These fuels are produced from living organisms. Examples of this carbon fixation occur in plants and microalgae. These fuels are made by a biomass conversion (biomass refers to recently living organisms, most often referring to plants
or plant-derived materials). This biomass can be converted to
convenient energy containing substances in three different ways: thermal
conversion, chemical conversion, and biochemical conversion. This
biomass conversion can result in fuel in solid, liquid, or gas form. This new biomass can be used for biofuels. Biofuels have increased in popularity because of rising oil prices and the need for energy security.
Bioethanol is an alcohol made by fermentation, mostly from carbohydrates produced in sugar or starch crops such as corn or sugarcane. Cellulosic biomass, derived from non-food sources, such as trees and grasses, is also being developed as a feedstock for ethanol production. Ethanol can be used as a fuel for vehicles in its pure form, but it is usually used as a gasoline additive to increase octane and improve vehicle emissions. Bioethanol is widely used in the USA and in Brazil. Current plant design does not provide for converting the lignin portion of plant raw materials to fuel components by fermentation.
Biodiesel is made from vegetable oils and animal fats. Biodiesel can be used as a fuel for vehicles in its pure form, but it is usually used as a diesel additive to reduce levels of particulates, carbon monoxide, and hydrocarbons from diesel-powered vehicles. Biodiesel is produced from oils or fats using transesterification and is the most common biofuel in Europe. However, research is underway on producing renewable fuels from decarboxylation
In 2010, worldwide biofuel production reached 105 billion liters (28 billion gallons US), up 17% from 2009, and biofuels provided 2.7% of the world's fuels for road transport, a contribution largely made up of ethanol and biodiesel. Global ethanol fuel
production reached 86 billion liters (23 billion gallons US) in 2010,
with the United States and Brazil as the world's top producers,
accounting together for 90% of global production. The world's largest
biodiesel producer is the European Union, accounting for 53% of all biodiesel production in 2010. As of 2011, mandates for blending biofuels exist in 31 countries at the national level and in 29 states or provinces. The International Energy Agency
has a goal for biofuels to meet more than a quarter of world demand for
transportation fuels by 2050 to reduce dependence on petroleum and
coal.
Geothermal

Steam rising from the Nesjavellir Geothermal Power Station in Iceland
Geothermal energy is thermal energy generated and stored in the Earth. Thermal energy is the energy that determines the temperature of matter. The geothermal energy of the Earth's crust originates from the original formation of the planet (20%) and from radioactive decay of minerals (80%). The geothermal gradient,
which is the difference in temperature between the core of the planet
and its surface, drives a continuous conduction of thermal energy in the
form of heat from the core to the surface. The adjective geothermal originates from the Greek roots γη (ge), meaning earth, and θερμος (thermos), meaning hot.
Earth's internal heat is thermal energy generated from radioactive decay and continual heat loss from Earth's formation. Temperatures at the core-mantle boundary may reach over 4000 °C (7,200 °F). The high temperature and pressure in Earth's interior cause some rock to melt and solid mantle to behave plastically, resulting in portions of mantle convecting upward since it is lighter than the surrounding rock. Rock and water is heated in the crust, sometimes up to 370 °C (700 °F).
From hot springs, geothermal energy has been used for bathing since Paleolithic times and for space heating since ancient Roman times, but it is now better known for electricity generation. Worldwide, 11,400 megawatts (MW) of geothermal power is online in 24 countries in 2012. An additional 28 gigawatts of direct geothermal heating
capacity is installed for district heating, space heating, spas,
industrial processes, desalination and agricultural applications in
2010.
Geothermal power is cost effective, reliable, sustainable, and environmentally friendly, but has historically been limited to areas near tectonic plate boundaries.
Recent technological advances have dramatically expanded the range and
size of viable resources, especially for applications such as home
heating, opening a potential for widespread exploitation. Geothermal
wells release greenhouse gases trapped deep within the earth, but these
emissions are much lower per energy unit than those of fossil fuels. As a
result, geothermal power has the potential to help mitigate global warming if widely deployed in place of fossil fuels.
The Earth's geothermal resources are theoretically more than
adequate to supply humanity's energy needs, but only a very small
fraction may be profitably exploited. Drilling and exploration for deep
resources is very expensive. Forecasts for the future of geothermal
power depend on assumptions about technology, energy prices, subsidies,
and interest rates. Pilot programs like EWEB's customer opt in Green
Power Program show that customers would be willing to pay a little more for a
renewable energy source like geothermal. But as a result of government
assisted research and industry experience, the cost of generating
geothermal power has decreased by 25% over the past two decades. In 2001, geothermal energy cost between two and ten US cents per kWh.
Oceanic
Marine energy or marine power (also sometimes referred to as ocean energy, ocean power, or marine and hydrokinetic energy) refers to the energy carried by ocean waves, tides, salinity, and ocean temperature differences. The movement of water in the world's oceans creates a vast store of kinetic energy, or energy in motion. This energy can be harnessed to generate electricity to power homes, transport and industries.
The term marine energy encompasses both wave power i.e. power from surface waves, and tidal power i.e. obtained from the kinetic energy of large bodies of moving water. Offshore wind power is not a form of marine energy, as wind power is derived from the wind, even if the wind turbines
are placed over water.
The oceans have a tremendous amount of energy and are close to many if
not most concentrated populations. Ocean energy has the potential of
providing a substantial amount of new renewable energy around the world.
100% renewable energy
The incentive to use 100% renewable energy, for electricity,
transport, or even total primary energy supply globally, has been
motivated by global warming and other ecological as well as economic concerns. Renewable energy use has grown much faster than anyone anticipated. The Intergovernmental Panel on Climate Change
has said that there are few fundamental technological limits to
integrating a portfolio of renewable energy technologies to meet most of
total global energy demand.
At the national level, at least 30 nations around the world already
have renewable energy contributing more than 20% of energy supply.
Also, Professors S. Pacala and Robert H. Socolow have developed a series of "stabilization wedges"
that can allow us to maintain our quality of life while avoiding
catastrophic climate change, and "renewable energy sources," in
aggregate, constitute the largest number of their "wedges."
Mark Z. Jacobson says producing all new energy with wind power, solar power, and hydropower
by 2030 is feasible and existing energy supply arrangements could be
replaced by 2050. Barriers to implementing the renewable energy plan are
seen to be "primarily social and political, not technological or
economic". Jacobson says that energy costs with a wind, solar, water
system should be similar to today's energy costs.
Similarly, in the United States, the independent National
Research Council has noted that "sufficient domestic renewable resources
exist to allow renewable electricity to play a significant role in
future electricity generation and thus help confront issues related to
climate change, energy security, and the escalation of energy costs …
Renewable energy is an attractive option because renewable resources
available in the United States, taken collectively, can supply
significantly greater amounts of electricity than the total current or
projected domestic demand." .
Critics of the "100% renewable energy" approach include Vaclav Smil and James E. Hansen. Smil and Hansen are concerned about the variable output of solar and wind power, but Amory Lovins argues that the electricity grid can cope, just as it routinely backs up nonworking coal-fired and nuclear plants with working ones.
Google spent $30 million on their RE


Increased energy efficiency

A spiral-type integrated compact fluorescent lamp, which has been popular among North American consumers since its introduction in the mid-1990s
Although increasing the efficiency of energy use is not energy
development per se, it may be considered under the topic of energy
development since it makes existing energy sources available to do work.
Efficient energy use reduces the amount of energy required to provide products and services. For example, insulating a home allows a building to use less heating and cooling energy to maintain a comfortable temperature. Installing fluorescent lamps or natural skylights reduces the amount of energy required for illumination compared to incandescent light bulbs. Compact fluorescent lights
use two-thirds less energy and may last 6 to 10 times longer than
incandescent lights. Improvements in energy efficiency are most often
achieved by adopting an efficient technology or production process.
Reducing energy use may save consumers money, if the energy
savings offsets the cost of an energy efficient technology. Reducing
energy use reduces emissions. According to the International Energy Agency, improved energy efficiency in buildings, industrial processes and transportation could reduce the world's energy needs in 2050 by one third, and help control global emissions of greenhouse gases.
Energy efficiency and renewable energy are said to be the twin pillars of sustainable energy policy.
In many countries energy efficiency is also seen to have a national
security benefit because it can be used to reduce the level of energy
imports from foreign countries and may slow down the rate at which
domestic energy resources are depleted.
It's been discovered "that for OECD countries, wind, geothermal,
hydro and nuclear have the lowest hazard rates among energy sources in
production".
Transmission

An elevated section of the Alaska Pipeline
While new sources of energy are only rarely discovered or made possible by new technology, distribution technology continually evolves. The use of fuel cells in cars, for example, is an anticipated delivery technology.
This section presents the various delivery technologies that have been
important to historic energy development. They all rely in way on the
energy sources listed in the previous section.
Shipping and pipelines
Coal, petroleum and their derivatives are delivered by boat, rail, or road. Petroleum and natural gas may also be delivered by pipeline, and coal via a Slurry pipeline. Fuels such as gasoline and LPG may also be delivered via aircraft.
Natural gas pipelines must maintain a certain minimum pressure to
function correctly. The higher costs of ethanol transportation and
storage are often prohibitive.
Wired energy transfer

Electrical grid – pylons and cables distribute power
Electricity grids are the networks used to transmit and distribute power
from production source to end user, when the two may be hundreds of
kilometres away. Sources include electrical generation plants such as a
nuclear reactor,
coal burning power plant, etc. A combination of sub-stations and
transmission lines are used to maintain a constant flow of electricity.
Grids may suffer from transient blackouts and brownouts, often due to weather damage. During certain extreme space weather events solar wind can interfere with transmissions. Grids also have a predefined carrying capacity
or load that cannot safely be exceeded. When power requirements exceed
what's available, failures are inevitable. To prevent problems, power is
then rationed.
Industrialised countries such as Canada, the US,
and Australia are among the highest per capita consumers of electricity
in the world, which is possible thanks to a widespread electrical
distribution network. The US grid is one of the most advanced, although infrastructure maintenance is becoming a problem. CurrentEnergy provides a realtime overview of the electricity supply and demand for California, Texas,
and the Northeast of the US. African countries with small scale
electrical grids have a correspondingly low annual per capita usage of
electricity. One of the most powerful power grids in the world supplies
power to the state of Queensland, Australia.
Wireless energy transfer
Wireless power transfer
is a process whereby electrical energy is transmitted from a power
source to an electrical load that does not have a built-in power source,
without the use of interconnecting wires. Currently available
technology is limited to short distances and relatively low power level.
Orbiting solar power collectors would require wireless
transmission of power to Earth. The proposed method involves creating a
large beam of microwave-frequency radio waves, which would be aimed at a
collector antenna site on the Earth. Formidable technical challenges
exist to ensure the safety and profitability of such a scheme.
Storage

The Ffestiniog Power Station in Wales, United Kingdom. Pumped-storage hydroelectricity (PSH) is used for grid energy storage.
Energy storage is accomplished by devices or physical media that store energy to perform useful operation at a later time. A device that stores energy is sometimes called an accumulator.
All forms of energy are either potential energy (e.g. Chemical, gravitational, electrical energy, temperature differential, latent heat, etc.) or kinetic energy (e.g. momentum). Some technologies provide only short-term energy storage, and others can be very long-term such as power to gas using hydrogen or methane and the storage of heat or cold between opposing seasons in deep aquifers or bedrock. A wind-up clock stores potential energy (in this case mechanical, in the spring tension), a battery stores readily convertible chemical energy to operate a mobile phone, and a hydroelectric dam stores energy in a reservoir as gravitational potential energy. Ice storage tanks store ice (thermal energy in the form of latent heat) at night to meet peak demand for cooling. Fossil fuels
such as coal and gasoline store ancient energy derived from sunlight by
organisms that later died, became buried and over time were then
converted into these fuels. Even food (which is made by the same process as fossil fuels) is a form of energy stored in chemical form.
History

Energy generators past and present at Doel, Belgium: 17th-century windmill Scheldemolen and 20th-century Doel Nuclear Power Station
Since prehistory, when humanity discovered fire to warm up and roast
food, through the Middle Ages in which populations built windmills to
grind the wheat, until the modern era in which nations can get
electricity splitting the atom. Man has sought endlessly for energy
sources.
Except nuclear, geothermal and tidal,
all other energy sources are from current solar isolation or from
fossil remains of plant and animal life that relied upon sunlight.
Ultimately, solar energy itself is the result of the Sun's nuclear fusion. Geothermal power from hot, hardened rock above the magma of the Earth's core is the result of the decay of radioactive materials present beneath the Earth's crust, and nuclear fission relies on man-made fission of heavy radioactive elements in the Earth's crust; in both cases these elements were produced in supernova explosions before the formation of the solar system.
Since the beginning of the Industrial Revolution, the question of the future of energy supplies has been of interest. In 1865, William Stanley Jevons published The Coal Question in which he saw that the reserves of coal were being depleted and that oil was an ineffective replacement. In 1914, U.S. Bureau of Mines stated that the total production was 5.7 billion barrels (910,000,000 m3). In 1956, Geophysicist M. King Hubbert deduces that U.S. oil production would peak
between 1965 and 1970 and that oil production will peak "within half a
century" on the basis of 1956 data. In 1989, predicted peak by Colin Campbell In 2004, OPEC estimated, with substantial investments, it would nearly double oil output by 2025
Sustainability

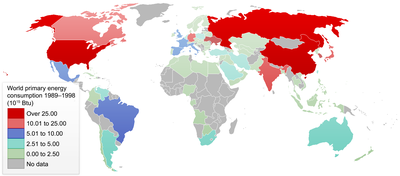
Energy consumption from 1989 to 1999
The environmental movement has emphasized sustainability of energy use and development. Renewable energy
is sustainable in its production; the available supply will not be
diminished for the foreseeable future - millions or billions of years.
"Sustainability" also refers to the ability of the environment to cope
with waste products, especially air pollution.
Sources which have no direct waste products (such as wind, solar, and
hydropower) are brought up on this point. With global demand for energy
growing, the need to adopt various energy sources is growing. Energy conservation is an alternative or complementary process to energy development. It reduces the demand for energy by using it efficiently.
Resilience

Energy consumption per capita (2001). Red hues indicate increase, green hues decrease of consumption during the 1990s.
Some observers contend that idea of "energy independence" is an unrealistic and opaque concept.
The alternative offer of "energy resilience" is a goal aligned with
economic, security, and energy realities. The notion of resilience in
energy was detailed in the 1982 book Brittle Power: Energy Strategy for National Security.
The authors argued that simply switching to domestic energy would not
be secure inherently because the true weakness is the often
interdependent and vulnerable energy infrastructure of a country. Key
aspects such as gas lines and the electrical power grid are often
centralized and easily susceptible to disruption. They conclude that a
"resilient energy supply" is necessary for both national security and
the environment. They recommend a focus on energy efficiency and
renewable energy that is decentralized.
In 2008, former Intel Corporation Chairman and CEO Andrew Grove looked to energy resilience, arguing that complete independence is unfeasible given the global market for energy.
He describes energy resilience as the ability to adjust to
interruptions in the supply of energy. To that end, he suggests the U.S.
make greater use of electricity.
Electricity can be produced from a variety of sources. A diverse energy
supply will be less affected by the disruption in supply of any one
source. He reasons that another feature of electrification is that
electricity is "sticky" – meaning the electricity produced in the U.S.
is to stay there because it cannot be transported overseas. According
to Grove, a key aspect of advancing electrification and energy
resilience will be converting the U.S. automotive fleet from
gasoline-powered to electric-powered. This, in turn, will require the
modernization and expansion of the electrical power grid. As
organizations such as The Reform Institute have pointed out, advancements associated with the developing smart grid would facilitate the ability of the grid to absorb vehicles en masse connecting to it to charge their batteries.
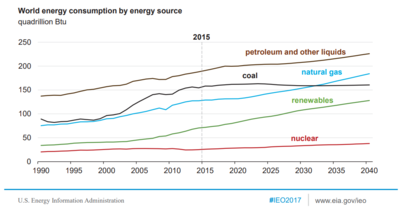
Present and future

Outlook—World Energy Consumption by Fuel (as of 2011)
Liquid fuels incl. Biofuels Coal Natural Gas
Renewable fuels Nuclear fuels
Liquid fuels incl. Biofuels Coal Natural Gas
Renewable fuels Nuclear fuels

Increasing share of energy consumption by developing nations
Industrialized nations
Developing nations
EE/Former Soviet Union
Industrialized nations
Developing nations
EE/Former Soviet Union
Extrapolations from current knowledge to the future offer a choice of energy futures. Predictions parallel the Malthusian catastrophe hypothesis. Numerous are complex models based scenarios as pioneered by Limits to Growth. Modeling approaches offer ways to analyze diverse strategies, and hopefully find a road to rapid and sustainable development of humanity. Short term energy crises
are also a concern of energy development. Extrapolations lack
plausibility, particularly when they predict a continual increase in oil
consumption.
Energy production usually requires an energy investment. Drilling
for oil or building a wind power plant requires energy. The fossil fuel
resources that are left are often increasingly difficult to extract and
convert. They may thus require increasingly higher energy investments.
If investment is greater than the value of the energy produced by the
resource, it is no longer an effective energy source. These resources
are no longer an energy source but may be exploited for value as raw
materials. New technology may lower the energy investment required to
extract and convert the resources, although ultimately basic physics
sets limits that cannot be exceeded.
Between 1950 and 1984, as the Green Revolution transformed agriculture around the globe, world grain production increased by 250%. The energy for the Green Revolution was provided by fossil fuels in the form of fertilizers (natural gas), pesticides (oil), and hydrocarbon fueled irrigation. The peaking of world hydrocarbon production (peak oil) may lead to significant changes, and require sustainable methods of production.
One vision of a sustainable energy future involves all human structures
on the earth's surface (i.e., buildings, vehicles and roads) doing artificial photosynthesis
(using sunlight to split water as a source of hydrogen and absorbing
carbon dioxide to make fertilizer) efficiently than plants.
With contemporary space industry's economic activity and the related private spaceflight, with the manufacturing industries, that go into Earth's orbit or beyond, delivering them to those regions will require further energy development. Researchers have contemplated space-based solar power
for collecting solar power for use on Earth. Space-based solar power
has been in research since the early 1970s. Space-based solar power
would require construction of collector structures in space. The
advantage over ground-based solar power is higher intensity of light,
and no weather to interrupt power collection.


