Search This Blog

Friday, April 2, 2021

Pleistocene

From Wikipedia, the free encyclopedia

Pleistocene
2.58 – 0.0117 Ma
Global sea levels during the last Ice Age.jpg
Map of the world during the Last Glacial Maximum
 
Chronology
Quaternary Graphical Timeline
-2.6 —
-2.4 —
-2.2 —
-2 —
-1.8 —
-1.6 —
-1.4 —
-1.2 —
-1 —
-0.8 —
-0.6 —
-0.4 —
-0.2 —
0 —
 
Subdivision of the Quaternary according to the ICS, as of 2021.
Vertical axis scale: millions of years ago.
Etymology
Name formalityFormal
Usage information
Celestial bodyEarth
Regional usageGlobal (ICS)
Time scale(s) usedICS Time Scale
Definition
Chronological unitEpoch
Stratigraphic unitSeries
Time span formalityFormal
Lower boundary definition
Lower boundary GSSPMonte San Nicola Section, Gela, Sicily, Italy
37.1469°N 14.2035°E
GSSP ratified2009 (as base of Quaternary and Pleistocene)
Upper boundary definitionEnd of the Younger Dryas stadial
Upper boundary GSSPNGRIP2 ice core, Greenland
75.1000°N 42.3200°W
GSSP ratified2008 (as base of Holocene)

The Pleistocene ( /ˈpls.təˌsn, -t-/ PLYSE-tə-seen, -⁠toh-, often colloquially referred to as the Ice Age) is the geological epoch that lasted from about 2,580,000 to 11,700 years ago, spanning the world's most recent period of repeated glaciations. Before a change finally confirmed in 2009 by the International Union of Geological Sciences, the cutoff of the Pleistocene and the preceding Pliocene was regarded as being at 1.806 million years Before Present (BP). Publications from earlier years may use either definition of the period. The end of the Pleistocene corresponds with the end of the last glacial period and also with the end of the Paleolithic age used in archaeology. The name is a combination of Ancient Greek πλεῖστος (pleīstos, "most") and καινός (kainós (latinized as cænus), "new".

At the end of the preceding Pliocene, the previously isolated North and South American continents were joined by the Isthmus of Panama, causing a faunal interchange between the two regions and changing ocean circulation patterns, with the onset of glaciation in the Northern Hemisphere occurring around 2.7 million years ago. During the Early Pleistocene (2.58-0.8 Ma), archaic humans of the genus Homo originated in Africa and spread throughout Afro-Eurasia. The end of the Early Pleistocene is marked by the Mid-Pleistocene Transition, with the cyclicity of glacial cycles changing from 41,000 year cycles to 100,000 year cycles. The Late Pleistocene witnessed the spread of modern humans outside of Africa as well as the extinction of all other human species. Humans also spread to the Australian continent and the Americas for the first time, co-incident with the extinction of most large bodied animals in these regions.

The aridification and cooling trends of the preceding Neogene were continued in the Pleistocene. The climate was strongly variable depending on the glacial cycle, with the sea levels being up to 120 metres lower than present at peak glaciation, allowing the connection of Asia and North America via Beringia and the covering of most of northern North America by the Laurentide ice sheet.

Etymology

Evolution of temperature in the Post-Glacial period at the very end of the Pleistocene, according to Greenland ice cores

Charles Lyell introduced the term "Pleistocene" in 1839 to describe strata in Sicily that had at least 70% of their molluscan fauna still living today. This distinguished it from the older Pliocene epoch, which Lyell had originally thought to be the youngest fossil rock layer. He constructed the name "Pleistocene" ("Most New" or "Newest") from the Greek πλεῖστος (pleīstos, "most") and καινός (kainós (latinized as cænus), "new"); this contrasts with the immediately preceding Pliocene ("newer", from πλείων (pleíōn, "more") and kainós) and the immediately subsequent Holocene ("wholly new" or "entirely new", from ὅλος (hólos, "whole") and kainós) epoch, which extends to the present time.

Dating

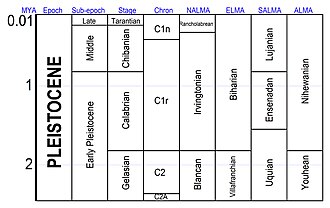
The Pleistocene has been dated from 2.580 million (±0.005) to 11,650 years BP with the end date expressed in radiocarbon years as 10,000 carbon-14 years BP. It covers most of the latest period of repeated glaciation, up to and including the Younger Dryas cold spell. The end of the Younger Dryas has been dated to about 9640 BC (11,654 calendar years BP). The end of the Younger Dryas is the official start of the current Holocene Epoch. Although it is considered an epoch, the Holocene is not significantly different from previous interglacial intervals within the Pleistocene. In the ICS timescale, the Pleistocene is divided into four stages or ages, the Gelasian, Calabrian, Chibanian (previously the unofficial "Middle Pleistocene"), and Upper Pleistocene (unofficially the "Tarantian"). In addition to these international subdivisions, various regional subdivisions are often used.

In 2009 the International Union of Geological Sciences (IUGS) confirmed a change in time period for the Pleistocene, changing the start date from 1.806 to 2.588 million years BP, and accepted the base of the Gelasian as the base of the Pleistocene, namely the base of the Monte San Nicola GSSP. The start date has now been rounded down to 2.580 million years BP. The IUGS has yet to approve a type section, Global Boundary Stratotype Section and Point (GSSP), for the upper Pleistocene/Holocene boundary (i.e. the upper boundary). The proposed section is the North Greenland Ice Core Project ice core 75° 06' N 42° 18' W. The lower boundary of the Pleistocene Series is formally defined magnetostratigraphically as the base of the Matuyama (C2r) chronozone, isotopic stage 103. Above this point there are notable extinctions of the calcareous nanofossils: Discoaster pentaradiatus and Discoaster surculus. The Pleistocene covers the recent period of repeated glaciations.

The name Plio-Pleistocene has, in the past, been used to mean the last ice age. Formerly, the boundary between the two epochs was drawn at the time when the foraminiferal species Hyalinea baltica first appeared in the marine section at La Castella, Calabria, Italy; however, the revised definition of the Quaternary, by pushing back the start date of the Pleistocene to 2.58 Ma, results in the inclusion of all the recent repeated glaciations within the Pleistocene.

Radiocarbon dating is considered to be inaccurate beyond around 50,000 years ago. Marine isotope stages (MIS) derived from Oxygen isotopes are often used for giving approximate dates.

Deposits

Pleistocene non-marine sediments are found primarily in fluvial deposits, lakebeds, slope and loess deposits as well as in the large amounts of material moved about by glaciers. Less common are cave deposits, travertines and volcanic deposits (lavas, ashes). Pleistocene marine deposits are found primarily in shallow marine basins mostly (but with important exceptions) in areas within a few tens of kilometers of the modern shoreline. In a few geologically active areas such as the Southern California coast, Pleistocene marine deposits may be found at elevations of several hundred meters.

Paleogeography and climate

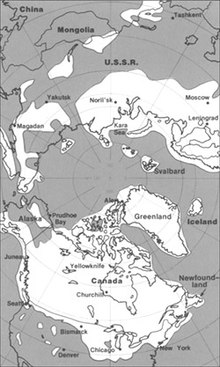
The maximum extent of glacial ice in the north polar area during the Pleistocene period

The modern continents were essentially at their present positions during the Pleistocene, the plates upon which they sit probably having moved no more than 100 km relative to each other since the beginning of the period. In glacial periods, the sea level would drop by over 100 metres during peak glaciation, exposing large areas of present continental shelf as dry land.

According to Mark Lynas (through collected data), the Pleistocene's overall climate could be characterized as a continuous El Niño with trade winds in the south Pacific weakening or heading east, warm air rising near Peru, warm water spreading from the west Pacific and the Indian Ocean to the east Pacific, and other El Niño markers.

Glacial features

Pleistocene climate was marked by repeated glacial cycles in which continental glaciers pushed to the 40th parallel in some places. It is estimated that, at maximum glacial extent, 30% of the Earth's surface was covered by ice. In addition, a zone of permafrost stretched southward from the edge of the glacial sheet, a few hundred kilometres in North America, and several hundred in Eurasia. The mean annual temperature at the edge of the ice was −6 °C (21 °F); at the edge of the permafrost, 0 °C (32 °F).

Each glacial advance tied up huge volumes of water in continental ice sheets 1,500 to 3,000 metres (4,900–9,800 ft) thick, resulting in temporary sea-level drops of 100 metres (300 ft) or more over the entire surface of the Earth. During interglacial times, such as at present, drowned coastlines were common, mitigated by isostatic or other emergent motion of some regions.

The effects of glaciation were global. Antarctica was ice-bound throughout the Pleistocene as well as the preceding Pliocene. The Andes were covered in the south by the Patagonian ice cap. There were glaciers in New Zealand and Tasmania. The current decaying glaciers of Mount Kenya, Mount Kilimanjaro, and the Ruwenzori Range in east and central Africa were larger. Glaciers existed in the mountains of Ethiopia and to the west in the Atlas mountains.

In the northern hemisphere, many glaciers fused into one. The Cordilleran Ice Sheet covered the North American northwest; the east was covered by the Laurentide. The Fenno-Scandian ice sheet rested on northern Europe, including much of Great Britain; the Alpine ice sheet on the Alps. Scattered domes stretched across Siberia and the Arctic shelf. The northern seas were ice-covered.

South of the ice sheets large lakes accumulated because outlets were blocked and the cooler air slowed evaporation. When the Laurentide Ice Sheet retreated, north-central North America was totally covered by Lake Agassiz. Over a hundred basins, now dry or nearly so, were overflowing in the North American west. Lake Bonneville, for example, stood where Great Salt Lake now does. In Eurasia, large lakes developed as a result of the runoff from the glaciers. Rivers were larger, had a more copious flow, and were braided. African lakes were fuller, apparently from decreased evaporation. Deserts, on the other hand, were drier and more extensive. Rainfall was lower because of the decreases in oceanic and other evaporation.

It has been estimated that during the Pleistocene, the East Antarctic Ice Sheet thinned by at least 500 meters, and that thinning since the Last Glacial Maximum is less than 50 meters and probably started after ca 14 ka.

Major events

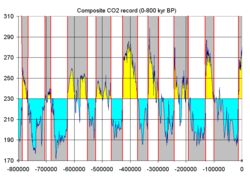
Ice ages as reflected in atmospheric CO2, stored in bubbles from glacial ice of Antarctica

Over 11 major glacial events have been identified, as well as many minor glacial events. A major glacial event is a general glacial excursion, termed a "glacial." Glacials are separated by "interglacials". During a glacial, the glacier experiences minor advances and retreats. The minor excursion is a "stadial"; times between stadials are "interstadials".

These events are defined differently in different regions of the glacial range, which have their own glacial history depending on latitude, terrain and climate. There is a general correspondence between glacials in different regions. Investigators often interchange the names if the glacial geology of a region is in the process of being defined. However, it is generally incorrect to apply the name of a glacial in one region to another.

For most of the 20th century only a few regions had been studied and the names were relatively few. Today the geologists of different nations are taking more of an interest in Pleistocene glaciology. As a consequence, the number of names is expanding rapidly and will continue to expand. Many of the advances and stadials remain unnamed. Also, the terrestrial evidence for some of them has been erased or obscured by larger ones, but evidence remains from the study of cyclical climate changes.

The glacials in the following tables show historical usages, are a simplification of a much more complex cycle of variation in climate and terrain, and are generally no longer used. These names have been abandoned in favor of numeric data because many of the correlations were found to be either inexact or incorrect and more than four major glacials have been recognized since the historical terminology was established.

Historical names of the "four major" glacials in four regions.
Region Glacial 1 Glacial 2 Glacial 3 Glacial 4
Alps Günz Mindel Riss Würm
North Europe Eburonian Elsterian Saalian Weichselian
British Isles Beestonian Anglian Wolstonian Devensian
Midwest U.S. Nebraskan Kansan Illinoian Wisconsinan
 
Historical names of interglacials.
Region Interglacial 1 Interglacial 2 Interglacial 3
Alps Günz-Mindel Mindel-Riss Riss-Würm
North Europe Waalian Holsteinian Eemian
British Isles Cromerian Hoxnian Ipswichian
Midwest U.S. Aftonian Yarmouthian Sangamonian

Corresponding to the terms glacial and interglacial, the terms pluvial and interpluvial are in use (Latin: pluvia, rain). A pluvial is a warmer period of increased rainfall; an interpluvial, of decreased rainfall. Formerly a pluvial was thought to correspond to a glacial in regions not iced, and in some cases it does. Rainfall is cyclical also. Pluvials and interpluvials are widespread.

There is no systematic correspondence of pluvials to glacials, however. Moreover, regional pluvials do not correspond to each other globally. For example, some have used the term "Riss pluvial" in Egyptian contexts. Any coincidence is an accident of regional factors. Only a few of the names for pluvials in restricted regions have been stratigraphically defined.

Palaeocycles

The sum of transient factors acting at the Earth's surface is cyclical: climate, ocean currents and other movements, wind currents, temperature, etc. The waveform response comes from the underlying cyclical motions of the planet, which eventually drag all the transients into harmony with them. The repeated glaciations of the Pleistocene were caused by the same factors.

The Mid-Pleistocene Transition, approximately one million years ago, saw a change from low-amplitude glacial cycles with a dominant periodicity of 41,000 years to asymmetric high-amplitude cycles dominated by a periodicity of 100,000 years.

However, a 2020 study concluded that ice age terminations might have been influenced by obliquity since the Mid-Pleistocene Transition, which caused stronger summers in the Northern Hemisphere.

Milankovitch cycles

Glaciation in the Pleistocene was a series of glacials and interglacials, stadials and interstadials, mirroring periodic changes in climate. The main factor at work in climate cycling is now believed to be Milankovitch cycles. These are periodic variations in regional and planetary solar radiation reaching the Earth caused by several repeating changes in the Earth's motion.

Milankovitch cycles cannot be the sole factor responsible for the variations in climate since they explain neither the long term cooling trend over the Plio-Pleistocene, nor the millennial variations in the Greenland Ice Cores. Milankovitch pacing seems to best explain glaciation events with periodicity of 100,000, 40,000, and 20,000 years. Such a pattern seems to fit the information on climate change found in oxygen isotope cores.

Oxygen isotope ratio cycles

In oxygen isotope ratio analysis, variations in the ratio of 18
O
to 16
O
(two isotopes of oxygen) by mass (measured by a mass spectrometer) present in the calcite of oceanic core samples is used as a diagnostic of ancient ocean temperature change and therefore of climate change. Cold oceans are richer in 18
O
, which is included in the tests of the microorganisms (foraminifera) contributing the calcite.

A more recent version of the sampling process makes use of modern glacial ice cores. Although less rich in 18
O
than sea water, the snow that fell on the glacier year by year nevertheless contained 18
O
and 16
O
in a ratio that depended on the mean annual temperature.

Temperature and climate change are cyclical when plotted on a graph of temperature versus time. Temperature coordinates are given in the form of a deviation from today's annual mean temperature, taken as zero. This sort of graph is based on another of isotope ratio versus time. Ratios are converted to a percentage difference from the ratio found in standard mean ocean water (SMOW).

The graph in either form appears as a waveform with overtones. One half of a period is a Marine isotopic stage (MIS). It indicates a glacial (below zero) or an interglacial (above zero). Overtones are stadials or interstadials.

According to this evidence, Earth experienced 102 MIS stages beginning at about 2.588 Ma BP in the Early Pleistocene Gelasian. Early Pleistocene stages were shallow and frequent. The latest were the most intense and most widely spaced.

By convention, stages are numbered from the Holocene, which is MIS1. Glacials receive an even number; interglacials, odd. The first major glacial was MIS2-4 at about 85–11 ka BP. The largest glacials were 2, 6, 12, and 16; the warmest interglacials, 1, 5, 9 and 11. For matching of MIS numbers to named stages, see under the articles for those names.

Fauna

Pleistocene of Northern Spain, including woolly mammoth, cave lions eating a reindeer, tarpans, and woolly rhinoceros
 
Pleistocene of South America, including Megatherium and two Glyptodon

Both marine and continental faunas were essentially modern but with many more large land mammals such as Mammoths, Mastodons, Diprotodon, Smilodon, tiger, lion, Aurochs, short-faced bears, giant sloths, Gigantopithecus and others. Isolated landmasses such as Australia, Madagascar, New Zealand and islands in the Pacific saw the evolution of large birds and even reptiles such as the Elephant bird, moa, Haast's eagle, Quinkana, Megalania and Meiolania.

The severe climatic changes during the Ice Age had major impacts on the fauna and flora. With each advance of the ice, large areas of the continents became totally depopulated, and plants and animals retreating southwards in front of the advancing glacier faced tremendous stress. The most severe stress resulted from drastic climatic changes, reduced living space, and curtailed food supply. A major extinction event of large mammals (megafauna), which included mammoths, mastodons, saber-toothed cats, glyptodons, the woolly rhinoceros, various giraffids, such as the Sivatherium; ground sloths, Irish elk, cave bears, Gomphothere, dire wolves, and short-faced bears, began late in the Pleistocene and continued into the Holocene. Neanderthals also became extinct during this period. At the end of the last ice age, cold-blooded animals, smaller mammals like wood mice, migratory birds, and swifter animals like whitetail deer had replaced the megafauna and migrated north. Late Pleistocene bighorn sheep were more slender and had longer legs than their descendants today. Scientists believe that the change in predator fauna after the late Pleistocene extinctions resulted in a change of body shape as the species adapted for increased power rather than speed.

The extinctions hardly affected Africa but were especially severe in North America where native horses and camels were wiped out.

Various schemes for subdividing the Pleistocene

In July 2018, a team of Russian scientists in collaboration with Princeton University announced that they had brought two female nematodes frozen in permafrost, from around 42,000 years ago, back to life. The two nematodes, at the time, were the oldest confirmed living animals on the planet.

Humans

The evolution of anatomically modern humans took place during the Pleistocene. In the beginning of the Pleistocene Paranthropus species were still present, as well as early human ancestors, but during the lower Palaeolithic they disappeared, and the only hominin species found in fossilic records is Homo erectus for much of the Pleistocene. Acheulean lithics appear along with Homo erectus, some 1.8 million years ago, replacing the more primitive Oldowan industry used by A. garhi and by the earliest species of Homo. The Middle Paleolithic saw more varied speciation within Homo, including the appearance of Homo sapiens about 200,000 years ago.

According to mitochondrial timing techniques, modern humans migrated from Africa after the Riss glaciation in the Middle Palaeolithic during the Eemian Stage, spreading all over the ice-free world during the late Pleistocene. A 2005 study posits that humans in this migration interbred with archaic human forms already outside of Africa by the late Pleistocene, incorporating archaic human genetic material into the modern human gene pool.

Hominin species during Pleistocene
Homo (genus)AustralopithecusAustralopithecus sedibaAustralopithecus africanusHomo floresiensisHomo neanderthalensisHomo sapiensHomo heidelbergensisHomo erectusHomo nalediHomo habilisHolocenePleistocenePliocene

Cenozoic

From Wikipedia, the free encyclopedia
 
Cenozoic
66.0 – 0 Ma
Torre Sant'Andrea.jpg
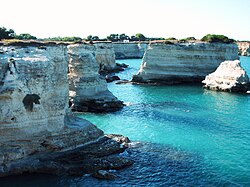
Rock deposits from the Cenozoic Era (Torre Sant'Andrea, Salento, Italy)
 
Chronology
Periods of the Cenozoic
-70 —
-60 —
-50 —
-40 —
-30 —
-20 —
-10 —
0 —
An approximate timescale of key Cenozoic events.
Axis scale: millions of years ago.
Etymology
Name formalityFormal
Nickname(s)Age of Mammals
Usage information
Celestial bodyEarth
Regional usageGlobal (ICS)
Time scale(s) usedICS Time Scale
Definition
Chronological unitEra
Stratigraphic unitErathem
Time span formalityFormal
Lower boundary definitionIridium enriched layer associated with a major meteorite impact and subsequent K-Pg extinction event.
Lower boundary GSSPEl Kef Section, El Kef, Tunisia
36.1537°N 8.6486°E
GSSP ratified1991
Upper boundary definitionN/A
Upper boundary GSSPN/A
GSSP ratifiedN/A

The Cenozoic Era (/ˌs.nəˈz.ɪk, -n-, ˌsɛn.ə-, ˌsɛn.-/ see-nə-ZOH-ik, -⁠noh-, SEN-ə-, SEN-oh-) meaning "new life" is the current and most recent of the three geological eras of the Phanerozoic Eon. The Cretaceous–Paleogene extinction event (also referred to as the K-Pg, or K-T, extinction event) is the boundary between preceding Mesozoic era and the Cenozoic, which extends from 66 million years ago to the present day. Many species, including all non-avian dinosaurs, became extinct, in an event attributed by most experts to the impact of a large asteroid or other celestial body, the Chicxulub impactor.

The Cenozoic is also known as the Age of Mammals because the terrestrial animals that dominated both hemispheres were mammals – the Eutherians (placentals) in the northern hemisphere and the Metatherians (marsupials, now mainly restricted to Australia) in the southern hemisphere. The extinction of many groups allowed mammals and birds to greatly diversify so that large mammals and birds dominated the Earth. The continents also moved into their current positions during this era.

The Earth's climate had begun a drying and cooling trend, culminating in the glaciations of the Pleistocene Epoch, and partially offset by the Paleocene-Eocene Thermal Maximum.

Nomenclature

Cenozoic, meaning "new life," is derived from Greek καινός kainós "new," and ζωή zōḗ "life." The era is also known as the Cænozoic, Caenozoic, or Cainozoic (/ˌknəˈzɪk, ˌk-/). The name "Cenozoic" (originally: "Kainozoic") was proposed in 1840 by the British geologist John Phillips (1800–1874).

Divisions

The Cenozoic is divided into three periods: the Paleogene, Neogene, and Quaternary; and seven epochs: the Paleocene, Eocene, Oligocene, Miocene, Pliocene, Pleistocene, and Holocene. The Quaternary Period was officially recognized by the International Commission on Stratigraphy in June 2009, and the former term, Tertiary Period, became officially disused in 2004 due to the need to divide the Cenozoic into periods more like those of the earlier Paleozoic and Mesozoic eras. The common use of epochs during the Cenozoic helps paleontologists better organize and group the many significant events that occurred during this comparatively short interval of time. Knowledge of this era is more detailed than any other era because of the relatively young, well-preserved rocks associated with it.

Paleogene

The Paleogene spans from the extinction of non-avian dinosaurs, 66 million years ago, to the dawn of the Neogene, 23.03 million years ago. It features three epochs: the Paleocene, Eocene and Oligocene.

The Paleocene epoch lasted from 66 million to 56 million years ago. Modern placental mammals originated during this time. The Paleocene is a transitional point between the devastation that is the K–Pg extinction event, and the rich jungle environment that is the Early Eocene. The Early Paleocene saw the recovery of the earth. The continents began to take their modern shape, but all the continents and the subcontinent of India were separated from each other. Afro-Eurasia was separated by the Tethys Sea, and the Americas were separated by the strait of Panama, as the isthmus had not yet formed. This epoch featured a general warming trend, with jungles eventually reaching the poles. The oceans were dominated by sharks as the large reptiles that had once predominated were extinct. Archaic mammals filled the world such as creodonts (extinct carnivores, unrelated to existing Carnivora).

The Eocene Epoch ranged from 56 million years to 33.9 million years ago. In the Early-Eocene, species living in dense forest were unable to evolve into larger forms, as in the Paleocene. All known mammals were under 10 kilograms. Among them were early primates, whales and horses along with many other early forms of mammals. At the top of the food chains were huge birds, such as Paracrax. The temperature was 30 degrees Celsius with little temperature gradient from pole to pole. In the Mid-Eocene, the Circumpolar-Antarctic current between Australia and Antarctica formed. This disrupted ocean currents worldwide and as a result caused a global cooling effect, shrinking the jungles. This allowed mammals to grow to mammoth proportions, such as whales which, by that time, had become almost fully aquatic. Mammals like Andrewsarchus were at the top of the food-chain. The Late Eocene saw the rebirth of seasons, which caused the expansion of savanna-like areas, along with the evolution of grass. The end of the Eocene was marked by the Eocene-Oligocene extinction event, the European face of which is known as the Grande Coupure.

The Oligocene Epoch spans from 33.9 million to 23.03 million years ago. The Oligocene featured the expansion of grass which had led to many new species to evolve, including the first elephants, cats, dogs, marsupials and many other species still prevalent today. Many other species of plants evolved in this period too. A cooling period featuring seasonal rains was still in effect. Mammals still continued to grow larger and larger.

Neogene

The Neogene spans from 23.03 million to 2.58 million years ago. It features 2 epochs: the Miocene, and the Pliocene.

The Miocene epoch spans from 23.03 to 5.333 million years ago and is a period in which grass spread further, dominating a large portion of the world, at the expense of forests. Kelp forests evolved, encouraging the evolution of new species, such as sea otters. During this time, perissodactyla thrived, and evolved into many different varieties. Apes evolved into 30 species. The Tethys Sea finally closed with the creation of the Arabian Peninsula, leaving only remnants as the Black, Red, Mediterranean and Caspian Seas. This increased aridity. Many new plants evolved: 95% of modern seed plants evolved in the mid-Miocene.

The Pliocene epoch lasted from 5.333 to 2.58 million years ago. The Pliocene featured dramatic climactic changes, which ultimately led to modern species of flora and fauna. The Mediterranean Sea dried up for several million years (because the ice ages reduced sea levels, disconnecting the Atlantic from the Mediterranean, and evaporation rates exceeded inflow from rivers). Australopithecus evolved in Africa, beginning the human branch. The isthmus of Panama formed, and animals migrated between North and South America during the great American interchange, wreaking havoc on local ecologies. Climatic changes brought: savannas that are still continuing to spread across the world; Indian monsoons; deserts in central Asia; and the beginnings of the Sahara desert. The world map has not changed much since, save for changes brought about by the glaciations of the Quaternary, such as the Great Lakes, Hudson Bay, and the Baltic sea.

Quaternary

The Quaternary spans from 2.58 million years ago to present day, and is the shortest geological period in the Phanerozoic Eon. It features modern animals, and dramatic changes in the climate. It is divided into two epochs: the Pleistocene and the Holocene.

Megafauna of Pleistocene Europe (mammoths, cave lions, woolly rhino, reindeer, horses)

The Pleistocene lasted from 2.58 million to 11,700 years ago. This epoch was marked by ice ages as a result of the cooling trend that started in the Mid-Eocene. There were at least four separate glaciation periods marked by the advance of ice caps as far south as 40° N in mountainous areas. Meanwhile, Africa experienced a trend of desiccation which resulted in the creation of the Sahara, Namib, and Kalahari deserts. Many animals evolved including mammoths, giant ground sloths, dire wolves, saber-toothed cats, and most famously Homo sapiens. 100,000 years ago marked the end of one of the worst droughts in Africa, and led to the expansion of primitive humans. As the Pleistocene drew to a close, a major extinction wiped out much of the world's megafauna, including some of the hominid species, such as Neanderthals. All the continents were affected, but Africa to a lesser extent. It still retains many large animals, such as hippos.

The Holocene began 11,700 years ago and lasts to the present day. All recorded history and "the Human history" lies within the boundaries of the Holocene epoch. Human activity is blamed for a mass extinction that began roughly 10,000 years ago, though the species becoming extinct have only been recorded since the Industrial Revolution. This is sometimes referred to as the "Sixth Extinction". It is often cited that over 322 recorded species have become extinct due to human activity since the Industrial Revolution, but the rate may be as high as 500 veterbrate species alone, the majority of which have occurred after 1900.

Animal life

Early in the Cenozoic, following the K-Pg event, the planet was dominated by relatively small fauna, including small mammals, birds, reptiles, and amphibians. From a geological perspective, it did not take long for mammals and birds to greatly diversify in the absence of the dinosaurs that had dominated during the Mesozoic. Some flightless birds grew larger than humans. These species are sometimes referred to as "terror birds," and were formidable predators. Mammals came to occupy almost every available niche (both marine and terrestrial), and some also grew very large, attaining sizes not seen in most of today's terrestrial mammals.

Early animals were the Entelodon, Paraceratherium (a hornless rhinoceros relative) and Basilosaurus (an early whale). The extinction of many large diapsid groups, such as flightless dinosaurs, Plesiosauria and Pterosauria allowed mammals and birds to greatly diversify and become the world's predominant fauna.

Tectonics

Geologically, the Cenozoic is the era when the continents moved into their current positions. Australia-New Guinea, having split from Pangea during the early Cretaceous, drifted north and, eventually, collided with South-east Asia; Antarctica moved into its current position over the South Pole; the Atlantic Ocean widened and, later in the era (2.8 million years ago), South America became attached to North America with the isthmus of Panama.

India collided with Asia 55 to 45 million years ago creating the Himalayas; Arabia collided with Eurasia, closing the Tethys Ocean and creating the Zagros Mountains, around 35 million years ago.

The break-up of Gondwana in Late Cretaceous and Cenozoic times led to a shift in the river courses of various large African rivers including the Congo, Niger, Nile, Orange, Limpopo and Zambezi.

Climate

In the Cretaceous, the climate was hot and humid with lush forests at the poles, there was no permanent ice and sea levels were around 300 metres higher than today. This continued for the first 10 million years of the Paleocene, culminating in the Paleocene–Eocene Thermal Maximum about 55.5 million years ago. Around 50 million years ago the earth entered a period of long term cooling. This was mainly due to the collision of India with Eurasia, which caused the rise of the Himalayas: the upraised rocks eroded and reacted with CO
2
in the air, causing a long-term reduction in the proportion of this greenhouse gas in the atmosphere. Around 35 million years ago permanent ice began to build up on Antarctica. The cooling trend continued in the Miocene, with relatively short warmer periods. When South America became attached to North America creating the Isthmus of Panama around 2.8 million years ago, the Arctic region cooled due to the strengthening of the Humboldt and Gulf Stream currents, eventually leading to the glaciations of the Quaternary ice age, the current interglacial of which is the Holocene Epoch. Recent analysis of the geomagnetic reversal frequency, oxygen isotope record, and tectonic plate subduction rate, which are indicators of the changes in the heat flux at the core mantle boundary, climate and plate tectonic activity, shows that all these changes indicate similar rhythms on million years' timescale in the Cenozoic Era occurring with the common fundamental periodicity of ∼13 Myr during most of the time.

Life

During the Cenozoic, mammals proliferated from a few small, simple, generalized forms into a diverse collection of terrestrial, marine, and flying animals, giving this period its other name, the Age of Mammals. The Cenozoic is just as much the age of savannas, the age of co-dependent flowering plants and insects, and the age of birds. Grass also played a very important role in this era, shaping the evolution of the birds and mammals that fed on it. One group that diversified significantly in the Cenozoic as well were the snakes. Evolving in the Cenozoic, the variety of snakes increased tremendously, resulting in many colubrids, following the evolution of their current primary prey source, the rodents.

In the earlier part of the Cenozoic, the world was dominated by the gastornithid birds, terrestrial crocodiles like Pristichampsus, and a handful of primitive large mammal groups like uintatheres, mesonychids, and pantodonts. But as the forests began to recede and the climate began to cool, other mammals took over.

The Cenozoic is full of mammals both strange and familiar, including chalicotheres, creodonts, whales, primates, entelodonts, saber-toothed cats, mastodons and mammoths, three-toed horses, giant rhinoceros like Indricotherium, the rhinoceros-like brontotheres, various bizarre groups of mammals from South America, such as the vaguely elephant-like pyrotheres and the dog-like marsupial relatives called borhyaenids and the monotremes and marsupials of Australia.

Progressivism's Failures: From Minimum Wages to the Welfare State

  • 15wage
4 hours ago by

As I write, the Democratic Congress is contemplating various measures designed to alleviate poverty levels in the United States. They include: the doubling of the minimum wage; the expansion of child credits. Let’s review both.

The Minimum Wage Hike

Congress intends to raise the federal minimum wage from $7.25 to $15. This makes various assumptions: first, that minimum wage workers themselves are indeed poor. This is wrong: they come from families with a median household income of $66,000; for, their median age is twenty-four years old, and 60 percent are still attending school. Secondly, this policy makes the assumption that it will have no statistically significant impact on unemployment. This is also misguided. The City of Seattle enacted a $13 minimum wage in 2016, resulting in a fall of 9 percent in hours worked among these jobsThe job turnover rate declined by 8 percent, and the city’s less experienced minimum wage workers saw no net increase in payment.

In fact, a separate study found that Seattle’s policy reduced low-wage employment by 6–7 percent, and due to the reduction in employment, workers in this category actually saw a net decline in pay. The third assumption made by this minimum wage hike is that workers will indeed see an increase in inflation-adjusted income. A crucial lesson of economics is that living standards are not determined just by nominal wages, but also the amount which such a wage can consume. Literature suggests that raising the minimum will correspond with an increase in cost of living, due to businesses offsetting higher labor costs, and therefore harm precisely those whom the policy intends to help—low-wage workers. For instance, the average childcare worker in the United States earns $11 an hour—below the threshold Congress intends to set. Therefore, higher labor costs will simply mean an increase in the cost of childcare.

One estimate found that this policy would cause, on average, childcare costs to rise by 21 percent in the United States—that’s an increase of $3,700. Some areas would inevitably be hit harder than others: for instance, the state of Mississippi would see a whopping 43 percent increase in costs. Another essential component of the cost of living is food costs. Many grocery workers work below $15 in the United States: and higher labor costs will simply mean higher inflation in the price of food, which will clearly affect low-wage workers more than high-wage ones. In fact, one study conducted by the University of Zurich found that all the income gains made by workers who had enjoyed a minimum wage increase were simply offset by higher grocery prices. There is more general evidence that raising the minimum wage raises the rate of inflation, therefore negatively impacting those very workers. A study from Canada found that minimum wage hikes can boost the CPI by at least 0.1 percent. Whilst this might not seem statistically significant, the study specified that this small increase caused interest rates to rise, thereby having negative effects on employment. Moreover, an American study (pp.19) estimated that a one third decline in the minimum wage between 1979 and 1995 lowered the CPI by 1 percent (which is of statistical significance).

Raising the minimum wage will harm precisely those it intends to help through higher unemployment and cost of living.

Expanding the Welfare State

Some economists have rosy predictions about Congress’s plan to expand child credits on poverty levels. That being said, in the 1960s, President Lyndon Johnson hoped to end poverty and racial injustice as he initiated the War on Poverty programs. $20 trillion dollars later, the American poverty rate has bounced between 12 percent and 15 percent since those programs began.

A law of the Welfare state can be said to be this: increases in public income transfers will simply be offset by reductions in private earningsThe famous Seattle-Denver Income Maintenance Experiment (SIME/DIME) found that a $1,000 increase in welfare payments is offset by a $660 reduction in private earnings. Thus, low-income families experience only a meagre increase in their standard of living, and are subject to dependency on state welfare spending.

On top of that, welfare spending increases levels of single parenthood. This was a concern early on when Johnson’s welfare programs were initiated, and it was confirmed by a 1993 study that the welfare state was indeed responsible for the rise in single parenthood. The study postulated that a 50 percent increase in welfare spending yields a 43 percent increase in the levels of single parenthood.

I’ve argued in the past that single parenthood and a lack of full-time work are fundamental contributing factors to poverty in the United States, both of which the welfare state reinforces (in fact, the economists Isabelle Sawhill and Ron Haskin famously predicted that if single parenthood were eradicated and full-time work were universal, among other factors, poverty in the United States could be reduced by 70 percent).

Furthermore, the welfare state may negatively impact social mobility. According to research conducted by the economist Raj Chetty, there is a powerful negative correlation between the prevalence of single parenthood across the OECD and the actual levels of upward child mobility in each of those countries. In fact, there even seems to be a connection between the prevalence of single parenthood amongst the US states and poverty levels/social mobility.

Evidence strongly suggests that the welfare state does not alleviate poverty in the United States, and therefore that these poverty projections to support Congress’s proposals are overblown. A groundbreaking study postulated a Laffer curve–like relationship between poverty and welfare spending (where spending will alleviate poverty to an extent, but beyond a certain point will in fact increase poverty). The study argued that public overreach was responsible for the poverty rate being 50 percent higher than without that extra assistance (due to the impoverishing effect of dependency, single parenthood and work disincentives). This statistic ought to worry Congress, and make them think twice about these welfare proposals.

Conclusion

The two policies which are on Congress’s books will not, and never have, succeeded in truly benefitting low-income Americans. To accomplish this aim, they should in fact focus on welfare reform, lowering cost of living through deregulating commodities like housing, energy and childcare, removing labor regulations which exclude poor, inexperienced workers from employment, and thinking twice about inflating the money supply during recessions, which erodes the paychecks of low-income earners.

Inequality (mathematics)

From Wikipedia, the free encyclopedia https://en.wikipedia.org/wiki/Inequality...