Search This Blog

Tuesday, May 25, 2021

Clausius–Clapeyron relation

From Wikipedia, the free encyclopedia
https://en.wikipedia.org/wiki/Clausius%E2%80%93Clapeyron_relation

The Clausius–Clapeyron relation, named after Rudolf Clausius and Benoît Paul Émile Clapeyron, is a way of characterizing a discontinuous phase transition between two phases of matter of a single constituent.

Definition

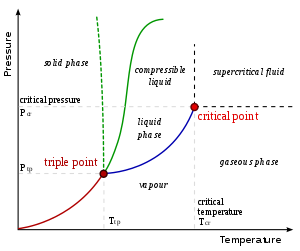
On a pressuretemperature (P–T) diagram, the line separating the two phases is known as the coexistence curve. The Clausius–Clapeyron relation gives the slope of the tangents to this curve. Mathematically,

where is the slope of the tangent to the coexistence curve at any point, is the specific latent heat, is the temperature, is the specific volume change of the phase transition, and is the specific entropy change of the phase transition.

Derivations

A typical phase diagram. The dotted green line gives the anomalous behavior of water. The Clausius–Clapeyron relation can be used to find the relationship between pressure and temperature along phase boundaries.

Derivation from state postulate

Using the state postulate, take the specific entropy for a homogeneous substance to be a function of specific volume and temperature .

The Clausius–Clapeyron relation characterizes behavior of a closed system during a phase change, during which temperature and pressure are constant by definition. Therefore,

Using the appropriate Maxwell relation gives

where is the pressure. Since pressure and temperature are constant, by definition the derivative of pressure with respect to temperature does not change. Therefore, the partial derivative of specific entropy may be changed into a total derivative

and the total derivative of pressure with respect to temperature may be factored out when integrating from an initial phase to a final phase , to obtain

where and are respectively the change in specific entropy and specific volume. Given that a phase change is an internally reversible process, and that our system is closed, the first law of thermodynamics holds

where is the internal energy of the system. Given constant pressure and temperature (during a phase change) and the definition of specific enthalpy , we obtain

Given constant pressure and temperature (during a phase change), we obtain

Substituting the definition of specific latent heat gives

Substituting this result into the pressure derivative given above (), we obtain

This result (also known as the Clapeyron equation) equates the slope of the tangent to the coexistence curve , at any given point on the curve, to the function of the specific latent heat , the temperature , and the change in specific volume .

Derivation from Gibbs–Duhem relation

Suppose two phases, and , are in contact and at equilibrium with each other. Their chemical potentials are related by

Furthermore, along the coexistence curve,

One may therefore use the Gibbs–Duhem relation

(where is the specific entropy, is the specific volume, and is the molar mass) to obtain

Rearrangement gives

from which the derivation of the Clapeyron equation continues as in the previous section.

Ideal gas approximation at low temperatures

When the phase transition of a substance is between a gas phase and a condensed phase (liquid or solid), and occurs at temperatures much lower than the critical temperature of that substance, the specific volume of the gas phase greatly exceeds that of the condensed phase . Therefore, one may approximate

at low temperatures. If pressure is also low, the gas may be approximated by the ideal gas law, so that

where is the pressure, is the specific gas constant, and is the temperature. Substituting into the Clapeyron equation

we can obtain the Clausius–Clapeyron equation

for low temperatures and pressures, where is the specific latent heat of the substance.

Let and be any two points along the coexistence curve between two phases and

In general, varies between any two such points, as a function of temperature. But if is constant,

or


These last equations are useful because they relate equilibrium or saturation vapor pressure and temperature to the latent heat of the phase change, without requiring specific volume data.

Applications

Chemistry and chemical engineering

For transitions between a gas and a condensed phase with the approximations described above, the expression may be rewritten as

where is a constant. For a liquid-gas transition, is the specific latent heat (or specific enthalpy) of vaporization; for a solid-gas transition, is the specific latent heat of sublimation. If the latent heat is known, then knowledge of one point on the coexistence curve determines the rest of the curve. Conversely, the relationship between and is linear, and so linear regression is used to estimate the latent heat.

Meteorology and climatology

Atmospheric water vapor drives many important meteorologic phenomena (notably precipitation), motivating interest in its dynamics. The Clausius–Clapeyron equation for water vapor under typical atmospheric conditions (near standard temperature and pressure) is

where:

The temperature dependence of the latent heat (and of the saturation vapor pressure ) cannot be neglected in this application. Fortunately, the August–Roche–Magnus formula provides a very good approximation:

In the above expression, is in hPa and is in Celsius, whereas everywhere else on this page, is an absolute temperature (e.g. in Kelvin). (This is also sometimes called the Magnus or Magnus–Tetens approximation, though this attribution is historically inaccurate.) But see also this discussion of the accuracy of different approximating formulae for saturation vapour pressure of water.

Under typical atmospheric conditions, the denominator of the exponent depends weakly on (for which the unit is Celsius). Therefore, the August–Roche–Magnus equation implies that saturation water vapor pressure changes approximately exponentially with temperature under typical atmospheric conditions, and hence the water-holding capacity of the atmosphere increases by about 7% for every 1 °C rise in temperature.

Example

One of the uses of this equation is to determine if a phase transition will occur in a given situation. Consider the question of how much pressure is needed to melt ice at a temperature below 0 °C. Note that water is unusual in that its change in volume upon melting is negative. We can assume

and substituting in

(latent heat of fusion for water),
 K (absolute temperature), and
(change in specific volume from solid to liquid),

we obtain

To provide a rough example of how much pressure this is, to melt ice at −7 °C (the temperature many ice skating rinks are set at) would require balancing a small car (mass = 1000 kg) on a thimble (area = 1 cm2).

Second derivative

While the Clausius–Clapeyron relation gives the slope of the coexistence curve, it does not provide any information about its curvature or second derivative. The second derivative of the coexistence curve of phases 1 and 2 is given by 

where subscripts 1 and 2 denote the different phases, is the specific heat capacity at constant pressure, is the thermal expansion coefficient, and is the isothermal compressibility.

Gibbs–Helmholtz equation

From Wikipedia, the free encyclopedia
Jump to navigation Jump to search

The Gibbs–Helmholtz equation is a thermodynamic equation used for calculating changes in the Gibbs energy of a system as a function of temperature. It is named after Josiah Willard Gibbs and Hermann von Helmholtz.

The equation is:

where H is the enthalpy, T the absolute temperature and G the Gibbs free energy of the system, all at constant pressure p. The equation states that the change in the G/T ratio at constant pressure as a result of an infinitesimally small change in temperature is a factor H/T2.

Chemical reactions

The typical applications are to chemical reactions. The equation reads:

with ΔG as the change in Gibbs energy and ΔH as the enthalpy change (considered independent of temperature). The o denotes standard pressure (1 bar).

Integrating with respect to T (again p is constant) it becomes:

This equation quickly enables the calculation of the Gibbs free energy change for a chemical reaction at any temperature T2 with knowledge of just the standard Gibbs free energy change of formation and the standard enthalpy change of formation for the individual components.

Also, using the reaction isotherm equation, that is

which relates the Gibbs energy to a chemical equilibrium constant, the van 't Hoff equation can be derived.

Derivation

Background

The definition of the Gibbs function is

where H is the enthalpy defined by:

Taking differentials of each definition to find dH and dG, then using the fundamental thermodynamic relation (always true for reversible or irreversible processes):

where S is the entropy, V is volume, (minus sign due to reversibility, in which dU = 0: work other than pressure-volume may be done and is equal to −pV) leads to the "reversed" form of the initial fundamental relation into a new master equation:

This is the Gibbs free energy for a closed system. The Gibbs–Helmholtz equation can be derived by this second master equation, and the chain rule for partial derivatives.


Monday, May 24, 2021

Atmospheric thermodynamics

From Wikipedia, the free encyclopedia

Atmospheric thermodynamics is the study of heat-to-work transformations (and their reverse) that take place in the earth's atmosphere and manifest as weather or climate. Atmospheric thermodynamics use the laws of classical thermodynamics, to describe and explain such phenomena as the properties of moist air, the formation of clouds, atmospheric convection, boundary layer meteorology, and vertical instabilities in the atmosphere. Atmospheric thermodynamic diagrams are used as tools in the forecasting of storm development. Atmospheric thermodynamics forms a basis for cloud microphysics and convection parameterizations used in numerical weather models and is used in many climate considerations, including convective-equilibrium climate models.

Overview

The atmosphere is an example of a non-equilibrium system. Atmospheric thermodynamics describes the effect of buoyant forces that cause the rise of less dense (warmer) air, the descent of more dense air, and the transformation of water from liquid to vapor (evaporation) and its condensation. Those dynamics are modified by the force of the pressure gradient and that motion is modified by the Coriolis force. The tools used include the law of energy conservation, the ideal gas law, specific heat capacities, the assumption of isentropic processes (in which entropy is a constant), and moist adiabatic processes (during which no energy is transferred as heat). Most of tropospheric gases are treated as ideal gases and water vapor, with its ability to change phase from vapor, to liquid, to solid, and back is considered as one of the most important trace components of air.

Advanced topics are phase transitions of water, homogeneous and in-homogeneous nucleation, effect of dissolved substances on cloud condensation, role of supersaturation on formation of ice crystals and cloud droplets. Considerations of moist air and cloud theories typically involve various temperatures, such as equivalent potential temperature, wet-bulb and virtual temperatures. Connected areas are energy, momentum, and mass transfer, turbulence interaction between air particles in clouds, convection, dynamics of tropical cyclones, and large scale dynamics of the atmosphere.

The major role of atmospheric thermodynamics is expressed in terms of adiabatic and diabatic forces acting on air parcels included in primitive equations of air motion either as grid resolved or subgrid parameterizations. These equations form a basis for the numerical weather and climate predictions.

History

In the early 19th century thermodynamicists such as Sadi Carnot, Rudolf Clausius, and Émile Clapeyron developed mathematical models on the dynamics of fluid bodies and vapors related to the combustion and pressure cycles of atmospheric steam engines; one example is the Clausius–Clapeyron equation. In 1873, thermodynamicist Willard Gibbs published "Graphical Methods in the Thermodynamics of Fluids."

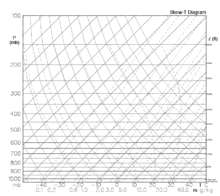
Thermodynamic diagram developed in the 19th century is still used to calculate quantities such as convective available potential energy or air stability.

These sorts of foundations naturally began to be applied towards the development of theoretical models of atmospheric thermodynamics which drew the attention of the best minds. Papers on atmospheric thermodynamics appeared in the 1860s that treated such topics as dry and moist adiabatic processes. In 1884 Heinrich Hertz devised first atmospheric thermodynamic diagram (emagram). Pseudo-adiabatic process was coined by von Bezold describing air as it is lifted, expands, cools, and eventually precipitates its water vapor; in 1888 he published voluminous work entitled "On the thermodynamics of the atmosphere".

In 1911 von Alfred Wegener published a book "Thermodynamik der Atmosphäre", Leipzig, J. A. Barth. From here the development of atmospheric thermodynamics as a branch of science began to take root. The term "atmospheric thermodynamics", itself, can be traced to Frank W. Verys 1919 publication: "The radiant properties of the earth from the standpoint of atmospheric thermodynamics" (Occasional scientific papers of the Westwood Astrophysical Observatory). By the late 1970s various textbooks on the subject began to appear. Today, atmospheric thermodynamics is an integral part of weather forecasting.

Chronology

  • 1751 Charles Le Roy recognized dew point temperature as point of saturation of air
  • 1782 Jacques Charles made hydrogen balloon flight measuring temperature and pressure in Paris
  • 1784 Concept of variation of temperature with height was suggested
  • 1801–1803 John Dalton developed his laws of pressures of vapours
  • 1804 Joseph Louis Gay-Lussac made balloon ascent to study weather
  • 1805 Pierre Simon Laplace developed his law of pressure variation with height
  • 1841 James Pollard Espy publishes paper on convection theory of cyclone energy
  • 1856 William Ferrel presents dynamics causing westerlies
  • 1889 Hermann von Helmholtz and John William von Bezold used the concept of potential temperature, von Bezold used adiabatic lapse rate and pseudoadiabat
  • 1893 Richard Asman constructs first aerological sonde (pressure-temperature-humidity)
  • 1894 John Wilhelm von Bezold used concept of equivalent temperature
  • 1926 Sir Napier Shaw introduced tephigram
  • 1933 Tor Bergeron published paper on "Physics of Clouds and Precipitation" describing precipitation from supercooled (due to condensational growth of ice crystals in presence of water drops)
  • 1946 Vincent J. Schaeffer and Irving Langmuir performed the first cloud-seeding experiment
  • 1986 K. Emanuel conceptualizes tropical cyclone as Carnot heat engine

Applications

Hadley Circulation

The Hadley Circulation can be considered as a heat engine. The Hadley circulation is identified with rising of warm and moist air in the equatorial region with the descent of colder air in the subtropics corresponding to a thermally driven direct circulation, with consequent net production of kinetic energy. The thermodynamic efficiency of the Hadley system, considered as a heat engine, has been relatively constant over the 1979~2010 period, averaging 2.6%. Over the same interval, the power generated by the Hadley regime has risen at an average rate of about 0.54 TW per yr; this reflects an increase in energy input to the system consistent with the observed trend in the tropical sea surface temperatures.

Tropical cyclone Carnot cycle

Air is being moistened as it travels toward convective system. Ascending motion in a deep convective core produces air expansion, cooling, and condensation. Upper level outflow visible as an anvil cloud is eventually descending conserving mass (rysunek – Robert Simmon).

The thermodynamic behavior of a hurricane can be modelled as a heat engine that operates between the heat reservoir of the sea at a temperature of about 300K (27 °C) and the heat sink of the tropopause at a temperature of about 200K (−72 °C) and in the process converts heat energy into mechanical energy of winds. Parcels of air traveling close to the sea surface take up heat and water vapor, the warmed air rises and expands and cools as it does so causes condensation and precipitation. The rising air, and condensation, produces circulatory winds that are propelled by the Coriolis force, which whip up waves and increase the amount of warm moist air that powers the cyclone. Both a decreasing temperature in the upper troposphere or an increasing temperature of the atmosphere close to the surface will increase the maximum winds observed in hurricanes. When applied to hurricane dynamics it defines a Carnot heat engine cycle and predicts maximum hurricane intensity.

Water vapor and global climate change

The Clausius–Clapeyron relation shows how the water-holding capacity of the atmosphere increases by about 8% per Celsius increase in temperature. (It does not directly depend on other parameters like the pressure or density.) This water-holding capacity, or "equilibrium vapor pressure", can be approximated using the August-Roche-Magnus formula

(where is the equilibrium or saturation vapor pressure in hPa, and is temperature in degrees Celsius). This shows that when atmospheric temperature increases (e.g., due to greenhouse gases) the absolute humidity should also increase exponentially (assuming a constant relative humidity). However, this purely thermodynamic argument is subject of considerable debate because convective processes might cause extensive drying due to increased areas of subsidence, efficiency of precipitation could be influenced by the intensity of convection, and because cloud formation is related to relative humidity.


Inequality (mathematics)

From Wikipedia, the free encyclopedia https://en.wikipedia.org/wiki/Inequality...