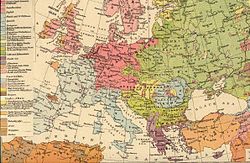
Europeans are the focus of European ethnology, the field of anthropology related to the various indigenous groups that reside in the states of Europe. Groups may be defined by common genetic ancestry, common language, or both. Pan and Pfeil (2004) count 87 distinct "peoples of Europe", of which 33 form the majority population in at least one sovereign state, while the remaining 54 constitute ethnic minorities. The total number of national minority populations in Europe is estimated at 105 million people, or 14% of 770 million Europeans. The Russians are the most populous among Europeans, with a population over 134 million. There are no universally accepted and precise definitions of the terms "ethnic group" and "nationality". In the context of European ethnography in particular, the terms ethnic group, people, nationality and ethno-linguistic group, are used as mostly synonymous, although preference may vary in usage with respect to the situation specific to the individual countries of Europe.
Overview
About 20–25 million residents (3%) are members of diasporas of non-European origin. The population of the European Union, with some 450 million residents, accounts for two thirds of the current European population.
Both Spain and the United Kingdom are special cases, in that the designation of nationality, Spanish and British, may controversially take ethnic aspects, subsuming various regional ethnic groups (see nationalisms and regionalisms of Spain and native populations of the United Kingdom). Switzerland is a similar case, but the linguistic subgroups of the Swiss are discussed in terms of both ethnicity and language affiliations.
Linguistic classifications
Of the total population of Europe of some 740 million (as of 2010), close to 90% (or some 650 million) fall within three large branches of Indo-European languages, these being;
- Romance, including Aromanian, Arpitan, Catalan, Corsican, French and other Langues d'oïl, Friulian, Galician, Istro-Romanian, Italian, Ladino, Megleno-Romanian, Occitan, Portuguese, Romanian, Romansh, Sardinian and Spanish.
- Germanic, including Danish, Dutch, English, Faroese, Frisian, German, Icelandic, Limburgish, Low Saxon, Luxembourgish, Norwegian, Scots, Swedish, and Yiddish. Afrikaans, a daughter language of Dutch, is spoken by some South African and Namibian migrant populations.
- Slavic, including Belarusian, Bulgarian, Czech, Kashubian, Macedonian, Polish, Russian, Rusyn, Serbo-Croatian, Slovak, Slovenian, Sorbian and Ukrainian.
Three stand-alone Indo-European languages do not fall within larger sub-groups and are not closely related to those larger language families;
In addition, there are also smaller sub-groups within the Indo-European languages of Europe, including;
- Baltic, including Latvian, Lithuanian, Samogitian and Latgalian.
- Celtic languages, including Breton, Cornish, Irish, Manx, Welsh, and Scottish Gaelic.
- Iranic, mainly Ossetian in the Caucasus, as well as Kurdish in Anatolia.
- Indo-Aryan is represented by the Romani language spoken by Roma people of eastern Europe, and is at root related to the Indo-Aryan languages of the Indian subcontinent.
Besides the Indo-European languages, there are other language families on the European continent which are considered unrelated to Indo-European:
- Uralic languages, including Estonian, Finnish, Hungarian, Komi, Livonian, Mari, Mordvin, Sámi, Samoyedic, and Udmurt.
- Turkic languages, including Azeri, Bashkir, Chuvash, Gagauz, Kazakh, Nogai, Tatar, and Turkish.
- Semitic languages, including: Assyrian Neo-Aramaic (spoken in parts of eastern Turkey and the Caucasus by Assyrian Christians), Hebrew (spoken by some Jewish populations), and Maltese. Arabic is spoken by some migrant communities from the Middle East and North Africa.
- Kartvelian languages (also known as South Caucasian languages), including Georgian, Laz, Mingrelian, Svan, and Zan.
- Northwest Caucasian languages, including Abkhaz, Abaza, Adyghe, Circassian, Kabardian, and Ubykh.
- Northeast Caucasian languages, including Avar, Chechen, Dargin, Ingush, Lak, and Lezgian.
- Language isolates: Basque, spoken in the Basque regions of Spain and France, is an isolate language, the only one in Europe, and is believed to be unrelated to any other language, living or extinct.
- Mongolic languages exist in the form of Kalmyk, spoken in the Caucasus region of Russia.
History
Prehistoric populations
The Basques have been found to descend from the population of the late Neolithic or early Bronze Age directly. By contrast, Indo-European groups of Europe (the Centum, Balto-Slavic, and Albanian groups) migrated throughout most of Europe from the Pontic steppe. They are assumed to have developed in situ through admixture of earlier Mesolithic and Neolithic populations with Bronze Age, proto-Indo-Europeans. The Finnic peoples are assumed to also be descended from Proto-Uralic populations further to the east, nearer to the Ural Mountains, that had migrated to their historical homelands in Europe by about 3,000 years ago. A more recent study in 2019 found that proto-Uralic may have originated further East in Siberia among an East Asian-related populations. The authors link the arrival of Uralic languages to the arrival of Siberian-like ancestry to the Baltic region.
Reconstructed languages of Iron Age Europe include Proto-Celtic, Proto-Italic and Proto-Germanic, all of these Indo-European languages of the centum group, and Proto-Slavic and Proto-Baltic, of the satem group. A group of Tyrrhenian languages appears to have included Etruscan, Rhaetian, Lemnian, and perhaps Camunic. A pre-Roman stage of Proto-Basque can only be reconstructed with great uncertainty.
Regarding the European Bronze Age, the only relatively likely reconstruction is that of Proto-Greek (ca. 2000 BC). A Proto-Italo-Celtic ancestor of both Italic and Celtic (assumed for the Bell beaker period), and a Proto-Balto-Slavic language (assumed for roughly the Corded Ware horizon) has been postulated with less confidence. Old European hydronymy has been taken as indicating an early (Bronze Age) Indo-European predecessor of the later centum languages.
According to geneticist David Reich, based on ancient human genomes that his laboratory sequenced in 2016, Europeans descend from a mixture of four distinct ancestral components.
Historical populations
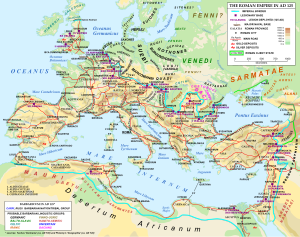
Iron Age (pre-Great Migrations) populations of Europe known from Greco-Roman historiography, notably Herodotus, Pliny, Ptolemy and Tacitus:
- Aegean: the Greek tribes, Pelasgians, and Anatolians.
- Balkans: the Illyrians (List of ancient tribes in Illyria), Dacians, and Thracians.
- Italian peninsula: the Camunni, Rhaetians, Lepontii, Adriatic Veneti, Gauls, Ligurians, Etruscans, Italic peoples and Greek and Phoenician colonies in its neighboring Italian islands.
- Western/Central Europe: the Celts (list of peoples of Gaul, List of Celtic tribes), Rhaetians and Swabians, Vistula Veneti, Lugii and Balts.
- Iberian peninsula: the Pre-Roman peoples of the Iberian Peninsula (Iberians, Celts, Celtiberians, Lusitani, Basques, Aquitani, Turdetani, Occitans) and Greek and Phoenician coastal Mediterranean colonies.
- Sardinia and Corsica: the ancient Sardinians and Corsicans (also known as Nuragic and Torrean peoples), comprising the Corsi, Balares, Ilienses tribes and Phoenician colonies.
- British Isles: the Celtic tribes in Britain and Ireland and Picts/Priteni.
- Northern Europe: the Baltic Finns, Germanic peoples (list of Germanic peoples) and Normans.
- Sicily: the Italic Sicels and Morgetes, the Sicani, Elymians and Greek and Phoenician colonies.
- Eastern Europe: the Veneti (Early Slavs), Scythians and Sarmatians.
- Armenian Highlands/Anatolia: the Armenians.
Historical immigration
Ethno-linguistic groups that arrived from outside Europe during historical times are:
- Phoenician colonies in the Mediterranean (including regions in Spain, Malta, Sicily, Sardinia, Cyprus and the Aegean), from about 1200 BC to the fall of Carthage after the Third Punic War in 146 BC.
- Assyrian conquest of Cyprus, Southern Caucasus (including parts of modern Armenia, Georgia and Azerbaijan) and Cilicia during the Neo-Assyrian Empire (911–605 BC).
- Iranian influence: Achaemenid control of Thrace (512–343 BC) and the Bosporan Kingdom, Cimmerians (possible Iranians), Scythians, Sarmatians, Alans, Ossetes.
- The Jewish diaspora reached Europe in the Roman Empire period, the Jewish community in Italy dating to around AD 70 and records of Jews settling Central Europe (Gaul) from the 5th century (see History of the Jews in Europe).
- The Hunnic Empire (5th century AD), converged with the Barbarian invasions, contributing to the formation of the First Bulgarian Empire.
- The Slavic migrations (6th century AD), and the subsequent split into Eastern Slavs, Western Slavs and Southern Slavs.
- Avar Khaganate (c.560s–800).
- The Bulgars (or Proto-Bulgarians), a semi-nomadic people, originally from Central Asia, eventually absorbed by the Slavs.
- The Magyars (Hungarians), an Uralic-speaking people, and the Turkic Pechenegs and Khazars, arrived in Europe in about the 8th century (see Hungarian conquest of the Carpathian Basin).
- The Arabs conquered Cyprus, Crete, Sicily (establishing the Emirate of Sicily in 831, from which they would be expelled in 1224), some places along the coast of southern Italy, Malta, Greek Empire and most of Iberia (founding a polity known as Al-Andalus in 711, ruled also by Berber dynasties of the Almoravides and the Almohads, from whose domain they would be expelled in 1492).
- Exodus of Maghreb Christians.
- The western Kipchaks known as Cumans entered the lands of present-day Ukraine in the 11th century.
- The Mongol/Tatar invasions (1223–1480), and Ottoman control of the Balkans (1389–1878). These medieval incursions account for the presence of European Turks and Tatars.
- The Romani people arrived during the Late Middle Ages.
- The Mongol Kalmyks arrived in Kalmykia in the 17th century.
History of European ethnography
The earliest accounts of European ethnography date from Classical Antiquity. Herodotus described the Scythians and Thraco-Illyrians. Dicaearchus gave a description of Greece itself, besides accounts of western and northern Europe. His work survives only fragmentarily, but was received by Polybius and others.
Roman Empire period authors include Diodorus Siculus, Strabo and Tacitus. Julius Caesar gives an account of the Celtic tribes of Gaul, while Tacitus describes the Germanic tribes of Magna Germania. A number of authors like Diodorus Siculus, Pausanias and Sallust depict the ancient Sardinian and Corsican peoples.
The 4th century Tabula Peutingeriana records the names of numerous peoples and tribes. Ethnographers of Late Antiquity such as Agathias of Myrina Ammianus Marcellinus, Jordanes and Theophylact Simocatta give early accounts of the Slavs, the Franks, the Alamanni and the Goths.
Book IX of Isidore's Etymologiae (7th century) treats de linguis, gentibus, regnis, militia, civibus (concerning languages, peoples, realms, war and cities). Ahmad ibn Fadlan in the 10th century gives an account of the Bolghar and the Rus' peoples. William Rubruck, while most notable for his account of the Mongols, in his account of his journey to Asia also gives accounts of the Tatars and the Alans. Saxo Grammaticus and Adam of Bremen give an account of pre-Christian Scandinavia. The Chronicon Slavorum (12th century) gives an account of the northwestern Slavic tribes.
Gottfried Hensel in his 1741 Synopsis Universae Philologiae published one of the earliest ethno-linguistic map of Europe, showing the beginning of the pater noster in the various European languages and scripts. In the 19th century, ethnicity was discussed in terms of scientific racism, and the ethnic groups of Europe were grouped into a number of "races", Mediterranean, Alpine and Nordic, all part of a larger "Caucasian" group.
The beginnings of ethnic geography as an academic subdiscipline lie in the period following World War I, in the context of nationalism, and in the 1930s exploitation for the purposes of fascist and Nazi propaganda, so that it was only in the 1960s that ethnic geography began to thrive as a bona fide academic subdiscipline.
The origins of modern ethnography are often traced to the work of Bronisław Malinowski, who emphasized the importance of fieldwork. The emergence of population genetics further undermined the categorisation of Europeans into clearly defined racial groups. A 2007 study on the genetic history of Europe found that the most important genetic differentiation in Europe occurs on a line from the north to the south-east (northern Europe to the Balkans), with another east–west axis of differentiation across Europe, separating the indigenous Basques, Sardinians and Sami from other European populations. Despite these stratifications it noted the unusually high degree of European homogeneity: "there is low apparent diversity in Europe with the entire continent-wide samples only marginally more dispersed than single population samples elsewhere in the world."
Minorities
The total number of national minority populations in Europe is estimated at 105 million people, or 14% of Europeans.
The member states of the Council of Europe in 1995 signed the Framework Convention for the Protection of National Minorities. The broad aims of the Convention are to ensure that the signatory states respect the rights of national minorities, undertaking to combat discrimination, promote equality, preserve and develop the culture and identity of national minorities, guarantee certain freedoms in relation to access to the media, minority languages and education and encourage the participation of national minorities in public life. The Framework Convention for the Protection of National Minorities defines a national minority implicitly to include minorities possessing a territorial identity and a distinct cultural heritage. By 2008, 39 member states had signed and ratified the Convention, with the notable exception of France.
Indigenous minorities
Various European ethnic groups have lived there for millennia, however, the UN recognizes very few indigenous populations of Europe, which are confined to the far north and far east of the continent.
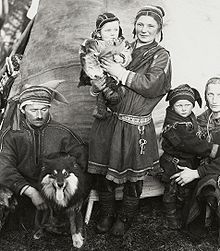
Notable indigenous minority populations in Europe that are recognized by the UN include the Uralic Nenets, Samoyed, and Komi peoples of northern Russia; Circassians of southern Russia and the North Caucasus; Crimean Tatars, Krymchaks and Crimean Karaites of Crimea in Ukraine; Sámi peoples of northern Norway, Sweden, and Finland and northwestern Russia (in an area also referred to as Sápmi); Basques of Basque Country, Spain and southern France; and the Sorbian people of Germany and Poland.
Non-indigenous minorities
Many non-European ethnic groups and nationalities have migrated to Europe over the centuries. Some arrived centuries ago. However, the vast majority arrived more recently, mostly in the 20th and 21st centuries. Often, they come from former colonies of the British, Dutch, French, Portuguese and Spanish empires.
- Western Asians
- Turks: There were 10 million Turks living in Western Europe and the Balkans in 1997 (excluding Northern Cyprus and Turkey). By 2010 there was up to 15 million Turks living in the European Union (i.e. excluding Turkish communities in Turkey as well as several Balkan countries and former USSR countries which are not in the EU). According to Dr Araks Pashayan 10 million "Euro-Turks" alone were living in Germany, France, the Netherlands and Belgium in 2012. In addition, there is 500,000 Turks in the UK (2011 estimate), 500,000 in Austria (2011 estimate) 150,000 in Sweden, 120,000 in Switzerland, 70,000 in Denmark (2008 estimate), as well as growing communities in Italy, Lichtenstein, Finland and Spain. In addition, over one million Turks were living in the Balkans in 2019 (especially in Bulgaria, Greece, Kosovo, North Macedonia and Romania), and approximately 400,000 Meskhetian Turks were living in the Eastern European regions of the Post-Soviet states (i.e. Azerbaijan, Georgia, Kazakhstan, Russia and Ukraine) in 2014.
- Jews: approx. 2.0 million, mostly in France, the UK, Russia and Germany. They are descended from the Israelites of the Middle East (Southwest Asia), originating from the historical kingdoms of Israel and Judah.
- Ashkenazi Jews: approx. 1.4 million, mostly in the United Kingdom, France, Russia, Germany and Ukraine. They are believed by scholars to have arrived from Israel via southern Europe in the Roman era and settled in France and Germany towards the end of the first millennium. The Nazi Holocaust wiped out the vast majority during World War II and forced most to flee, with many of them going to Israel.
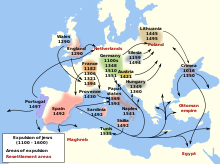
- Sephardi Jews: approx. 0.3 million, mostly in France. They arrived via Spain and Portugal in the pre-Roman and Roman eras, and were forcibly converted or expelled in the 15th and 16th centuries.
- Mizrahi Jews: approx. 0.3 million, mostly in France, via Islamic-majority countries of the Middle East.
- Italqim: approx. 50,000, mostly in Italy, since the 2nd century BC.
- Romaniotes: approx. 6,000, mostly in Greece, with communities dating at least from the 1st century AD.
- Crimean Karaites (Karaim): less than 4,000, mostly in Ukraine, Poland and Lithuania. They arrived in Crimea in the Middle Ages.
- Assyrians: mostly in Sweden and Germany, as well as in Russia, Armenia, Denmark and Great Britain (see Assyrian diaspora). Assyrians have been present in Eastern Turkey since the Bronze Age (circa 2000 BCE).
- Kurds: approx. 2.5 million, mostly in the UK, Germany, Sweden and Turkey.
- Iraqi diaspora: mostly in the UK, Germany and Sweden, and can be of varying ethnic origin, including Arabs, Assyrians, Kurds, Armenians, Shabaks, Mandeans, Turks, Kawliya and Yezidis.
- Lebanese diaspora: especially in France, Netherlands, Germany, Cyprus and the UK.
- Syrian diaspora: Largest number of Syrians live in Germany, the Netherlands and Sweden and can be of varying ethnic origin, including; Arabs, Assyrians, Kurds, Armenians, Arameans, Turks, Mhallami and Yezidis.
- Africans
- North Africans (North African Arabs, Egyptian Copts, and Berbers): approx. 5 million, mostly in France, Spain, Italy, the Netherlands and Sweden. The bulk of North African migrants are Moroccans, although France also has a large number of Algerians, and others may be from Egypt (including Copts), Libya and Tunisia.
- Horn Africans (Somalis, Ethiopians, Eritreans, Djiboutians, and the Northern Sudanese): approx. 700,000, mostly in Scandinavia, the UK, the Netherlands, Germany, Switzerland, Austria, Finland, and Italy. Majority arrived to Europe as refugees. Proportionally few live in Italy despite former colonial ties, most live in the Nordic countries.
- Sub-Saharan Africans (many ethnicities including Afro-Caribbeans, African-Americans, Afro-Latinos and others by descent): approx. 5 million, mostly in the UK and France, with smaller numbers in the Netherlands, Germany, Italy, Spain, Portugal and elsewhere.
- Latin Americans: approx. 2.2 million, mainly in Spain and to a lesser extent Italy and the UK. See also Latin American Britons (80,000 Latin American born in 2001).
- Brazilians: around 70,000 in Portugal and Italy each, and 50,000 in Germany (mainly German-Brazilians).
- Chilean refugees escaping the Augusto Pinochet regime of the 1970s formed communities in France, Sweden, the UK, former East Germany and the Netherlands.
- Mexicans: about 21,000 in Spain and 14,000 in Germany
- Venezuelans: around 520,000 mostly in Spain (200,000), Portugal (100,000), France (30,000), Germany (20,000), UK (15,000), Ireland (5,000), Italy (5,000) and the Netherlands (1,000).
- South Asians: approx. 3–4 million, mostly in the UK but reside in smaller numbers in Germany and France.
- Romani (Gypsies): approx. 4 or 10 million (although estimates vary widely), dispersed throughout Europe but with large numbers concentrated in the Balkans area, they are of ancestral South Asian and European descent, originating from the northern regions of the Indian subcontinent.
- Indians: approx. 2 million, mostly in the UK, also in Italy, in Germany and smaller numbers in Ireland.
- Pakistanis: approx. 1,000,000, mostly in the UK and in Italy, but also in Norway and Sweden.
- Bangladeshi residing in Europe estimated at over 500,000, mostly in the UK and in Italy.
- Sri Lankans: approx. 200,000, mainly in the UK and in Italy.
- Nepalese: approx. 50,000 in the UK.
- Afghans, about 100,000 to 200,000, most happen to live in the UK, but Germany and Sweden are destinations for Afghan immigrants since the 1960s.
- Southeast Asians
- Filipinos: above 1 million, mostly in Italy, the UK, France, Germany, and Spain.
- Others of multiple nationalities, ca. total 1 million, such as Indonesians in the Netherlands, Thais in the UK and Sweden, Vietnamese in France and former East Germany, and Cambodians in France, together with Burmese, Malaysian, Singaporean, Timorese and Laotian migrants. See also Vietnamese people in the Czech Republic.
- East Asians
- Chinese: approx. 1.7 million, mostly in France, Russia, the UK, Spain, Italy and the Netherlands.
- Japanese: mostly in the UK and a sizable community in Düsseldorf, Germany.
- Koreans: 100,000 estimated (excludes a possible 100,000 more in Russia), mainly in the UK, France and Germany. See also Koryo-saram.
- Mongolians in Germany.
- North Americans
- U.S. and Canadian expatriates: American British and Canadian British, Canadiens and Acadians in France, as well as Americans/Canadians of European ancestry residing elsewhere in Europe.
- African Americans (i.e. African American British) who are Americans of black/African ancestry reside in other countries. In the 1920s, African-American entertainers established a colony in Paris (African American French) and descendants of World War II/Cold War-era black American soldiers stationed in France, Germany and Italy are well known.
- U.S. and Canadian expatriates: American British and Canadian British, Canadiens and Acadians in France, as well as Americans/Canadians of European ancestry residing elsewhere in Europe.
- Others
- European diaspora – Australians, New Zealanders, South Africans (mostly White South Africans of Afrikaner and British descent), and white Namibians, Zimbabweans, Kenyans, Malawians and Zambians mainly in the UK, together with white Angolans and Mozambicans, mainly of Portuguese descent.
- Pacific Islanders: A small population of Tahitians of Polynesian origin in mainland France, Fijians in the United Kingdom from Fiji and Māori in the United Kingdom of the Māori people of New Zealand, a small number of Tongans and Samoans, also in the United Kingdom.
- Amerindians and Inuit, a scant few in the European continent of American Indian ancestry (often Latin Americans in Spain, France and the UK; Inuit in Denmark), but most may be children or grandchildren of U.S. soldiers from American Indian tribes by intermarriage with local European women.
European identity
Historical
Medieval notions of a relation of the peoples of Europe are expressed in terms of genealogy of mythical founders of the individual groups. The Europeans were considered the descendants of Japheth from early times, corresponding to the division of the known world into three continents, the descendants of Shem peopling Asia and those of Ham peopling Africa. Identification of Europeans as "Japhetites" is also reflected in early suggestions for terming the Indo-European languages "Japhetic".
In this tradition, the Historia Brittonum (9th century) introduces a genealogy of the peoples of the Migration Period based on the sixth-century Frankish Table of Nations as follows,
- The first man that dwelt in Europe was Alanus, with his three sons, Hisicion, Armenon, and Neugio. Hisicion had four sons, Francus, Romanus, Alamanus, and Bruttus. Armenon had five sons, Gothus, Valagothus, Cibidus, Burgundus, and Longobardus. Neugio had three sons, Vandalus, Saxo, and Boganus.
- From Hisicion arose four nations—the Franks, the Latins, the Germans, and Britons; from Armenon, the Gothi, Valagothi, Cibidi, Burgundi, and Longobardi; from Neugio, the Bogari, Vandali, Saxones, and Tarincgi. The whole of Europe was subdivided into these tribes.[60]
The text goes then on to list the genealogy of Alanus, connecting him to Japheth via eighteen generations.
European culture
European culture is largely rooted in what is often referred to as its "common cultural heritage". Due to the great number of perspectives which can be taken on the subject, it is impossible to form a single, all-embracing conception of European culture. Nonetheless, there are core elements which are generally agreed upon as forming the cultural foundation of modern Europe. One list of these elements given by K. Bochmann includes:
- A common cultural and spiritual heritage derived from Greco-Roman antiquity, Christianity, the Renaissance and its Humanism, the political thinking of the Enlightenment, and the French Revolution, and the developments of Modernity, including all types of socialism;
- A rich and dynamic material culture that has been extended to the other continents as the result of industrialization and colonialism during the "Great Divergence";
- A specific conception of the individual expressed by the existence of, and respect for, a legality that guarantees human rights and the liberty of the individual;
- A plurality of states with different political orders, which are condemned to live together in one way or another;
- Respect for peoples, states and nations outside Europe.
Berting says that these points fit with "Europe's most positive realisations". The concept of European culture is generally linked to the classical definition of the Western world. In this definition, Western culture is the set of literary, scientific, political, artistic and philosophical principles which set it apart from other civilizations. Much of this set of traditions and knowledge is collected in the Western canon. The term has come to apply to countries whose history has been strongly marked by European immigration or settlement during the 18th and 19th centuries, such as the Americas, and Australasia, and is not restricted to Europe.
Religion
Since the High Middle Ages, most of Europe has been dominated by Christianity. There are three major denominations: Roman Catholic, Protestant and Eastern Orthodox, with Protestantism restricted mostly to Northern Europe, and Orthodoxy to East and South Slavic regions, Romania, Moldova, Greece, and Georgia. The Armenian Apostolic Church, part of the Oriental Church, is also in Europe – another branch of Christianity (world's oldest National Church). Catholicism, while typically centered in Western Europe, also has a very significant following in Central Europe (especially among the Germanic, Western Slavic and Hungarian peoples/regions) as well as in Ireland (with some in Great Britain).
Christianity has been the dominant religion shaping European culture for at least the last 1700 years. Modern philosophical thought has very much been influenced by Christian philosophers such as St Thomas Aquinas and Erasmus. And throughout most of its history, Europe has been nearly equivalent to Christian culture, The Christian culture was the predominant force in western civilization, guiding the course of philosophy, art, and science. The notion of "Europe" and the "Western World" has been intimately connected with the concept of "Christianity and Christendom" many even attribute Christianity for being the link that created a unified European identity.
Christianity is still the largest religion in Europe; according to a 2011 survey, 76.2% of Europeans considered themselves Christians. Also according to a study on Religiosity in the European Union in 2012, by Eurobarometer, Christianity is the largest religion in the European Union, accounting for 72% of the EU's population. As of 2010 Catholics were the largest Christian group in Europe, accounting for more than 48% of European Christians. The second-largest Christian group in Europe were the Orthodox, who made up 32% of European Christians. About 19% of European Christians were part of the Protestant tradition. Russia is the largest Christian country in Europe by population, followed by Germany and Italy.
Islam has some tradition in the Balkans and the Caucasus due to conquest and colonization from the Ottoman Empire in the 16th to 19th centuries, as well as earlier though discontinued long-term presence in much of Iberia as well as Sicily. Muslims account for the majority of the populations in Albania, Azerbaijan, Kosovo, Northern Cyprus (controlled by Turks), and Bosnia and Herzegovina. Significant minorities are present in the rest of Europe. Russia also has one of the largest Muslim communities in Europe, including the Tatars of the Middle Volga and multiple groups in the Caucasus, including Chechens, Avars, Ingush and others. With 20th-century migrations, Muslims in Western Europe have become a noticeable minority. According to the Pew Forum, the total number of Muslims in Europe in 2010 was about 44 million (6%), while the total number of Muslims in the European Union in 2007 was about 16 million (3.2%).
Judaism has a long history in Europe, but is a small minority religion, with France (1%) the only European country with a Jewish population in excess of 0.5%. The Jewish population of Europe is composed primarily of two groups, the Ashkenazi and the Sephardi. Ancestors of Ashkenazi Jews likely migrated to Central Europe at least as early as the 8th century, while Sephardi Jews established themselves in Spain and Portugal at least one thousand years before that. Jews originated in the Levant where they resided for thousands of years until the 2nd century AD, when they spread around the Mediterranean and into Europe, although small communities were known to exist in Greece as well as the Balkans since at least the 1st century BC. Jewish history was notably affected by the Holocaust and emigration (including Aliyah, as well as emigration to America) in the 20th century. The Jewish population of Europe in 2010 was estimated to be approximately 1.4 million (0.2% of European population) or 10% of the world's Jewish population. In the 21st century, France has the largest Jewish population in Europe, followed by the United Kingdom, Germany, Russia and Ukraine.
In modern times, significant secularization since the 20th century, notably in secularist France, Estonia and the Czech Republic. Currently, distribution of theism in Europe is very heterogeneous, with more than 95% in Poland, and less than 20% in the Czech Republic and Estonia. The 2005 Eurobarometer poll found that 52% of EU citizens believe in God. According to a Pew Research Center Survey in 2012 the Religiously Unaffiliated (Atheists and Agnostics) make up about 18.2% of the European population in 2010. According to the same Survey the Religiously Unaffiliated make up the majority of the population in only two European countries: Czech Republic (76%) and Estonia (60%).
Pan-European identity
"Pan-European identity" or "Europatriotism" is an emerging sense of personal identification with Europe, or the European Union as a result of the gradual process of European integration taking place over the last quarter of the 20th century, and especially in the period after the end of the Cold War, since the 1990s. The foundation of the OSCE following the 1990s Paris Charter has facilitated this process on a political level during the 1990s and 2000s.
From the later 20th century, 'Europe' has come to be widely used as a synonym for the European Union even though there are millions of people living on the European continent in non-EU member states. The prefix pan implies that the identity applies throughout Europe, and especially in an EU context, and 'pan-European' is often contrasted with national identity.


