Search This Blog

Friday, July 1, 2022

Exoplanet orbital and physical parameters

From Wikipedia, the free encyclopedia

Most known extrasolar planet candidates have been discovered using indirect methods and therefore only some of their physical and orbital parameters can be determined. For example, out of the six independent parameters that define an orbit, the radial-velocity method can determine four: semi-major axis, eccentricity, longitude of periastron, and time of periastron. Two parameters remain unknown: inclination and longitude of the ascending node.

Distance from star and orbital period

Log-log scatterplot showing masses, orbital radii, and period of all extrasolar planets discovered through September 2014, with colors indicating method of detection
Log-log scatterplot showing masses, orbital radii, and period of all extrasolar planets discovered through September 2014, with colors indicating method of detection:
  timing
For reference, Solar System planets are marked as gray circles. The horizontal axis plots the logarithm of the semi-major axis, and the vertical axis plots the logarithm of the mass.

There are exoplanets that are much closer to their parent star than any planet in the Solar System is to the Sun, and there are also exoplanets that are much further from their star. Mercury, the closest planet to the Sun at 0.4 astronomical units (AU), takes 88 days for an orbit, but the smallest known orbits of exoplanets have orbital periods of only a few hours, see Ultra-short period planet. The Kepler-11 system has five of its planets in smaller orbits than Mercury's. Neptune is 30 AU from the Sun and takes 165 years to orbit it, but there are exoplanets that are thousands of AU from their star and take tens of thousands of years to orbit, e.g. GU Piscium b.

The radial-velocity and transit methods are most sensitive to planets with small orbits. The earliest discoveries such as 51 Peg b were gas giants with orbits of a few days. These "hot Jupiters" likely formed further out and migrated inwards.

The direct imaging method is most sensitive to planets with large orbits, and has discovered some planets that have planet–star separations of hundreds of AU. However, protoplanetary disks are usually only around 100 AU in radius, and core accretion models predict giant planet formation to be within 10 AU, where the planets can coalesce quickly enough before the disk evaporates. Very-long-period giant planets may have been rogue planets that were captured, or formed close-in and gravitationally scattered outwards, or the planet and star could be a mass-imbalanced wide binary system with the planet being the primary object of its own separate protoplanetary disk. Gravitational instability models might produce planets at multi-hundred AU separations but this would require unusually large disks. For planets with very wide orbits up to several hundred thousand AU it may be difficult to observationally determine whether the planet is gravitationally bound to the star.

Most planets that have been discovered are within a couple of AU from their host star because the most used methods (radial-velocity and transit) require observation of several orbits to confirm that the planet exists and there has only been enough time since these methods were first used to cover small separations. Some planets with larger orbits have been discovered by direct imaging but there is a middle range of distances, roughly equivalent to the Solar System's gas giant region, which is largely unexplored. Direct imaging equipment for exploring that region was installed on two large telescopes that began operation in 2014, e.g. Gemini Planet Imager and VLT-SPHERE. The microlensing method has detected a few planets in the 1–10 AU range. It appears plausible that in most exoplanetary systems, there are one or two giant planets with orbits comparable in size to those of Jupiter and Saturn in the Solar System. Giant planets with substantially larger orbits are now known to be rare, at least around Sun-like stars.

The distance of the habitable zone from a star depends on the type of star and this distance changes during the star's lifetime as the size and temperature of the star changes.

Eccentricity

The eccentricity of an orbit is a measure of how elliptical (elongated) it is. All the planets of the Solar System except for Mercury have near-circular orbits (e<0.1). Most exoplanets with orbital periods of 20 days or less have near-circular orbits, i.e. very low eccentricity. That is thought to be due to tidal circularization: reduction of eccentricity over time due to gravitational interaction between two bodies. The mostly sub-Neptune-sized planets found by the Kepler spacecraft with short orbital periods have very circular orbits. By contrast, the giant planets with longer orbital periods discovered by radial-velocity methods have quite eccentric orbits. (As of July 2010, 55% of such exoplanets have eccentricities greater than 0.2, whereas 17% have eccentricities greater than 0.5.) Moderate to high eccentricities (e>0.2) of giant planets are not an observational selection effect, because a planet can be detected about equally well regardless of the eccentricity of its orbit. The statistical significance of elliptical orbits in the ensemble of observed giant planets is somewhat surprising, because current theories of planetary formation suggest that low-mass planets should have their orbital eccentricity circularized by gravitational interactions with the surrounding protoplanetary disk. However, as a planet grows more massive and its interaction with the disk becomes nonlinear, it may induce eccentric motion of the surrounding disk's gas, which in turn may excite the planet's orbital eccentricity. Low eccentricities are correlated with high multiplicity (number of planets in the system). Low eccentricity is needed for habitability, especially advanced life.

For weak Doppler signals near the limits of the current detection ability, the eccentricity becomes poorly constrained and biased towards higher values. It is suggested that some of the high eccentricities reported for low-mass exoplanets may be overestimates, because simulations show that many observations are also consistent with two planets on circular orbits. Reported observations of single planets in moderately eccentric orbits have about a 15% chance of being a pair of planets. This misinterpretation is especially likely if the two planets orbit with a 2:1 resonance. With the exoplanet sample known in 2009, a group of astronomers estimated that "(1) around 35% of the published eccentric one-planet solutions are statistically indistinguishable from planetary systems in 2:1 orbital resonance, (2) another 40% cannot be statistically distinguished from a circular orbital solution" and "(3) planets with masses comparable to Earth could be hidden in known orbital solutions of eccentric super-Earths and Neptune mass planets".

Radial velocity surveys found exoplanet orbits beyond 0.1 AU to be eccentric, particularly for large planets. Transit data obtained by the Kepler spacecraft, is consistent with the RV surveys and also revealed that smaller planets tend to have less eccentric orbits.

Inclination vs. spin–orbit angle

Orbital inclination is the angle between a planet's orbital plane and another plane of reference. For exoplanets, the inclination is usually stated with respect to an observer on Earth: the angle used is that between the normal to the planet's orbital plane and the line of sight from Earth to the star. Therefore, most planets observed by the transit method are close to 90 degrees. Because the word 'inclination' is used in exoplanet studies for this line-of-sight inclination then the angle between the planet's orbit and the star's rotation must use a different word and is termed the spin–orbit angle or spin–orbit alignment. In most cases the orientation of the star's rotational axis is unknown. The Kepler spacecraft has found a few hundred multi-planet systems and in most of these systems the planets all orbit in nearly the same plane, much like the Solar System. However, a combination of astrometric and radial-velocity measurements has shown that some planetary systems contain planets whose orbital planes are significantly tilted relative to each other. More than half of hot Jupiters have orbital planes substantially misaligned with their parent star's rotation. A substantial fraction of hot-Jupiters even have retrograde orbits, meaning that they orbit in the opposite direction from the star's rotation. Rather than a planet's orbit having been disturbed, it may be that the star itself flipped early in their system's formation due to interactions between the star's magnetic field and the planet-forming disk.

Periastron precession

Periastron precession is the rotation of a planet's orbit within the orbital plane, i.e. the axes of the ellipse change direction. In the Solar System, perturbations from other planets are the main cause, but for close-in exoplanets the largest factor can be tidal forces between the star and planet. For close-in exoplanets, the general relativistic contribution to the precession is also significant and can be orders of magnitude larger than the same effect for Mercury. Some exoplanets have significantly eccentric orbits, which makes it easier to detect the precession. The effect of general relativity can be detectable in timescales of about 10 years or less.

Nodal precession

Nodal precession is rotation of a planet's orbital plane. Nodal precession is more easily seen as distinct from periastron precession when the orbital plane is inclined to the star's rotation, the extreme case being a polar orbit.

WASP-33 is a fast-rotating star that hosts a hot Jupiter in an almost polar orbit. The quadrupole mass moment and the proper angular momentum of the star are 1900 and 400 times, respectively, larger than those of the Sun. This causes significant classical and relativistic deviations from Kepler's laws. In particular, the fast rotation causes large nodal precession because of the star's oblateness and the Lense–Thirring effect.

Rotation and axial tilt

Log-linear plot of planet mass (in Jupiter masses) vs. spin velocity (in km/s), comparing exoplanet Beta Pictoris b to the Solar System planets
Plot of equatorial spin velocity vs. mass for planets comparing Beta Pictoris b to the Solar System planets.

In April 2014, the first measurement of a planet's rotation period was announced: the length of day for the super-Jupiter gas giant Beta Pictoris b is 8 hours (based on the assumption that the axial tilt of the planet is small.) With an equatorial rotational velocity of 25 km per second, this is faster than for the giant planets of the Solar System, in line with the expectation that the more massive a giant planet, the faster it spins. Beta Pictoris b's distance from its star is 9 AU. At such distances the rotation of Jovian planets is not slowed by tidal effects. Beta Pictoris b is still warm and young and over the next hundreds of millions of years, it will cool down and shrink to about the size of Jupiter, and if its angular momentum is preserved, then as it shrinks, the length of its day will decrease to about 3 hours and its equatorial rotation velocity will speed up to about 40 km/s. The images of Beta Pictoris b do not have high enough resolution to directly see details but doppler spectroscopy techniques were used to show that different parts of the planet were moving at different speeds and in opposite directions from which it was inferred that the planet is rotating. With the next generation of large ground-based telescopes it will be possible to use doppler imaging techniques to make a global map of the planet, like the mapping of the brown dwarf Luhman 16B in 2014. A 2017 study of the rotation of several gas giants found no correlation between rotation rate and mass of the planet.

Origin of spin and tilt of terrestrial planets

Giant impacts have a large effect on the spin of terrestrial planets. The last few giant impacts during planetary formation tend to be the main determiner of a terrestrial planet's rotation rate. On average the spin angular velocity will be about 70% of the velocity that would cause the planet to break up and fly apart; the natural outcome of planetary embryo impacts at speeds slightly larger than escape velocity. In later stages terrestrial planet spin is also affected by impacts with planetesimals. During the giant impact stage, the thickness of a protoplanetary disk is far larger than the size of planetary embryos so collisions are equally likely to come from any direction in three-dimensions. This results in the axial tilt of accreted planets ranging from 0 to 180 degrees with any direction as likely as any other with both prograde and retrograde spins equally probable. Therefore, prograde spin with a small axial tilt, common for the Solar System's terrestrial planets except Venus, is not common in general for terrestrial planets built by giant impacts. The initial axial tilt of a planet determined by giant impacts can be substantially changed by stellar tides if the planet is close to its star and by satellite tides if the planet has a large satellite.

Tidal effects

For most planets, the rotation period and axial tilt (also called obliquity) are not known, but a large number of planets have been detected with very short orbits (where tidal effects are greater) that will probably have reached an equilibrium rotation that can be predicted (i.e. tidal lock, spin–orbit resonances, and non-resonant equilibria such as retrograde rotation).

Gravitational tides tend to reduce the axial tilt to zero but over a longer timescale than the rotation rate reaches equilibrium. However, the presence of multiple planets in a system can cause axial tilt to be captured in a resonance called a Cassini state. There are small oscillations around this state and in the case of Mars these axial tilt variations are chaotic.

Hot Jupiters' close proximity to their host star means that their spin–orbit evolution is mostly due to the star's gravity and not the other effects. Hot Jupiters' rotation rate is not thought to be captured into spin–orbit resonance because of the way in which such a fluid-body reacts to tides; a planet like this therefore slows down into synchronous rotation if its orbit is circular, or, alternatively, it slows down into a non-synchronous rotation if its orbit is eccentric. Hot Jupiters are likely to evolve towards zero axial tilt even if they had been in a Cassini state during planetary migration when they were further from their star. Hot Jupiters' orbits will become more circular over time, however the presence of other planets in the system on eccentric orbits, even ones as small as Earth and as far away as the habitable zone, can continue to maintain the eccentricity of the Hot Jupiter so that the length of time for tidal circularization can be billions instead of millions of years.

The rotation rate of planet HD 80606 b is predicted to be about 1.9 days. HD 80606 b avoids spin–orbit resonance because it is a gas giant. The eccentricity of its orbit means that it avoids becoming tidally locked.

Physical parameters

Mass

When a planet is found by the radial-velocity method, its orbital inclination i is unknown and can range from 0 to 90 degrees. The method is unable to determine the true mass (M) of the planet, but rather gives a lower limit for its mass, M sini. In a few cases an apparent exoplanet may be a more massive object such as a brown dwarf or red dwarf. However, the probability of a small value of i (say less than 30 degrees, which would give a true mass at least double the observed lower limit) is relatively low (1−3/2 ≈ 13%) and hence most planets will have true masses fairly close to the observed lower limit.

If a planet's orbit is nearly perpendicular to the line of vision (i.e. i close to 90°), a planet can be detected through the transit method. The inclination will then be known, and the inclination combined with M sini from radial-velocity observations will give the planet's true mass.

Also, astrometric observations and dynamical considerations in multiple-planet systems can sometimes provide an upper limit to the planet's true mass.

In 2013 it was proposed that the mass of a transiting exoplanet can also be determined from the transmission spectrum of its atmosphere, as it can be used to constrain independently the atmospheric composition, temperature, pressure, and scale height, however a 2017 study found that the transmission spectrum cannot unambiguously determine the mass.

Transit-timing variation can also be used to find a planet's mass.

Radius, density, and bulk composition

Prior to recent results from the Kepler space observatory, most confirmed planets were gas giants comparable in size to Jupiter or larger because they are most easily detected. However, the planets detected by Kepler are mostly between the size of Neptune and the size of Earth.

If a planet is detectable by both the radial-velocity and the transit methods, then both its true mass and its radius can be determined, as well as its density. Planets with low density are inferred to be composed mainly of hydrogen and helium, whereas planets of intermediate density are inferred to have water as a major constituent. A planet of high density is inferred to be rocky, like Earth and the other terrestrial planets of the Solar System.

alt=Histogram showing the radius-comparison of B4D exoplanet candidates to radii of Earth, a super-Earth, Neptune, Jupiter, and a super-Jupiter. Neptune and super-Jupiter are the most and least populated size-ranges, respectively.
Sizes of Kepler Planet Candidates – based on 2,740 candidates orbiting 2,036 stars as of 4 November 2013 (NASA).
 
Size-comparison of planets with different compositions to a Sun-like star, and to Earth
Comparison of sizes of planets with different compositions.

Gas giants, puffy planets, and super-Jupiters

Size comparison of Jupiter and exoplanet WASP-17b
Size comparison of WASP-17b (right) with Jupiter (left).
 

Gaseous planets that are hot are caused by extreme proximity to their host star, or because they are still hot from their formation and are expanded by the heat. For colder gas planets, there is a maximum radius which is slightly larger than Jupiter which occurs when the mass reaches a few Jupiter-masses. Adding mass beyond this point causes the radius to shrink.

Even when taking heat from the star into account, many transiting exoplanets are much larger than expected given their mass, meaning that they have surprisingly low density. See the magnetic field section for one possible explanation.

Two plots of exoplanet density vs. radius (in Jupiter radii). One shows density in g/cm3. The other shows diffusivity, or 1/density, or cm3/g.
Plots of exoplanet density and radius.[a] Top: Density vs. Radius. Bottom: Diffusity=1/Density vs. Radius. Units: Radius in Jupiter radii (RJup). Density in g/cm3. Diffusity in cm3/g. These plots show that there are a wide range of densities for planets between Earth and Neptune size, then the planets of 0.6 RJup size are very low-density and there are very few of them, then the gas giants have a large range of densities.

Besides the inflated hot Jupiters, there is another type of low-density planet: super-puffs with masses only a few times Earth's but with radii larger than Neptune. The planets around Kepler-51 are far less dense (far more diffuse) than the inflated hot Jupiters as can be seen in the plots on the right where the three Kepler-51 planets stand out in the diffusity vs. radius plot.

Ice giants and super-Neptunes

Kepler-101b was the first super-Neptune discovered. It has three times Neptune's mass but its density suggests that heavy elements make up more than 60% of its total mass, unlike hydrogen–helium-dominated gas giants.

Super-Earths, mini-Neptunes, and gas dwarfs

If a planet has a radius and/or mass between that of Earth and Neptune, then there is a question about whether the planet is rocky like Earth, a mixture of volatiles and gas like Neptune, a small planet with a hydrogen/helium envelope (mini-Jupiter), or of some other composition.

Some of the Kepler transiting planets with radii in the range of 1–4 Earth radii have had their masses measured by radial-velocity or transit-timing methods. The calculated densities show that up to 1.5 Earth radii, these planets are rocky and that density increases with increasing radius due to gravitational compression. However, between 1.5 and 4 Earth radii the density decreases with increasing radius. This indicates that above 1.5 Earth radii, planets tend to have increasing amounts of volatiles and gas. Despite this general trend, there is a wide range of masses at a given radius, which could be because gas planets can have rocky cores of different masses and compositions, and could also be due to photoevaporation of volatiles. Thermal evolutionary atmosphere models suggest a radius of 1.75 times that of Earth as a dividing line between rocky and gaseous planets. Excluding close-in planets that have lost their gas envelope due to stellar irradiation, studies of the metallicity of stars suggest a dividing line of 1.7 Earth radii between rocky planets and gas dwarfs, then another dividing line at 3.9 Earth radii between gas dwarfs and gas giants. These dividing lines are statistical trends and do not apply universally, because there are many other factors besides metallicity that affect planet formation, including distance from star – there may be larger rocky planets that formed at larger distances. An independent reanalysis of the data suggests that there are no such dividing lines and that there is a continuum of planet formation between 1 and 4 Earth radii and no reason to suspect that the amount of solid material in a protoplanetary disk determines whether super-Earths or mini-Neptunes form. Studies done in 2016 based on over 300 planets suggest that most objects over approximately two Earth masses collect significant hydrogen–helium envelopes, meaning rocky super-Earths may be rare.

The discovery of the low-density Earth-mass planet Kepler-138d shows that there is an overlapping range of masses in which both rocky planets and low-density planets occur. A low-mass low-density planets could be an ocean planet or super-Earth with a remnant hydrogen atmosphere, or a hot planet with a steam atmosphere, or a mini-Neptune with a hydrogen–helium atmosphere. Another possibility for a low-mass low-density planet is that it has a large atmosphere made up chiefly of carbon monoxide, carbon dioxide, methane, or nitrogen.

Massive solid planets

Size comparison of Kepler-10c with Earth and Neptune

In 2014, new measurements of Kepler-10c found it to be a Neptune-mass planet (17 Earth masses) with a density higher than Earth's, indicating that Kepler-10c is composed mostly of rock with possibly up to 20% high-pressure water ice but without a hydrogen-dominated envelope. Because this is well above the 10-Earth-mass upper limit that is commonly used for the term 'super-Earth', the term mega-Earth has been coined. A similarly massive and dense planet could be Kepler-131b, although its density is not as well measured as that of Kepler 10c. The next most massive known solid planets are half this mass: 55 Cancri e and Kepler-20b.

Gas planets can have large solid cores. The Saturn-mass planet HD 149026 b has only two-thirds of Saturn's radius, so it may have a rock–ice core of 60 Earth masses or more. CoRoT-20b has 4.24 times Jupiter's mass but a radius of only 0.84 that of Jupiter; it may have a metal core of 800 Earth masses if the heavy elements are concentrated in the core, or a core of 300 Earth masses if the heavy elements are more distributed throughout the planet.

Transit-timing variation measurements indicate that Kepler-52b, Kepler-52c and Kepler-57b have maximum masses between 30 and 100 times that of Earth, although the actual masses could be much lower. With radii about 2 Earth radii[58] in size, they might have densities larger than that of an iron planet of the same size. They orbit very close to their stars, so they could each be the remnant core (chthonian planet) of an evaporated gas giant or brown dwarf. If a remnant core is massive enough it could remain in such a state for billions of years despite having lost the atmospheric mass.

Solid planets up to thousands of Earth masses may be able to form around massive stars (B-type and O-type stars; 5–120 solar masses), where the protoplanetary disk would contain enough heavy elements. Also, these stars have high UV radiation and winds that could photoevaporate the gas in the disk, leaving just the heavy elements. For comparison, Neptune's mass equals 17 Earth masses, Jupiter has 318 Earth masses, and the 13-Jupiter-mass limit used in the IAU's working definition of an exoplanet equals approximately 4000 Earth masses.

Cold planets have a maximum radius because adding more mass at that point causes the planet to compress under the weight instead of increasing the radius. The maximum radius for solid planets is lower than the maximum radius for gas planets.

Shape

When the size of a planet is described using its radius, this is approximating the shape by a sphere. However, the rotation of a planet causes it to be flattened at the poles; so the equatorial radius is larger than the polar radius, making it closer to an oblate spheroid. The oblateness of transiting exoplanets will affect the transit light curves. At the limits of current technology it has been possible to show that HD 189733b is less oblate than Saturn. If the planet is close to its star, then gravitational tides will elongate the planet in the direction of the star, making the planet closer to a triaxial ellipsoid. Because tidal deformation is along a line between the planet and the star, it is difficult to detect from transit photometry; it will have an effect on the transit light curves an order of magnitude less than that caused by rotational deformation even in cases where tidal deformation is larger than rotational deformation (as is the case for tidally locked hot Jupiters). Material rigidity of rocky planets and rocky cores of gas planets will cause further deviations from the aforementioned shapes. Thermal tides caused by unevenly irradiated surfaces are another factor.

Surface weather analysis

From Wikipedia, the free encyclopedia

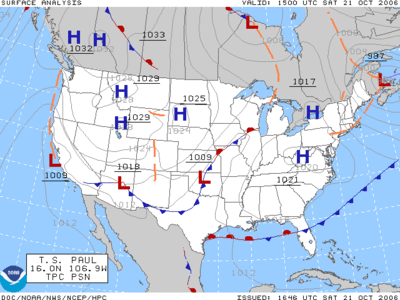
A surface weather analysis for the United States on October 21, 2006. By that time, Tropical Storm Paul was active (Paul later became a hurricane).

Surface weather analysis is a special type of weather map that provides a view of weather elements over a geographical area at a specified time based on information from ground-based weather stations.

Weather maps are created by plotting or tracing the values of relevant quantities such as sea level pressure, temperature, and cloud cover onto a geographical map to help find synoptic scale features such as weather fronts.

The first weather maps in the 19th century were drawn well after the fact to help devise a theory on storm systems. After the advent of the telegraph, simultaneous surface weather observations became possible for the first time, and beginning in the late 1840s, the Smithsonian Institution became the first organization to draw real-time surface analyses. Use of surface analyses began first in the United States, spreading worldwide during the 1870s. Use of the Norwegian cyclone model for frontal analysis began in the late 1910s across Europe, with its use finally spreading to the United States during World War II.

Surface weather analyses have special symbols that show frontal systems, cloud cover, precipitation, or other important information. For example, an H may represent high pressure, implying clear skies and relatively warm weather. An L, on the other hand, may represent low pressure, which frequently accompanies precipitation. Various symbols are used not just for frontal zones and other surface boundaries on weather maps, but also to depict the present weather at various locations on the weather map. Areas of precipitation help determine the frontal type and location.

History of surface analysis

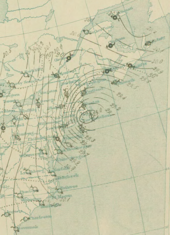
Surface analysis of Great Blizzard of 1888 on March 12, 1888 at 10 pm

The use of weather charts in a modern sense began in the middle portion of the 19th century in order to devise a theory on storm systems. The development of a telegraph network by 1845 made it possible to gather weather information from multiple distant locations quickly enough to preserve its value for real-time applications. The Smithsonian Institution developed its network of observers over much of the central and eastern United States between the 1840s and 1860s. The U.S. Army Signal Corps inherited this network between 1870 and 1874 by an act of Congress, and expanded it to the west coast soon afterwards.

The weather data was at first less useful as a result of the different times at which weather observations were made. The first attempts at time standardization took hold in Great Britain by 1855. The entire United States did not finally come under the influence of time zones until 1905, when Detroit finally established standard time. Other countries followed the lead of the United States in taking simultaneous weather observations, starting in 1873. Other countries then began preparing surface analyses. The use of frontal zones on weather maps did not appear until the introduction of the Norwegian cyclone model in the late 1910s, despite Loomis' earlier attempt at a similar notion in 1841. Since the leading edge of air mass changes bore resemblance to the military fronts of World War I, the term "front" came into use to represent these lines.

Present weather symbols used on weather maps

Despite the introduction of the Norwegian cyclone model just after World War I, the United States did not formally analyze fronts on surface analyses until late 1942, when the WBAN Analysis Center opened in downtown Washington, D.C. The effort to automate map plotting began in the United States in 1969, with the process complete in the 1970s. Hong Kong completed their process of automated surface plotting by 1987. By 1999, computer systems and software had finally become sophisticated enough to allow for the ability to underlay on the same workstation satellite imagery, radar imagery, and model-derived fields such as atmospheric thickness and frontogenesis in combination with surface observations to make for the best possible surface analysis. In the United States, this development was achieved when Intergraph workstations were replaced by n-AWIPS workstations. By 2001, the various surface analyses done within the National Weather Service were combined into the Unified Surface Analysis, which is issued every six hours and combines the analyses of four different centers. Recent advances in both the fields of meteorology and geographic information systems have made it possible to devise finely tailored weather maps. Weather information can quickly be matched to relevant geographical detail. For instance, icing conditions can be mapped onto the road network. This will likely continue to lead to changes in the way surface analyses are created and displayed over the next several years.

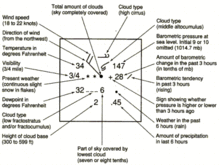
Station model used on weather maps

Station model plotted on surface weather analyses

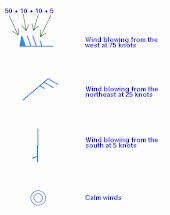
When analyzing a weather map, a station model is plotted at each point of observation. Within the station model, the temperature, dewpoint, wind speed and direction, atmospheric pressure, pressure tendency, and ongoing weather are plotted. The circle in the middle represents cloud cover; fraction it is filled in represents the degree of overcast. Outside the United States, temperature and dewpoint are plotted in degrees Celsius. The wind barb points in the direction from which the wind is coming. Each full flag on the wind barb represents 10 knots (19 km/h) of wind, each half flag represents 5 knots (9 km/h). When winds reach 50 knots (93 km/h), a filled in triangle is used for each 50 knots (93 km/h) of wind. In the United States, rainfall plotted in the corner of the station model are in inches. The international standard rainfall measurement unit is the millimeter. Once a map has a field of station models plotted, the analyzing isobars (lines of equal pressure), isallobars (lines of equal pressure change), isotherms (lines of equal temperature), and isotachs (lines of equal wind speed) are drawn.The abstract weather symbols were devised to take up the least room possible on weather maps.

Synoptic scale features

A synoptic scale feature is one whose dimensions are large in scale, more than several hundred kilometers in length. Migratory pressure systems and frontal zones exist on this scale.

Pressure centers

Wind barb interpretation

Centers of surface high- and low-pressure areas that are found within closed isobars on a surface weather analysis are the absolute maxima and minima in the pressure field, and can tell a user in a glance what the general weather is in their vicinity. Weather maps in English-speaking countries will depict their highs as Hs and lows as Ls, while Spanish-speaking countries will depict their highs as As and lows as Bs.

Low pressure

Low-pressure systems, also known as cyclones, are located in minima in the pressure field. Rotation is inward at the surface and counterclockwise in the northern hemisphere as opposed to inward and clockwise in the southern hemisphere due to the Coriolis force. Weather is normally unsettled in the vicinity of a cyclone, with increased cloudiness, increased winds, increased temperatures, and upward motion in the atmosphere, which leads to an increased chance of precipitation. Polar lows can form over relatively mild ocean waters when cold air sweeps in from the ice cap. The relatively warmer water leads to upward convection, causing a low to form, and precipitation usually in the form of snow. Tropical cyclones and winter storms are intense varieties of low pressure. Over land, thermal lows are indicative of hot weather during the summer.

High pressure

High-pressure systems, also known as anticyclones, rotate outward at the surface and clockwise in the northern hemisphere as opposed to outward and counterclockwise in the southern hemisphere. Under surface highs, sinking of the atmosphere slightly warms the air by compression, leading to clearer skies, winds that are lighter, and a reduced chance of precipitation. The descending air is dry, hence less energy is required to raise its temperature. If high pressure persists, air pollution will build up due to pollutants trapped near the surface caused by the subsiding motion associated with the high.

Fronts

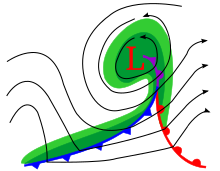
Occluded cyclone example. The triple point is the intersection of the cold, warm, and occluded fronts.

Fronts in meteorology are boundaries between air masses that have different density, air temperature, and humidity. Strictly speaking, the front is marked at the warmer edge of a frontal zone where the gradient is very large. When a front passes over a point, it is marked by changes in temperature, moisture, wind speed and direction, a minimum of atmospheric pressure, and a change in the cloud pattern, sometimes with precipitation. Cold fronts develop where the cold air mass is advancing, warm fronts where the warm air is advancing, and a stationary front is not moving. Fronts classically wrap around low pressure centers as indicated in the image here depicted for the northern hemisphere. On a larger scale, the Earth's polar front is a sharpening of the general equator-to-pole temperature gradient, underlying a high-altitude jet stream for reasons of thermal wind balance. Fronts usually travel from west to east, although they can move in a north-south direction or even east to west (a "backdoor" front) as airflow wraps around a low pressure center. Frontal zones can be distorted by such geographic features as mountains and large bodies of water.

Cold front

A cold front is located at the leading edge of a sharp temperature gradient on an isotherm analysis, often marked by a sharp surface pressure trough. Cold fronts can move up to twice as quickly as warm fronts and produce sharper changes in weather since cold air is denser than warm air and rapidly lifts as well as pushes the warmer air. Cold fronts are typically accompanied by a narrow band of clouds, showers and thunderstorms. On a weather map, the surface position of the cold front is marked with a blue line of triangles (pips) pointing in the direction of travel, at the leading edge of the cooler air mass.

Warm front

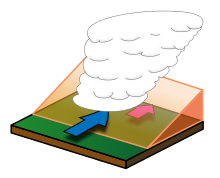
Warm fronts mark the position on the Earth's surface where a relatively warm body of air is advancing into colder air. The front is marked on the warm edge of the gradient in isotherms, and lies within a low pressure trough that tends to be broader and weaker than that of a cold front. Warm fronts move more slowly than cold fronts because cold air is denser, and is only pushed along (not lifted from) the Earth's surface. The warm air mass overrides the cold air mass, so temperature and cloud changes occur at higher altitudes before those at the surface. Clouds ahead of the warm front are mostly stratiform with precipitation that increases gradually as the front approaches. Ahead of a warm front, descending cloud bases will often begin with cirrus and cirrostratus (high-level), then altostratus (mid-level) clouds, and eventually lower in the atmosphere as the front passes through. Fog can precede a warm front when precipitation falls into areas of colder air, but increasing surface temperatures and wind tend to dissipate it after a warm front passes through. Cases with environmental instability can be conducive to thunderstorm development. On weather maps, the surface location of a warm front is marked with a red line of half circles pointing in the direction of travel.

Illustration clouds overriding a warm front

Occluded front

The classical view of an occluded front is that they are formed when a cold front overtakes a warm front. A more modern view suggests that they form directly during the wrap-up of the baroclinic zone during cyclogenesis, and lengthen due to flow deformation and rotation around the cyclone.

Occluded fronts are indicated on a weather map by a purple line with alternating half-circles and triangles pointing in direction of travel: that is, with a mixture of warm and cold frontal colors and symbols. Occlusions can be divided into warm vs. cold types. In a cold occlusion, the air mass overtaking the warm front is cooler than the cool air ahead of the warm front, and plows under both air masses. In a warm occlusion, the air mass overtaking the warm front is not as cool as the cold air ahead of the warm front, and rides over the colder air mass while lifting the warm air. Occluded fronts are indicated on a weather map by a purple line with alternating half-circles and triangles pointing in direction of travel.

Occluded fronts usually form around low pressure systems in the mature or late stages of their life cycle, but some continue to deepen after occlusion, and some do not form occluded fronts at all. The weather associated with an occluded front includes a variety of cloud and precipitation patterns, including dry slots and banded precipitation. Cold, warm and occluded fronts often meet at the point of occlusion or triple point.

A guide to the symbols for weather fronts that may be found on a weather map:
1. cold front
2. warm front
3. stationary front
4. occluded front
5. surface trough
6. squall line
7. dry line
8. tropical wave
9. Trowal

Stationary fronts and shearlines

A stationary front is a non-moving boundary between two different air masses. They tend to remain in the same area for long periods of time, sometimes undulating in waves. Often a less-steep temperature gradient continues behind (on the cool side of) the sharp frontal zone with more widely spaced isotherms. A wide variety of weather can be found along a stationary front, characterized more by its prolonged presence than by a specific type. Stationary fronts may dissipate after several days, but can change into a cold or warm front if conditions aloft change, driving one air mass toward the other. Stationary fronts are marked on weather maps with alternating red half-circles and blue spikes pointing in opposite directions, indicating no significant movement.

As airmass temperatures equalize, stationary fronts may become smaller in scale, degenerating to a narrow zone where wind direction changes over a short distance, known as a shear line, depicted as a blue line of single alternating dots and dashes.

Mesoscale features

Mesoscale features are smaller than synoptic scale systems like fronts, but larger than storm-scale systems like thunderstorms. Horizontal dimensions generally range from over ten kilometres to several hundred kilometres.

Dry line

The dry line is the boundary between dry and moist air masses east of mountain ranges with similar orientation to the Rockies, depicted at the leading edge of the dew point, or moisture, gradient. Near the surface, warm moist air that is denser than warmer, dryer air wedges under the drier air in a manner similar to that of a cold front wedging under warmer air. When the warm moist air wedged under the drier mass heats up, it becomes less dense and rises and sometimes forms thunderstorms. At higher altitudes, the warm moist air is less dense than the cooler, drier air and the boundary slope reverses. In the vicinity of the reversal aloft, severe weather is possible, especially when a triple point is formed with a cold front.

During daylight hours, drier air from aloft drifts down to the surface, causing an apparent movement of the dryline eastward. At night, the boundary reverts to the west as there is no longer any solar heating to help mix the lower atmosphere. If enough moisture converges upon the dryline, it can be the focus of afternoon and evening thunderstorms. A dry line is depicted on United States surface analyses as a brown line with scallops, or bumps, facing into the moist sector. Dry lines are one of the few surface fronts where the special shapes along the drawn boundary do not necessarily reflect the boundary's direction of motion.

Outflow boundaries and squall lines

A shelf cloud such as this one can be a sign that a squall is imminent

Organized areas of thunderstorm activity not only reinforce pre-existing frontal zones, but they can outrun cold fronts. This outrunning occurs in a pattern where the upper level jet splits into two streams. The resultant mesoscale convective system (MCS) forms at the point of the upper level split in the wind pattern at the area of the best low-level inflow. The convection then moves east and equatorward into the warm sector, parallel to low-level thickness lines. When the convection is strong and linear or curved, the MCS is called a squall line, with the feature placed at the leading edge where the significant wind shifts and pressure rises. Even weaker and less organized areas of thunderstorms will lead to locally cooler air and higher pressures, and outflow boundaries exist ahead of this type of activity, "SQLN" or "SQUALL LINE", while outflow boundaries are depicted as troughs with a label of "OUTFLOW BOUNDARY" or "OUTFLOW BNDRY".

Sea and land breeze fronts

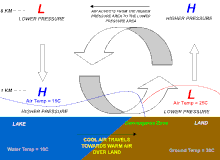
Idealized circulation pattern associated with a sea breeze

Sea breeze fronts occur on sunny days when the landmass warms the air above it to a temperature above the water temperature. Similar boundaries form downwind on lakes and rivers during the day, as well as offshore landmasses at night. Since the specific heat of water is so high, there is little diurnal temperature change in bodies of water, even on the sunniest days. The water temperature varies less than 1 °C (1.8 °F). By contrast, the land, with a lower specific heat, can vary several degrees in a matter of hours.

During the afternoon, air pressure decreases over the land as the warmer air rises. The relatively cooler air over the sea rushes in to replace it. The result is a relatively cool onshore wind. This process usually reverses at night where the water temperature is higher relative to the landmass, leading to an offshore land breeze. However, if water temperatures are colder than the land at night, the sea breeze may continue, only somewhat abated. This is typically the case along the California coast, for example.

If enough moisture exists, thunderstorms can form along sea breeze fronts that then can send out outflow boundaries. This causes chaotic wind/pressure regimes if the steering flow is weak. Like all other surface features, sea breeze fronts lie inside troughs of low pressure.

Gasification

From Wikipedia, the free encyclopedia

Gasification is a process that converts biomass- or fossil fuel-based carbonaceous materials into gases, including as the largest fractions: nitrogen (N2), carbon monoxide (CO), hydrogen (H2), and carbon dioxide (CO2). This is achieved by reacting the feedstock material at high temperatures (typically >700 °C), without combustion, via controlling the amount of oxygen and/or steam present in the reaction. The resulting gas mixture is called syngas (from synthesis gas) or producer gas and is itself a fuel due to the flammability of the H2 and CO of which the gas is largely composed. Power can be derived from the subsequent combustion of the resultant gas, and is considered to be a source of renewable energy if the gasified compounds were obtained from biomass feedstock.

An advantage of gasification is that syngas can be more efficient than direct combustion of the original feedstock material because it can be combusted at higher temperatures so that the thermodynamic upper limit to the efficiency defined by Carnot's rule is higher. Syngas may also be used as the hydrogen source in fuel cells, however the syngas produced by most gasification systems requires additional processing and reforming to remove the contaminants and other gases such as CO and CO2 to be suitable for low-temperature fuel cell use, but high-temperature solid oxide fuel cells are capable of directly accepting mixtures of steam, and methane.

Syngas is most commonly burned directly in gas engines, used to produce methanol and hydrogen, or converted via the Fischer–Tropsch process into synthetic fuel. For some materials gasification can be an alternative to landfilling and incineration, resulting in lowered emissions of atmospheric pollutants such as methane and particulates. Some gasification processes aim at refining out corrosive ash elements such as chloride and potassium, allowing clean gas production from otherwise problematic feedstock material. Gasification of fossil fuels is currently widely used on industrial scales to generate electricity. Gasification can generate lower amounts of some pollutants as SOx and NOx than combustion.

History

Adler Diplomat 3 with gas generator (1941)

Energy has been produced at industrial scale via gasification since the early 19th century. Initially coal and peat were gasified to produce town gas for lighting and cooking, with the first public street lighting installed in Pall Mall, London on January 28, 1807, spreading shortly to supply commercial gas lighting to most industrialized cities until the end of the 19th century  when it was replaced with electrical lighting. Gasification and syngas continued to be used in blast furnaces and more significantly in the production of synthetic chemicals where it has been in use since the 1920s. The thousands of sites left toxic residue. Some sites have been remediated, while others are still polluted.

During both world wars, especially the World War II, the need for fuel produced by gasification reemerged due to the shortage of petroleum. Wood gas generators, called Gasogene or Gazogène, were used to power motor vehicles in Europe. By 1945 there were trucks, buses and agricultural machines that were powered by gasification. It is estimated that there were close to 9,000,000 vehicles running on producer gas all over the world.

Chemical reactions

In a gasifier, the carbonaceous material undergoes several different processes:

Pyrolysis of carbonaceous fuels
 
Gasification of char
  1. The dehydration or drying process occurs at around 100 °C. Typically the resulting steam is mixed into the gas flow and may be involved with subsequent chemical reactions, notably the water-gas reaction if the temperature is sufficiently high (see step #5).
  2. The pyrolysis (or devolatilization) process occurs at around 200–300 °C. Volatiles are released and char is produced, resulting in up to 70% weight loss for coal. The process is dependent on the properties of the carbonaceous material and determines the structure and composition of the char, which will then undergo gasification reactions.
  3. The combustion process occurs as the volatile products and some of the char react with oxygen to primarily form carbon dioxide and small amounts of carbon monoxide, which provides heat for the subsequent gasification reactions. Letting C represent a carbon-containing organic compound, the basic reaction here is
  4. The gasification process occurs as the char reacts with steam and carbon dioxide to produce carbon monoxide and hydrogen, via the reactions and
  5. In addition, the reversible gas phase water-gas shift reaction reaches equilibrium very fast at the temperatures in a gasifier. This balances the concentrations of carbon monoxide, steam, carbon dioxide and hydrogen.

In essence, a limited amount of oxygen or air is introduced into the reactor to allow some of the organic material to be "burned" to produce carbon dioxide and energy, which drives a second reaction that converts further organic material to hydrogen and additional carbon dioxide. Further reactions occur when the formed carbon monoxide and residual water from the organic material react to form methane and excess carbon dioxide (). This third reaction occurs more abundantly in reactors that increase the residence time of the reactive gases and organic materials, as well as heat and pressure. Catalysts are used in more sophisticated reactors to improve reaction rates, thus moving the system closer to the reaction equilibrium for a fixed residence time.

Processes

Main gasifier types

Several types of gasifiers are currently available for commercial use: counter-current fixed bed, co-current fixed bed, fluidized bed, entrained flow, plasma, and free radical.

Counter-current fixed bed ("up draft") gasifier

A fixed bed of carbonaceous fuel (e.g. coal or biomass) through which the "gasification agent" (steam, oxygen and/or air) flows in counter-current configuration. The ash is either removed in the dry condition or as a slag. The slagging gasifiers have a lower ratio of steam to carbon, achieving temperatures higher than the ash fusion temperature. The nature of the gasifier means that the fuel must have high mechanical strength and must ideally be non-caking so that it will form a permeable bed, although recent developments have reduced these restrictions to some extent. The throughput for this type of gasifier is relatively low. Thermal efficiency is high as the temperatures in the gas exit are relatively low. However, this means that tar and methane production is significant at typical operation temperatures, so product gas must be extensively cleaned before use. The tar can be recycled to the reactor.

In the gasification of fine, undensified biomass such as rice hulls, it is necessary to blow air into the reactor by means of a fan. This creates very high gasification temperature, as high as 1000 C. Above the gasification zone, a bed of fine and hot char is formed, and as the gas is blow forced through this bed, most complex hydrocarbons are broken down into simple components of hydrogen and carbon monoxide.

Co-current fixed bed ("down draft") gasifier

Similar to the counter-current type, but the gasification agent gas flows in co-current configuration with the fuel (downwards, hence the name "down draft gasifier"). Heat needs to be added to the upper part of the bed, either by combusting small amounts of the fuel or from external heat sources. The produced gas leaves the gasifier at a high temperature, and most of this heat is often transferred to the gasification agent added in the top of the bed, resulting in an energy efficiency on level with the counter-current type. Since all tars must pass through a hot bed of char in this configuration, tar levels are much lower than the counter-current type.

Fluidized bed reactor

Fluidized bed gasification facility under construction in Amsterdam designed to convert waste materials into biofuels. Operation is expected in 2023.

The fuel is fluidized in oxygen and steam or air. The ash is removed dry or as heavy agglomerates that defluidize. The temperatures are relatively low in dry ash gasifiers, so the fuel must be highly reactive; low-grade coals are particularly suitable. The agglomerating gasifiers have slightly higher temperatures, and are suitable for higher rank coals. Fuel throughput is higher than for the fixed bed, but not as high as for the entrained flow gasifier. The conversion efficiency can be rather low due to elutriation of carbonaceous material. Recycle or subsequent combustion of solids can be used to increase conversion. Fluidized bed gasifiers are most useful for fuels that form highly corrosive ash that would damage the walls of slagging gasifiers. Biomass fuels generally contain high levels of corrosive ash.

Fluidized bed gasifiers uses inert bed material at a fluidized state which enhance the heat and biomass distribution inside a gasifier. At a fluidized state, the superficial fluid velocity is greater than the minimum fluidization velocity required to lift the bed material against the weight of the bed. Fluidized bed gasifiers are divided into Bubbling Fluidized Bed (BFB), Circulating Fluidized Bed (CFB) and Dual Fluidized Bed (DFB) gasifiers.

Entrained flow gasifier

A dry pulverized solid, an atomized liquid fuel or a fuel slurry is gasified with oxygen (much less frequent: air) in co-current flow. The gasification reactions take place in a dense cloud of very fine particles. Most coals are suitable for this type of gasifier because of the high operating temperatures and because the coal particles are well separated from one another.

The high temperatures and pressures also mean that a higher throughput can be achieved, however thermal efficiency is somewhat lower as the gas must be cooled before it can be cleaned with existing technology. The high temperatures also mean that tar and methane are not present in the product gas; however the oxygen requirement is higher than for the other types of gasifiers. All entrained flow gasifiers remove the major part of the ash as a slag as the operating temperature is well above the ash fusion temperature.

A smaller fraction of the ash is produced either as a very fine dry fly ash or as a black colored fly ash slurry. Some fuels, in particular certain types of biomasses, can form slag that is corrosive for ceramic inner walls that serve to protect the gasifier outer wall. However some entrained flow type of gasifiers do not possess a ceramic inner wall but have an inner water or steam cooled wall covered with partially solidified slag. These types of gasifiers do not suffer from corrosive slags.

Some fuels have ashes with very high ash fusion temperatures. In this case mostly limestone is mixed with the fuel prior to gasification. Addition of a little limestone will usually suffice for the lowering the fusion temperatures. The fuel particles must be much smaller than for other types of gasifiers. This means the fuel must be pulverized, which requires somewhat more energy than for the other types of gasifiers. By far the most energy consumption related to entrained flow gasification is not the milling of the fuel but the production of oxygen used for the gasification.

Plasma gasifier

In a plasma gasifier a high-voltage current is fed to a torch, creating a high-temperature arc. The inorganic residue is retrieved as a glass like substance.

Feedstock

There are a large number of different feedstock types for use in a gasifier, each with different characteristics, including size, shape, bulk density, moisture content, energy content, chemical composition, ash fusion characteristics, and homogeneity of all these properties. Coal and petroleum coke are used as primary feedstocks for many large gasification plants worldwide. Additionally, a variety of biomass and waste-derived feedstocks can be gasified, with wood pellets and chips, waste wood, plastics and aluminium, Municipal Solid Waste (MSW), Refuse-derived fuel (RDF), agricultural and industrial wastes, sewage sludge, switch grass, discarded seed corn, corn stover and other crop residues all being used.

Chemrec has developed a process for gasification of black liquor.

Waste disposal

HTCW reactor, one of several proposed waste gasification processes.

Waste gasification has several advantages over incineration:

  • The necessary extensive flue gas cleaning may be performed on the syngas instead of the much larger volume of flue gas after combustion.
  • Electric power may be generated in engines and gas turbines, which are much cheaper and more efficient than the steam cycle used in incineration. Even fuel cells may potentially be used, but these have rather severe requirements regarding the purity of the gas.
  • Chemical processing (Gas to liquids) of the syngas may produce other synthetic fuels instead of electricity.
  • Some gasification processes treat ash containing heavy metals at very high temperatures so that it is released in a glassy and chemically stable form.

A major challenge for waste gasification technologies is to reach an acceptable (positive) gross electric efficiency. The high efficiency of converting syngas to electric power is counteracted by significant power consumption in the waste preprocessing, the consumption of large amounts of pure oxygen (which is often used as gasification agent), and gas cleaning. Another challenge becoming apparent when implementing the processes in real life is to obtain long service intervals in the plants, so that it is not necessary to close down the plant every few months for cleaning the reactor.

Environmental advocates have called gasification "incineration in disguise" and argue that the technology is still dangerous to air quality and public health. "Since 2003 numerous proposals for waste treatment facilities hoping to use... gasification technologies failed to receive final approval to operate when the claims of project proponents did not withstand public and governmental scrutiny of key claims," according to the Global Alliance for Incinerator Alternatives. One facility which operated from 2009–2011 in Ottawa had 29 "emissions incidents" and 13 "spills" over those three years. It was also only able to operate roughly 25% of the time.

Several waste gasification processes have been proposed, but few have yet been built and tested, and only a handful have been implemented as plants processing real waste, and most of the time in combination with fossil fuels.

One plant (in Chiba, Japan using the Thermoselect process) has been processing industrial waste with natural gas and purified oxygen since year 2000, but has not yet documented positive net energy production from the process.

In 2007 Ze-gen erected a waste gasification demonstration facility in New Bedford, Massachusetts. The facility was designed to demonstrate gasification of specific non-MSW waste streams using liquid metal gasification. This facility came after widespread public opposition shelved plans for a similar plant in Attleboro, Massachusetts. Today Ze-gen appears to be defunct, and the company website was taken down in 2014.

Also in the US, in 2011 a plasma system delivered by PyroGenesis Canada Inc. was tested to gasify municipal solid waste, hazardous waste and biomedical waste at the Hurlburt Field Florida Special Operations Command Air Force base. The plant, which cost $7.4 million to construct, was closed and sold at a government liquidation auction in May 2013. The opening bid was $25. The winning bid was sealed.

Current applications

Syngas can be used for heat production and for generation of mechanical and electrical power. Like other gaseous fuels, producer gas gives greater control over power levels when compared to solid fuels, leading to more efficient and cleaner operation.

Syngas can also be used for further processing to liquid fuels or chemicals.

Heat

Gasifiers offer a flexible option for thermal applications, as they can be retrofitted into existing gas fueled devices such as ovens, furnaces, boilers, etc., where syngas may replace fossil fuels. Heating values of syngas are generally around 4–10 MJ/m3.

Electricity

Currently Industrial-scale gasification is primarily used to produce electricity from fossil fuels such as coal, where the syngas is burned in a gas turbine. Gasification is also used industrially in the production of electricity, ammonia and liquid fuels (oil) using Integrated Gasification Combined Cycles (IGCC), with the possibility of producing methane and hydrogen for fuel cells. IGCC is also a more efficient method of CO2 capture as compared to conventional technologies. IGCC demonstration plants have been operating since the early 1970s and some of the plants constructed in the 1990s are now entering commercial service.

Combined heat and power

In small business and building applications, where the wood source is sustainable, 250–1000 kWe and new zero carbon biomass gasification plants have been installed in Europe that produce tar free syngas from wood and burn it in reciprocating engines connected to a generator with heat recovery. This type of plant is often referred to as a wood biomass CHP unit but is a plant with seven different processes: biomass processing, fuel delivery, gasification, gas cleaning, waste disposal, electricity generation and heat recovery.

Transport fuel

Diesel engines can be operated on dual fuel mode using producer gas. Diesel substitution of over 80% at high loads and 70–80% under normal load variations can easily be achieved. Spark ignition engines and solid oxide fuel cells can operate on 100% gasification gas. Mechanical energy from the engines may be used for e.g. driving water pumps for irrigation or for coupling with an alternator for electrical power generation.

While small scale gasifiers have existed for well over 100 years, there have been few sources to obtain a ready-to-use machine. Small scale devices are typically DIY projects. However, currently in the United States, several companies offer gasifiers to operate small engines.

Renewable energy and fuels

Gasification plant Güssing, Austria (2001-2015)

In principle, gasification can proceed from just about any organic material, including biomass and plastic waste. The resulting syngas can be combusted. Alternatively, if the syngas is clean enough, it may be used for power production in gas engines, gas turbines or even fuel cells, or converted efficiently to dimethyl ether (DME) by methanol dehydration, methane via the Sabatier reaction, or diesel-like synthetic fuel via the Fischer–Tropsch process. In many gasification processes most of the inorganic components of the input material, such as metals and minerals, are retained in the ash. In some gasification processes (slagging gasification) this ash has the form of a glassy solid with low leaching properties, but the net power production in slagging gasification is low (sometimes negative) and costs are higher.

Regardless of the final fuel form, gasification itself and subsequent processing neither directly emits nor traps greenhouse gases such as carbon dioxide. Power consumption in the gasification and syngas conversion processes may be significant though, and may indirectly cause CO2 emissions; in slagging and plasma gasification, the electricity consumption may even exceed any power production from the syngas.

Combustion of syngas or derived fuels emits exactly the same amount of carbon dioxide as would have been emitted from direct combustion of the initial fuel. Biomass gasification and combustion could play a significant role in a renewable energy economy, because biomass production removes the same amount of CO2 from the atmosphere as is emitted from gasification and combustion. While other biofuel technologies such as biogas and biodiesel are carbon neutral, gasification in principle may run on a wider variety of input materials and can be used to produce a wider variety of output fuels.

There are at present a few industrial scale biomass gasification plants. Since 2008 in Svenljunga, Sweden, a biomass gasification plant generates up to 14 MWth, supplying industries and citizens of Svenljunga with process steam and district heating, respectively. The gasifier uses biomass fuels such as CCA or creosote impregnated waste wood and other kinds of recycled wood to produces syngas that is combusted on site. In 2011 a similar gasifier, using the same kinds of fuels, is being installed at Munkfors Energy's CHP plant. The CHP plant will generate 2 MWe (electricity) and 8 MWth (district heating).

Examples of demonstration projects include:

  • The 32 MW dual fluidized bed gasification of the GoBiGas project in Gothenburg, Sweden, produced around 20 MW of substitute natural gas from forest residues and fed it into the natural gas grid since December 2014. The plant was permanently closed due to technical and economical problems in April 2018. Göteborg Energi had invested 175 million euro in the plant and intensive attempts to sell the plant to new investors had failed for a year.
  • Those of the Renewable Energy Network Austria, including a plant using dual fluidized bed gasification that has supplied the town of Güssing with 2 MW of electricity, produced utilising GE Jenbacher reciprocating gas engines and 4 MW of heat, generated from wood chips, since 2001. The plant was decommissioned in 2015.
  • Go Green Gas' pilot plant in Swindon, UK has demonstrated methane production from waste feedstocks at 50 kW. The project has prompted the construction of a £25million commercial facility that aims to generate 22GWh per annum of grid-quality natural gas from waste wood and refuse derived fuel, due for completion in 2018.
  • Chemrec's pilot plant in Piteå that produced 3 MW of clean syngas from entrained flow gasification of black liquor. The plant was closed down permanently due to financial problems in 2016
  • The High Temperature Winkler (HTW), a pressurized circulating fluidized bed gasification process. During the 1990s HTW was tested with a variety of different feedstocks, including low-rank coals and various forms of biomass; wood, refuse derived fuel (RDF) and municipal solid waste (MSW). The last HTW facility closed permanently in 2002. Since 2015 tests of the process continues at a 0.1 t/h pilot unit at Darmstadt University, while a redesigned full-scale unit is under erection in Amsterdam.

Lie point symmetry

From Wikipedia, the free encyclopedia https://en.wikipedia.org/wiki/Lie_point_symmetry     ...