Search This Blog

Monday, August 8, 2022

Approximations of π

From Wikipedia, the free encyclopedia

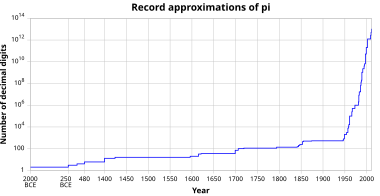
Graph showing the historical evolution of the record precision of numerical approximations to pi, measured in decimal places (depicted on a logarithmic scale; time before 1400 is not shown to scale).

Approximations for the mathematical constant pi (π) in the history of mathematics reached an accuracy within 0.04% of the true value before the beginning of the Common Era. In Chinese mathematics, this was improved to approximations correct to what corresponds to about seven decimal digits by the 5th century.

Further progress was not made until the 15th century (through the efforts of Jamshīd al-Kāshī). Early modern mathematicians reached an accuracy of 35 digits by the beginning of the 17th century (Ludolph van Ceulen), and 126 digits by the 19th century (Jurij Vega), surpassing the accuracy required for any conceivable application outside of pure mathematics.

The record of manual approximation of π is held by William Shanks, who calculated 527 digits correctly in 1853. Since the middle of the 20th century, the approximation of π has been the task of electronic digital computers (for a comprehensive account, see Chronology of computation of π). On June 8, 2022, the current record was established by Emma Haruka Iwao with Alexander Yee's y-cruncher with 100 trillion digits.

Early history

The best known approximations to π dating to before the Common Era were accurate to two decimal places; this was improved upon in Chinese mathematics in particular by the mid-first millennium, to an accuracy of seven decimal places. After this, no further progress was made until the late medieval period.

Some Egyptologists have claimed that the ancient Egyptians used an approximation of π as 227 = 3.142857 (about 0.04% too high) from as early as the Old Kingdom. This claim has been met with skepticism.

Babylonian mathematics usually approximated π to 3, sufficient for the architectural projects of the time (notably also reflected in the description of Solomon's Temple in the Hebrew Bible). The Babylonians were aware that this was an approximation, and one Old Babylonian mathematical tablet excavated near Susa in 1936 (dated to between the 19th and 17th centuries BCE) gives a better approximation of π as 258 = 3.125, about 0.528% below the exact value.

At about the same time, the Egyptian Rhind Mathematical Papyrus (dated to the Second Intermediate Period, c. 1600 BCE, although stated to be a copy of an older, Middle Kingdom text) implies an approximation of π as 25681 ≈ 3.16 (accurate to 0.6 percent) by calculating the area of a circle via approximation with the octagon.

Astronomical calculations in the Shatapatha Brahmana (c. 6th century BCE) use a fractional approximation of 339108 ≈ 3.139.

The Mahabharata (500 BCE - 300 CE) offers an approximation of 3, in the ratios offered in Bhishma Parva verses: 6.12.40-45.

...

The Moon is handed down by memory to be eleven thousand yojanas in diameter. Its peripheral circle happens to be thirty three thousand yojanas when calculated.
...
The Sun is eight thousand yojanas and another two thousand  yojanas in diameter. From that its peripheral circle comes to be equal to thirty thousand yojanas.

...

— "verses: 6.12.40-45, Bhishma Parva of the Mahabharata"

In the 3rd century BCE, Archimedes proved the sharp inequalities 22371 < π < 227, by means of regular 96-gons (accuracies of 2·10−4 and 4·10−4, respectively).

In the 2nd century CE, Ptolemy used the value 377120, the first known approximation accurate to three decimal places (accuracy 2·10−5). It is equal to which is accurate to two sexagesimal digits.

The Chinese mathematician Liu Hui in 263 CE computed π to between 3.141024 and 3.142708 by inscribing a 96-gon and 192-gon; the average of these two values is 3.141866 (accuracy 9·10−5). He also suggested that 3.14 was a good enough approximation for practical purposes. He has also frequently been credited with a later and more accurate result, π ≈ 39271250 = 3.1416 (accuracy 2·10−6), although some scholars instead believe that this is due to the later (5th-century) Chinese mathematician Zu Chongzhi. Zu Chongzhi is known to have computed π to be between 3.1415926 and 3.1415927, which was correct to seven decimal places. He also gave two other approximations of π: π ≈ 227 and π ≈ 355113, which are not as accurate as his decimal result. The latter fraction is the best possible rational approximation of π using fewer than five decimal digits in the numerator and denominator. Zu Chongzhi's results surpass the accuracy reached in Hellenistic mathematics, and would remain without improvement for close to a millennium.

In Gupta-era India (6th century), mathematician Aryabhata, in his astronomical treatise Āryabhaṭīya stated:

Add 4 to 100, multiply by 8 and add to 62,000. This is ‘approximately’ the circumference of a circle whose diameter is 20,000.

Approximating π to four decimal places: π ≈ 6283220000 = 3.1416, Aryabhata stated that his result "approximately" (āsanna "approaching") gave the circumference of a circle. His 15th-century commentator Nilakantha Somayaji (Kerala school of astronomy and mathematics) has argued that the word means not only that this is an approximation, but that the value is incommensurable (irrational).

Middle Ages

Further progress was not made for nearly a millennium, until the 14th century, when Indian mathematician and astronomer Madhava of Sangamagrama, founder of the Kerala school of astronomy and mathematics, found the Maclaurin series for arctangent, and then two infinite series for π. One of them is now known as the Madhava–Leibniz series, based on

The other was based on

Comparison of the convergence of two Madhava series (the one with 12 in dark blue) and several historical infinite series for π. Sn is the approximation after taking n terms. Each subsequent subplot magnifies the shaded area horizontally by 10 times.

He used the first 21 terms to compute an approximation of π correct to 11 decimal places as 3.14159265359.

He also improved the formula based on arctan(1) by including a correction:

It is not known how he came up with this correction. Using this he found an approximation of π to 13 decimal places of accuracy when n = 75.

Jamshīd al-Kāshī (Kāshānī), a Persian astronomer and mathematician, correctly computed the fractional part of 2π to 9 sexagesimal digits in 1424, and translated this into 16 decimal digits after the decimal point:

which gives 16 correct digits for π after the decimal point:

He achieved this level of accuracy by calculating the perimeter of a regular polygon with 3 × 228 sides.

16th to 19th centuries

In the second half of the 16th century, the French mathematician François Viète discovered an infinite product that converged on π known as Viète's formula.

The German-Dutch mathematician Ludolph van Ceulen (circa 1600) computed the first 35 decimal places of π with a 262-gon. He was so proud of this accomplishment that he had them inscribed on his tombstone.

In Cyclometricus (1621), Willebrord Snellius demonstrated that the perimeter of the inscribed polygon converges on the circumference twice as fast as does the perimeter of the corresponding circumscribed polygon. This was proved by Christiaan Huygens in 1654. Snellius was able to obtain seven digits of π from a 96-sided polygon.

In 1789, the Slovene mathematician Jurij Vega calculated the first 140 decimal places for π, of which the first 126 were correct, and held the world record for 52 years until 1841, when William Rutherford calculated 208 decimal places, of which the first 152 were correct. Vega improved John Machin's formula from 1706 and his method is still mentioned today.

The magnitude of such precision (152 decimal places) can be put into context by the fact that the circumference of the largest known object, the observable universe, can be calculated from its diameter (93 billion light-years) to a precision of less than one Planck length (at 1.6162×10⁻³⁵ meters, the shortest unit of length expected to be directly measurable) using π expressed to just 62 decimal places.

The English amateur mathematician William Shanks, a man of independent means, calculated π to 530 decimal places in January 1853, of which the first 527 were correct (the last few likely being incorrect due to round-off errors). He subsequently expanded his calculation to 607 decimal places in April 1853, but an error introduced right at the 530th decimal place rendered the rest of his calculation erroneous; due to the nature of Machin's formula, the error propagated back to the 528th decimal place, leaving only the first 527 digits correct once again. Twenty years later, Shanks expanded his calculation to 707 decimal places in April 1873. Due to this being an expansion of his previous calculation, all of the new digits were incorrect as well. Shanks was said to have calculated new digits all morning and would then spend all afternoon checking his morning's work. This was the longest expansion of π until the advent of the electronic digital computer three-quarters of a century later.

20th and 21st centuries

In 1910, the Indian mathematician Srinivasa Ramanujan found several rapidly converging infinite series of π, including

which computes a further eight decimal places of π with each term in the series. His series are now the basis for the fastest algorithms currently used to calculate π. Even using just the first term gives

See Ramanujan–Sato series.

From the mid-20th century onwards, all calculations of π have been done with the help of calculators or computers.

In 1944, D. F. Ferguson, with the aid of a mechanical desk calculator, found that William Shanks had made a mistake in the 528th decimal place, and that all succeeding digits were incorrect.

In the early years of the computer, an expansion of π to 100000 decimal places was computed by Maryland mathematician Daniel Shanks (no relation to the aforementioned William Shanks) and his team at the United States Naval Research Laboratory in Washington, D.C. In 1961, Shanks and his team used two different power series for calculating the digits of π. For one, it was known that any error would produce a value slightly high, and for the other, it was known that any error would produce a value slightly low. And hence, as long as the two series produced the same digits, there was a very high confidence that they were correct. The first 100,265 digits of π were published in 1962. The authors outlined what would be needed to calculate π to 1 million decimal places and concluded that the task was beyond that day's technology, but would be possible in five to seven years.

In 1989, the Chudnovsky brothers computed π to over 1 billion decimal places on the supercomputer IBM 3090 using the following variation of Ramanujan's infinite series of π:

Records since then have all been accomplished using the Chudnovsky algorithm. In 1999, Yasumasa Kanada and his team at the University of Tokyo computed π to over 200 billion decimal places on the supercomputer HITACHI SR8000/MPP (128 nodes) using another variation of Ramanujan's infinite series of π. In November 2002, Yasumasa Kanada and a team of 9 others used the Hitachi SR8000, a 64-node supercomputer with 1 terabyte of main memory, to calculate π to roughly 1.24 trillion digits in around 600 hours (25 days).

Recent Records

  1. In August 2009, a Japanese supercomputer called the T2K Open Supercomputer more than doubled the previous record by calculating π to roughly 2.6 trillion digits in approximately 73 hours and 36 minutes.
  2. In December 2009, Fabrice Bellard used a home computer to compute 2.7 trillion decimal digits of π. Calculations were performed in base 2 (binary), then the result was converted to base 10 (decimal). The calculation, conversion, and verification steps took a total of 131 days.
  3. In August 2010, Shigeru Kondo used Alexander Yee's y-cruncher to calculate 5 trillion digits of π. This was the world record for any type of calculation, but significantly it was performed on a home computer built by Kondo. The calculation was done between 4 May and 3 August, with the primary and secondary verifications taking 64 and 66 hours respectively.
  4. In October 2011, Shigeru Kondo broke his own record by computing ten trillion (1013) and fifty digits using the same method but with better hardware.
  5. In December 2013, Kondo broke his own record for a second time when he computed 12.1 trillion digits of π.
  6. In October 2014, Sandon Van Ness, going by the pseudonym "houkouonchi" used y-cruncher to calculate 13.3 trillion digits of π.
  7. In November 2016, Peter Trueb and his sponsors computed on y-cruncher and fully verified 22.4 trillion digits of π (22,459,157,718,361 (πe × 1012)). The computation took (with three interruptions) 105 days to complete, the limitation of further expansion being primarily storage space.
  8. In March 2019, Emma Haruka Iwao, an employee at Google, computed 31.4 (approximately 10π) trillion digits of pi using y-cruncher and Google Cloud machines. This took 121 days to complete.
  9. In January 2020, Timothy Mullican announced the computation of 50 trillion digits over 303 days.
  10. On August 14, 2021, a team (DAViS) at the University of Applied Sciences of the Grisons announced completion of the computation of π to 62.8 (approximately 20π) trillion digits.
  11. On June 8th 2022, Emma Haruka Iwao announced on the Google Cloud Blog the computation of 100 trillion (1014) digits of π over 158 days using Alexander Yee's y-cruncher.

Practical approximations

Depending on the purpose of a calculation, π can be approximated by using fractions for ease of calculation. The most notable such approximations are 227 (relative error of about 4·10−4) and 355113 (relative error of about 8·10−8).

Non-mathematical "definitions" of π

Of some notability are legal or historical texts purportedly "defining π" to have some rational value, such as the "Indiana Pi Bill" of 1897, which stated "the ratio of the diameter and circumference is as five-fourths to four" (which would imply "π = 3.2") and a passage in the Hebrew Bible that implies that π = 3.

Indiana bill

The so-called "Indiana Pi Bill" from 1897 has often been characterized as an attempt to "legislate the value of Pi". Rather, the bill dealt with a purported solution to the problem of geometrically "squaring the circle".

The bill was nearly passed by the Indiana General Assembly in the U.S., and has been claimed to imply a number of different values for π, although the closest it comes to explicitly asserting one is the wording "the ratio of the diameter and circumference is as five-fourths to four", which would make π = 165 = 3.2, a discrepancy of nearly 2 percent. A mathematics professor who happened to be present the day the bill was brought up for consideration in the Senate, after it had passed in the House, helped to stop the passage of the bill on its second reading, after which the assembly thoroughly ridiculed it before postponing it indefinitely.

Imputed biblical value

It is sometimes claimed that the Hebrew Bible implies that "π equals three", based on a passage in 1 Kings 7:23 and 2 Chronicles 4:2 giving measurements for the round basin located in front of the Temple in Jerusalem as having a diameter of 10 cubits and a circumference of 30 cubits.

The issue is discussed in the Talmud and in Rabbinic literature. Among the many explanations and comments are these:

  • Rabbi Nehemiah explained this in his Mishnat ha-Middot (the earliest known Hebrew text on geometry, ca. 150 CE) by saying that the diameter was measured from the outside rim while the circumference was measured along the inner rim. This interpretation implies a brim about 0.225 cubit (or, assuming an 18-inch "cubit", some 4 inches), or one and a third "handbreadths," thick (cf. NKJV and NKJV).
  • Maimonides states (ca. 1168 CE) that π can only be known approximately, so the value 3 was given as accurate enough for religious purposes. This is taken by some as the earliest assertion that π is irrational.

There is still some debate on this passage in biblical scholarship. Many reconstructions of the basin show a wider brim (or flared lip) extending outward from the bowl itself by several inches to match the description given in NKJV In the succeeding verses, the rim is described as "a handbreadth thick; and the brim thereof was wrought like the brim of a cup, like the flower of a lily: it received and held three thousand baths" NKJV, which suggests a shape that can be encompassed with a string shorter than the total length of the brim, e.g., a Lilium flower or a Teacup.

Development of efficient formulae

Polygon approximation to a circle

Archimedes, in his Measurement of a Circle, created the first algorithm for the calculation of π based on the idea that the perimeter of any (convex) polygon inscribed in a circle is less than the circumference of the circle, which, in turn, is less than the perimeter of any circumscribed polygon. He started with inscribed and circumscribed regular hexagons, whose perimeters are readily determined. He then shows how to calculate the perimeters of regular polygons of twice as many sides that are inscribed and circumscribed about the same circle. This is a recursive procedure which would be described today as follows: Let pk and Pk denote the perimeters of regular polygons of k sides that are inscribed and circumscribed about the same circle, respectively. Then,

Archimedes uses this to successively compute P12, p12, P24, p24, P48, p48, P96 and p96. Using these last values he obtains

It is not known why Archimedes stopped at a 96-sided polygon; it only takes patience to extend the computations. Heron reports in his Metrica (about 60 CE) that Archimedes continued the computation in a now lost book, but then attributes an incorrect value to him.

Archimedes uses no trigonometry in this computation and the difficulty in applying the method lies in obtaining good approximations for the square roots that are involved. Trigonometry, in the form of a table of chord lengths in a circle, was probably used by Claudius Ptolemy of Alexandria to obtain the value of π given in the Almagest (circa 150 CE).

Advances in the approximation of π (when the methods are known) were made by increasing the number of sides of the polygons used in the computation. A trigonometric improvement by Willebrord Snell (1621) obtains better bounds from a pair of bounds obtained from the polygon method. Thus, more accurate results were obtained from polygons with fewer sides. Viète's formula, published by François Viète in 1593, was derived by Viète using a closely related polygonal method, but with areas rather than perimeters of polygons whose numbers of sides are powers of two.

The last major attempt to compute π by this method was carried out by Grienberger in 1630 who calculated 39 decimal places of π using Snell's refinement.

Machin-like formula

For fast calculations, one may use formulae such as Machin's:

together with the Taylor series expansion of the function arctan(x). This formula is most easily verified using polar coordinates of complex numbers, producing:

({x,y} = {239, 132} is a solution to the Pell equation x2−2y2 = −1.)

Formulae of this kind are known as Machin-like formulae. Machin's particular formula was used well into the computer era for calculating record numbers of digits of π, but more recently other similar formulae have been used as well.

For instance, Shanks and his team used the following Machin-like formula in 1961 to compute the first 100,000 digits of π:

and they used another Machin-like formula,

as a check.

The record as of December 2002 by Yasumasa Kanada of Tokyo University stood at 1,241,100,000,000 digits. The following Machin-like formulae were used for this:

K. Takano (1982).

F. C. M. Størmer (1896).

Other classical formulae

Other formulae that have been used to compute estimates of π include:

Liu Hui (see also Viète's formula):

Madhava:

Euler:

Newton / Euler Convergence Transformation:

where (2k + 1)!! denotes the product of the odd integers up to 2k + 1.

Ramanujan:

David Chudnovsky and Gregory Chudnovsky:

Ramanujan's work is the basis for the Chudnovsky algorithm, the fastest algorithms used, as of the turn of the millennium, to calculate π.

Modern algorithms

Extremely long decimal expansions of π are typically computed with iterative formulae like the Gauss–Legendre algorithm and Borwein's algorithm. The latter, found in 1985 by Jonathan and Peter Borwein, converges extremely quickly:

For and

where , the sequence converges quartically to π, giving about 100 digits in three steps and over a trillion digits after 20 steps. The Gauss–Legendre algorithm (with time complexity , using Harvey–Hoeven multiplication algorithm) is asymptotically faster than the Chudnovsky algorithm (with time complexity ) – but which of these algorithms is faster in practice for "small enough" depends on technological factors such as memory sizes and access times. For breaking world records, the iterative algorithms are used less commonly than the Chudnovsky algorithm since they are memory-intensive.

The first one million digits of π and 1π are available from Project Gutenberg. A former calculation record (December 2002) by Yasumasa Kanada of Tokyo University stood at 1.24 trillion digits, which were computed in September 2002 on a 64-node Hitachi supercomputer with 1 terabyte of main memory, which carries out 2 trillion operations per second, nearly twice as many as the computer used for the previous record (206 billion digits). The following Machin-like formulae were used for this:

(Kikuo Takano (1982))
(F. C. M. Størmer (1896)).

These approximations have so many digits that they are no longer of any practical use, except for testing new supercomputers. Properties like the potential normality of π will always depend on the infinite string of digits on the end, not on any finite computation.

Miscellaneous approximations

Historically, base 60 was used for calculations. In this base, π can be approximated to eight (decimal) significant figures with the number 3;8,29,4460, which is

(The next sexagesimal digit is 0, causing truncation here to yield a relatively good approximation.)

In addition, the following expressions can be used to estimate π:

  • accurate to three digits:
  • accurate to three digits:
Karl Popper conjectured that Plato knew this expression, that he believed it to be exactly π, and that this is responsible for some of Plato's confidence in the omnicompetence of mathematical geometry—and Plato's repeated discussion of special right triangles that are either isosceles or halves of equilateral triangles.
  • accurate to four digits:
  • accurate to four digits (or five significant figures):
  • an approximation by Ramanujan, accurate to 4 digits (or five significant figures):
  • accurate to five digits:
  • accurate to six digits:
 
  • accurate to seven digits:
- inverse of first term of Ramanujan series.
  • accurate to eight digits:
  • accurate to nine digits:
This is from Ramanujan, who claimed the Goddess of Namagiri appeared to him in a dream and told him the true value of π.
  • accurate to ten digits:
  • accurate to ten digits:
  • accurate to ten digits (or eleven significant figures):
This curious approximation follows the observation that the 193rd power of 1/π yields the sequence 1122211125... Replacing 5 by 2 completes the symmetry without reducing the correct digits of π, while inserting a central decimal point remarkably fixes the accompanying magnitude at 10100.
  • accurate to eleven digits:
  • accurate to twelve digits:
  • accurate to 16 digits:
- inverse of sum of first two terms of Ramanujan series.
  • accurate to 18 digits:
This is based on the fundamental discriminant d = 3(89) = 267 which has class number h(-d) = 2 explaining the algebraic numbers of degree 2. The core radical is 53 more than the fundamental unit which gives the smallest solution { x, y} = {500, 53} to the Pell equation x2 − 89y2 = −1.
  • accurate to 24 digits:
- inverse of sum of first three terms of Ramanujan series.
  • accurate to 30 decimal places:
Derived from the closeness of Ramanujan constant to the integer 6403203+744. This does not admit obvious generalizations in the integers, because there are only finitely many Heegner numbers and negative discriminants d with class number h(−d) = 1, and d = 163 is the largest one in absolute value.
  • accurate to 52 decimal places:
Like the one above, a consequence of the j-invariant. Among negative discriminants with class number 2, this d the largest in absolute value.
  • accurate to 161 decimal places:
where u is a product of four simple quartic units,
and,
Based on one found by Daniel Shanks. Similar to the previous two, but this time is a quotient of a modular form, namely the Dedekind eta function, and where the argument involves . The discriminant d = 3502 has h(−d) = 16.
  • The continued fraction representation of π can be used to generate successive best rational approximations. These approximations are the best possible rational approximations of π relative to the size of their denominators. Here is a list of the first thirteen of these:
Of these, is the only fraction in this sequence that gives more exact digits of π (i.e. 7) than the number of digits needed to approximate it (i.e. 6). The accuracy can be improved by using other fractions with larger numerators and denominators, but, for most such fractions, more digits are required in the approximation than correct significant figures achieved in the result.

Summing a circle's area

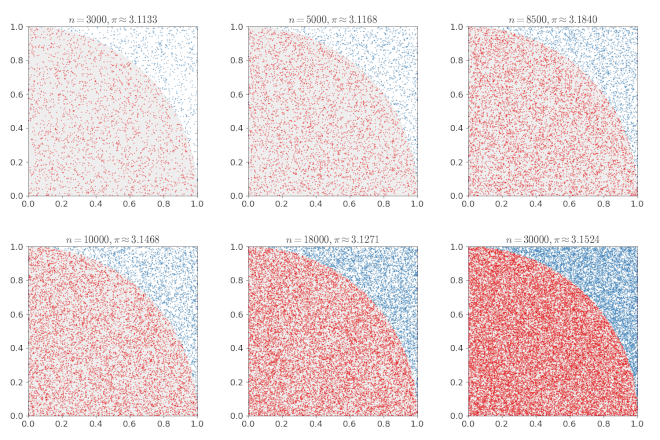
Numerical approximation of π: as points are randomly scattered inside the unit square, some fall within the unit circle. The fraction of points inside the circle approaches π/4 as points are added.

Pi can be obtained from a circle if its radius and area are known using the relationship:

If a circle with radius r is drawn with its center at the point (0, 0), any point whose distance from the origin is less than r will fall inside the circle. The Pythagorean theorem gives the distance from any point (xy) to the center:

Mathematical "graph paper" is formed by imagining a 1×1 square centered around each cell (xy), where x and y are integers between −r and r. Squares whose center resides inside or exactly on the border of the circle can then be counted by testing whether, for each cell (xy),

The total number of cells satisfying that condition thus approximates the area of the circle, which then can be used to calculate an approximation of π. Closer approximations can be produced by using larger values of r.

Mathematically, this formula can be written:

In other words, begin by choosing a value for r. Consider all cells (xy) in which both x and y are integers between −r and r. Starting at 0, add 1 for each cell whose distance to the origin (0,0) is less than or equal to r. When finished, divide the sum, representing the area of a circle of radius r, by r2 to find the approximation of π. For example, if r is 5, then the cells considered are:

(−5,5) (−4,5) (−3,5) (−2,5) (−1,5) (0,5) (1,5) (2,5) (3,5) (4,5) (5,5)
(−5,4) (−4,4) (−3,4) (−2,4) (−1,4) (0,4) (1,4) (2,4) (3,4) (4,4) (5,4)
(−5,3) (−4,3) (−3,3) (−2,3) (−1,3) (0,3) (1,3) (2,3) (3,3) (4,3) (5,3)
(−5,2) (−4,2) (−3,2) (−2,2) (−1,2) (0,2) (1,2) (2,2) (3,2) (4,2) (5,2)
(−5,1) (−4,1) (−3,1) (−2,1) (−1,1) (0,1) (1,1) (2,1) (3,1) (4,1) (5,1)
(−5,0) (−4,0) (−3,0) (−2,0) (−1,0) (0,0) (1,0) (2,0) (3,0) (4,0) (5,0)
(−5,−1) (−4,−1) (−3,−1) (−2,−1) (−1,−1) (0,−1) (1,−1) (2,−1) (3,−1) (4,−1) (5,−1)
(−5,−2) (−4,−2) (−3,−2) (−2,−2) (−1,−2) (0,−2) (1,−2) (2,−2) (3,−2) (4,−2) (5,−2)
(−5,−3) (−4,−3) (−3,−3) (−2,−3) (−1,−3) (0,−3) (1,−3) (2,−3) (3,−3) (4,−3) (5,−3)
(−5,−4) (−4,−4) (−3,−4) (−2,−4) (−1,−4) (0,−4) (1,−4) (2,−4) (3,−4) (4,−4) (5,−4)
(−5,−5) (−4,−5) (−3,−5) (−2,−5) (−1,−5) (0,−5) (1,−5) (2,−5) (3,−5) (4,−5) (5,−5)
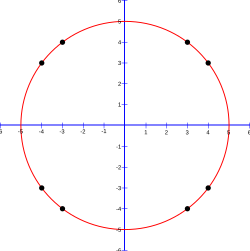
This circle as it would be drawn on a Cartesian coordinate graph. The cells (±3, ±4) and (±4, ±3) are labeled.

The 12 cells (0, ±5), (±5, 0), (±3, ±4), (±4, ±3) are exactly on the circle, and 69 cells are completely inside, so the approximate area is 81, and π is calculated to be approximately 3.24 because 8152 = 3.24. Results for some values of r are shown in the table below:

r area approximation of π
2 13 3.25
3 29 3.22222
4 49 3.0625
5 81 3.24
10 317 3.17
20 1257 3.1425
100 31417 3.1417
1000 3141549 3.141549

For related results see The circle problem: number of points (x,y) in square lattice with x^2 + y^2 <= n.

Similarly, the more complex approximations of π given below involve repeated calculations of some sort, yielding closer and closer approximations with increasing numbers of calculations.

Continued fractions

Besides its simple continued fraction representation [3; 7, 15, 1, 292, 1, 1, ...], which displays no discernible pattern, π has many generalized continued fraction representations generated by a simple rule, including these two.

The well-known values 227 and 355113 are respectively the second and fourth continued fraction approximations to π. (Other representations are available at The Wolfram Functions Site.)

Trigonometry

Gregory–Leibniz series

The Gregory–Leibniz series

is the power series for arctan(x) specialized to x = 1. It converges too slowly to be of practical interest. However, the power series converges much faster for smaller values of , which leads to formulae where arises as the sum of small angles with rational tangents, known as Machin-like formulae.

Arctangent

Knowing that 4 arctan 1 = π, the formula can be simplified to get:

with a convergence such that each additional 10 terms yields at least three more digits.

Another formula for involving arctangent function is given by

where such that . Approximations can be made by using, for example, the rapidly convergent Euler formula

Alternatively, the following simple expansion series of the arctangent function can be used

where

to approximate with even more rapid convergence. Convergence in this arctangent formula for improves as integer increases.

The constant can also be expressed by infinite sum of arctangent functions as

and

where is the n-th Fibonacci number. However, these two formulae for are much slower in convergence because of set of arctangent functions that are involved in computation.

Arcsine

Observing an equilateral triangle and noting that

yields

with a convergence such that each additional five terms yields at least three more digits.

Digit extraction methods

The Bailey–Borwein–Plouffe formula (BBP) for calculating π was discovered in 1995 by Simon Plouffe. Using base 16 math, the formula can compute any particular digit of π—returning the hexadecimal value of the digit—without having to compute the intervening digits (digit extraction).

In 1996, Simon Plouffe derived an algorithm to extract the nth decimal digit of π (using base 10 math to extract a base 10 digit), and which can do so with an improved speed of O(n3(log n)3) time. The algorithm requires virtually no memory for the storage of an array or matrix so the one-millionth digit of π can be computed using a pocket calculator. However, it would be quite tedious and impractical to do so.

The calculation speed of Plouffe's formula was improved to O(n2) by Fabrice Bellard, who derived an alternative formula (albeit only in base 2 math) for computing π.

Efficient methods

Many other expressions for π were developed and published by Indian mathematician Srinivasa Ramanujan. He worked with mathematician Godfrey Harold Hardy in England for a number of years.

Extremely long decimal expansions of π are typically computed with the Gauss–Legendre algorithm and Borwein's algorithm; the Salamin–Brent algorithm, which was invented in 1976, has also been used.

In 1997, David H. Bailey, Peter Borwein and Simon Plouffe published a paper (Bailey, 1997) on a new formula for π as an infinite series:

This formula permits one to fairly readily compute the kth binary or hexadecimal digit of π, without having to compute the preceding k − 1 digits. Bailey's website contains the derivation as well as implementations in various programming languages. The PiHex project computed 64 bits around the quadrillionth bit of π (which turns out to be 0).

Fabrice Bellard further improved on BBP with his formula:

Other formulae that have been used to compute estimates of π include:

Newton.
Srinivasa Ramanujan.

This converges extraordinarily rapidly. Ramanujan's work is the basis for the fastest algorithms used, as of the turn of the millennium, to calculate π.

In 1988, David Chudnovsky and Gregory Chudnovsky found an even faster-converging series (the Chudnovsky algorithm):

.

The speed of various algorithms for computing pi to n correct digits is shown below in descending order of asymptotic complexity. M(n) is the complexity of the multiplication algorithm employed.

Algorithm Year Time complexity or Speed
Gauss–Legendre algorithm 1975
Chudnovsky algorithm 1988
Binary splitting of the arctan series in Machin's formula
Leibniz formula for π 1300s Sublinear convergence. Five billion terms for 10 correct decimal places

Projects

Pi Hex

Pi Hex was a project to compute three specific binary digits of π using a distributed network of several hundred computers. In 2000, after two years, the project finished computing the five trillionth (5*1012), the forty trillionth, and the quadrillionth (1015) bits. All three of them turned out to be 0.

Software for calculating π

Over the years, several programs have been written for calculating π to many digits on personal computers.

General purpose

Most computer algebra systems can calculate π and other common mathematical constants to any desired precision.

Functions for calculating π are also included in many general libraries for arbitrary-precision arithmetic, for instance Class Library for Numbers, MPFR and SymPy.

Special purpose

Programs designed for calculating π may have better performance than general-purpose mathematical software. They typically implement checkpointing and efficient disk swapping to facilitate extremely long-running and memory-expensive computations.

  • TachusPi by Fabrice Bellard is the program used by himself to compute world record number of digits of pi in 2009.
  • y-cruncher by Alexander Yee is the program which every world record holder since Shigeru Kondo in 2010 has used to compute world record numbers of digits. y-cruncher can also be used to calculate other constants and holds world records for several of them.
  • PiFast by Xavier Gourdon was the fastest program for Microsoft Windows in 2003. According to its author, it can compute one million digits in 3.5 seconds on a 2.4 GHz Pentium 4. PiFast can also compute other irrational numbers like e and 2. It can also work at lesser efficiency with very little memory (down to a few tens of megabytes to compute well over a billion (109) digits). This tool is a popular benchmark in the overclocking community. PiFast 4.4 is available from Stu's Pi page. PiFast 4.3 is available from Gourdon's page.
  • QuickPi by Steve Pagliarulo for Windows is faster than PiFast for runs of under 400 million digits. Version 4.5 is available on Stu's Pi Page below. Like PiFast, QuickPi can also compute other irrational numbers like e, 2, and 3. The software may be obtained from the Pi-Hacks Yahoo! forum, or from Stu's Pi page.
  • Super PI by Kanada Laboratory in the University of Tokyo is the program for Microsoft Windows for runs from 16,000 to 33,550,000 digits. It can compute one million digits in 40 minutes, two million digits in 90 minutes and four million digits in 220 minutes on a Pentium 90 MHz. Super PI version 1.9 is available from Super PI 1.9 page.
Climate change in the Arctic

From Wikipedia, the free encyclopedia
 
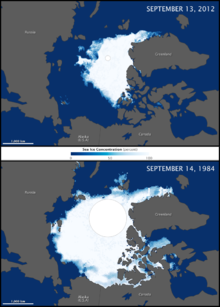
The maps above compare the Arctic ice minimum extents from 2012 (top) and 1984 (bottom).

Major environmental issues caused by contemporary climate change in the Arctic region range from the well-known, such as the loss of sea ice or melting of the Greenland ice sheet, to more obscure, but deeply significant issues, such as permafrost thaw, social consequences for locals and the geopolitical ramifications of these changes. The Arctic is likely to be especially affected by climate change because of the high projected rate of regional warming and associated impacts. Temperature projections for the Arctic region were assessed in 2007: These suggested already averaged warming of about 2 °C to 9 °C by the year 2100. The range reflects different projections made by different climate models, run with different forcing scenarios. Radiative forcing is a measure of the effect of natural and human activities on the climate. Different forcing scenarios reflect, for example, different projections of future human greenhouse gas emissions.

These effects are wide-ranging and can be seen in many Arctic systems, from fauna and flora to territorial claims. Temperatures in the region are rising twice as fast as elsewhere on Earth, leading to these effects worsening year on year and causing significant concern. The changing Arctic has global repercussions, perhaps via ocean circulation changes or arctic amplification.

Impacts on the natural environment

Temperature and weather changes

The image above shows where average air temperatures (October 2010 – September 2011) were up to 2 degrees Celsius above (red) or below (blue) the long-term average (1981–2010).

According to the Intergovernmental Panel on Climate Change, "surface air temperatures (SATs) in the Arctic have warmed at approximately twice the global rate". The period of 1995–2005 was the warmest decade in the Arctic since at least the 17th century, with temperatures 2 °C (3.6 °F) above the 1951–1990 average. In addition, since 2013, Arctic annual mean SAT has been at least 1 °C (1.8 °F) warmer than the 1981-2010 mean. With 2020 having the second warmest SAT anomaly after 2016, being 1.9 °C (3.4 °F) warmer than the 1981-2010 average.

Some regions within the Arctic have warmed even more rapidly, with Alaska and western Canada's temperature rising by 3 to 4 °C (5.40 to 7.20 °F). This warming has been caused not only by the rise in greenhouse gas concentration, but also the deposition of soot on Arctic ice. The smoke from wildfires defined as "brown carbon" also increases arctic warming. Its warming effect is around 30% from the effect of black carbon (soot). As wildfires increses with warming this create a positive feedback loop.  A 2013 article published in Geophysical Research Letters has shown that temperatures in the region haven't been as high as they currently are since at least 44,000 years ago and perhaps as long as 120,000 years ago. The authors conclude that "anthropogenic increases in greenhouse gases have led to unprecedented regional warmth."

On 20 June 2020, for the first time, a temperature measurement was made inside the Arctic Circle of 38 °C, more than 100 °F. This kind of weather was expected in the region only by 2100. In March, April and May the average temperature in the Arctic was 10 °C higher than normal. This heat wave, without human - induced warming, could happen only one time in 80,000 years, according to an attribution study published in July 2020. It is the strongest link of a weather event to anthropogenic climate change that had been ever found, for now. Such heat waves are generally a result of an unusual state of the jet stream.

Some scientists suggest that climate change will slow the jet stream by reducing the difference in temperature between the Arctic and more southern territories, because the Arctic is warming faster. This can facilitate the occurring of such heat waves. The scientists do not know if the 2020 heat wave is the result of such change.

A rise of 1.5 degrees in global temperature from the pre-industrial level will probably change the type of precipitation in the Arctic from snow to rain in summer and autumn, which will increase glaciers melting and permafrost thawing. Both effects lead to more warming.

One of the effects of climate change is a strong increase in the number of lightnings in the Arctic. Lightnings increase the risk for wildfires.

Arctic amplification

The poles of the Earth are more sensitive to any change in the planet's climate than the rest of the planet. In the face of ongoing global warming, the poles are warming faster than lower latitudes. The Arctic is warming more than twice as fast as the global average, process known as Arctic amplification (AA). The primary cause of this phenomenon is ice–albedo feedback where, by melting, ice uncovers darker land or ocean beneath, which then absorbs more sunlight, causing more heating. A study from 2019 identified sea-ice loss under increasing CO2 as a main driver for large AA. Thus, large AA only occurs from October to April in areas suffering from important sea-ice loss, because of the "Increased outgoing longwave radiation and heat fluxes from the newly opened waters".

Arctic amplification has been argued to have significant effects on midlatitude weather, contributing to more persistent hot-dry extremes and winter continental cooling.

Black carbon

Black carbon deposits (from the combustion of heavy fuel oil (HFO) of Arctic shipping) absorb solar radiation in the atmosphere and strongly reduce the albedo when deposited on snow and ice, thus accelerating the effect of the melting of snow and sea ice. A 2013 study quantified that gas flaring at petroleum extraction sites contributed over 40% of the black carbon deposited in the Arctic. Recent studies attributed the majority (56%) of Arctic surface black carbon to emissions from Russia, followed by European emissions, and Asia also being a large source.

According to a 2015 study, reductions in black carbon emissions and other minor greenhouse gases, by roughly 60 percent, could cool the Arctic up to 0.2 °C by 2050. However, a 2019 study indicates that "Black carbon emissions will continuously rise due to increased shipping activities", specifically fishing vessels.

Decline of sea ice

1870–2009 Northern Hemisphere sea ice extent in million square kilometers. Blue shading indicates the pre-satellite era; data then is less reliable.

Arctic sea ice decline has occurred in recent decades and is an effect of climate change; sea ice in the Arctic Ocean has melted more than it refreezes in the winter. Global warming, caused by greenhouse gas forcing is responsible for the decline in Arctic sea ice. Implications of arctic sea ice decline may include: Ice-free summer, amplified arctic warming, polar vortex disruption, atmospheric chemistry changes, atmospheric regime changes, changes to plant, animal, and microbial life; changed shipping options and other impacts on humans.

Sea ice in the arctic is currently in decline in area, extent, and volume, and has been accelerating during the early twenty‐first century, with a decline rate of −4.7% per decade (it has declined over 50% since the first satellite records). It is also thought that summertime sea ice will cease to exist sometime during the 21st century. This sea ice loss is one of the main drivers of surface-based Arctic amplification. Sea ice area means the total area covered by ice, whereas sea ice extent is the area of ocean with at least 15% sea ice, while the volume is the total amount of ice in the Arctic.

Changes in extent and area

Reliable measurement of sea ice edges began with the satellite era in the late 1970s. Before this time, sea ice area and extent were monitored less precisely by a combination of ships, buoys and aircraft. The data show a long-term negative trend in recent years, attributed to global warming, although there is also a considerable amount of variation from year to year. Some of this variation may be related to effects such as the Arctic oscillation, which may itself be related to global warming.

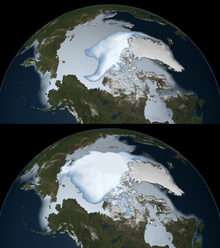
Sea ice coverage in 1980 (bottom) and 2012 (top), as observed by passive microwave sensors from NASA. Multi-year ice is shown in bright white, while average sea ice cover is shown in light blue to milky white.

The rate of the decline in entire Arctic ice coverage is accelerating. From 1979 to 1996, the average per decade decline in entire ice coverage was a 2.2% decline in ice extent and a 3% decline in ice area. For the decade ending 2008, these values have risen to 10.1% and 10.7%, respectively. These are comparable to the September to September loss rates in year-round ice (i.e., perennial ice, which survives throughout the year), which averaged a retreat of 10.2% and 11.4% per decade, respectively, for the period 1979–2007.

The Arctic sea ice September minimum extent (SIE) (i.e., area with at least 15% sea ice coverage) reached new record lows in 2002, 2005, 2007, 2012 (5.32 million km2), 2016 and 2019 (5.65 million km2). The 2007 melt season let to a minimum 39% below the 1979–2000 average, and for the first time in human memory, the fabled Northwest Passage opened completely. During July 2019 the warmest month in the Arctic was recorded, reaching the lowest SIE (7.5 million km2) and sea ice volume (8900 km3). Setting a decadal trend of SIE decline of -13%. As for now, the SIE has shrink by 50% since the 1970s.

From 2008 to 2011, Arctic sea ice minimum extent was higher than 2007, but it did not return to the levels of previous years. In 2012 however, the 2007 record low was broken in late August with three weeks still left in the melt season. It continued to fall, bottoming out on 16 September 2012 at 3.42 million square kilometers (1.32 million square miles), or 760,000 square kilometers (293,000 square miles) below the previous low set on 18 September 2007 and 50% below the 1979–2000 average.

Changes in volume

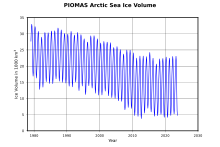
Seasonal variation and long-term decrease of Arctic sea ice volume as determined by measurement backed numerical modelling.

The sea ice thickness field and accordingly the ice volume and mass, is much more difficult to determine than the extension. Exact measurements can be made only at a limited number of points. Because of large variations in ice and snow thickness and consistency air- and spaceborne-measurements have to be evaluated carefully. Nevertheless, the studies made support the assumption of a dramatic decline in ice age and thickness. While the Arctic ice area and extent show an accelerating downward trend, arctic ice volume shows an even sharper decline than the ice coverage. Since 1979, the ice volume has shrunk by 80% and in just the past decade the volume declined by 36% in the autumn and 9% in the winter. And currently, 70% of the winter sea ice has turned into seasonal ice.

An end to summer sea ice?

The IPCC's Fourth Assessment Report in 2007 summarized the current state of sea ice projections: "the projected reduction [in global sea ice cover] is accelerated in the Arctic, where some models project summer sea ice cover to disappear entirely in the high-emission A2 scenario in the latter part of the 21st century.″  However, current climate models frequently underestimate the rate of sea ice retreat. A summertime ice-free Arctic would be unprecedented in recent geologic history, as currently scientific evidence does not indicate an ice-free polar sea anytime in the last 700,000 years.

The Arctic ocean will likely be free of summer sea ice before the year 2100, but many different dates have been projected, with models showing near-complete to complete loss in September from 2035 to some time around 2067.

Melting of the Greenland ice sheet

Albedo Change on Greenland

Models predict a sea-level contribution of about 5 centimetres (2 in) from melting of the Greenland ice sheet during the 21st century. It is also predicted that Greenland will become warm enough by 2100 to begin an almost complete melt during the next 1,000 years or more. In early July 2012, 97% percent of the ice sheet experienced some form of surface melt, including the summits.

Ice thickness measurements from the GRACE satellite indicate that ice mass loss is accelerating. For the period 2002–2009, the rate of loss increased from 137 Gt/yr to 286 Gt/yr, with every year seeing on average 30 gigatonnes more mass lost than in the preceding year. The rate of melting was 4 times higher in 2019 than in 2003. In the year 2019 the melting contributed 2.2 millimeters to sea level rise in just 2 months. Overall, the signs are overwhelming that melting is not only occurring, but accelerating year on year.

Greenland ice sheet mass trend (2003–2005)

According to a study published in "Nature Communications Earth and Environment" the Greenland ice sheet is possibly past the point of no return, meaning that even if the rise in temperature were to completely stop and even if the climate were to become a little colder, the melting would continue. This outcome is due to the movement of ice from the middle of Greenland to the coast, creating more contact between the ice and warmer coastal water and leading to more melting and calving. Another climate scientist says that after all the ice near the coast melts, the contact between the seawater and the ice will stop what can prevent further warming.

In September 2020, satellite imagery showed that a big chunk of ice shattered into many small pieces from the last remaining ice shelf in Nioghalvfjerdsfjorden, Greenland. This ice sheet is connected to the interior ice sheet, and could prove a hotspot for deglaciation in coming years.

Another unexpected effect of this melting relates to activities by the United States military in the area. Specifically, Camp Century, a nuclear powered base which has been producing nuclear waste over the years. In 2016, a group of scientists evaluated the environmental impact and estimated that due to changing weather patterns over the next few decades, melt water could release the nuclear waste, 20,000 liters of chemical waste and 24 million liters of untreated sewage into the environment. However, so far neither US or Denmark has taken responsibility for the clean-up.

Changes in vegetation

Western Hemisphere Arctic Vegetation Index Trend
 
Eastern Hemisphere Vegetation Index Trend

Climate change is expected to have a strong effect on the Arctic's flora, some of which is already being seen. These changes in vegetation are associated with the increases in landscape scale methane emissions, as well as increases in CO2, Tº and the disruption of ecological cycles which affect patterns in nutrient cycling, humidity and other key ecological factors that help shape plant communities.

A large source of information for how vegetation has adapted to climate change over the last years comes from satellite records, which help quantify shifts in vegetation in the Arctic region. For decades, NASA and NOAA satellites have continuously monitored vegetation from space. The Moderate Resolution Imaging Spectroradiometer (MODIS) and Advanced Very High-Resolution Radiometer (AVHRR) instruments, as well as others, measure the intensity of visible and near-infrared light reflecting off of plant leaves. Scientists use this information to calculate the Normalized Difference Vegetation Index (NDVI), an indicator of photosynthetic activity or “greenness” of the landscape, which is most often used. There also exist other indices, such as the Enhanced Vegetation Index (EVI) or Soil-Adjusted Vegetation Index (SAVI).

These indices can be used as proxies for vegetation productivity, and their shifts over time can provide information on how vegetation changes over time. One of the two most used ways to define shifts in vegetation in the Arctic are the concepts of Arctic greening and Arctic browning. The former refers to a positive trend in the aforementioned greenness indices, indicating increases in plant cover or biomass whereas browning can be broadly understood as a negative trend, with decreases in those variables.

Recent studies have allowed us to get an idea of how these two processes have progressed in recent years. It has been found that from 1985 to 2016, greening has occurred in 37.3% of all sites sampled in the tundra, whereas browning was observed only in 4.7% of them. Certain variables influenced this distribution, as greening was mostly associated with sites with higher summer air temperature, soil temperature and soil moisture. On the other hand, browning was found to be linked with colder sites that were experiencing cooling and drying. Overall, this paints the picture of widespread greening occurring throughout significant portions of the arctic tundra, as a consequence of increases in plant productivity, height, biomass and shrub dominance in the area.

This expansion of vegetation in the Arctic is not equivalent across types of vegetation. One of the most dramatic changes arctic tundras are currently facing is the expansion of shrubs, which, thanks to increases in air temperature and, to a lesser extent, precipitation have contributed to an Arctic-wide trend known as "shrubification", where shrub type plants are taking over areas previously dominated by moss and lichens. This change contributes to the consideration that the tundra biome is currently experiencing the most rapid change of any terrestrial biomes on the planet.

The direct impact on mosses and lichens is unclear as there exist very few studies at species level, but climate change is more likely to cause increased fluctuation and more frequent extreme events. The expansion of shrubs could affect permafrost dynamics, but the picture is quite unclear at the moment. In the winter, shrubs trap more snow, which insulates the permafrost from extreme cold spells, but in the summer they shade the ground from direct sunlight, how these two effects counter and balance each other is not yet well understood. Warming is likely to cause changes in plant communities overall, contributing to the rapid changes tundra ecosystems are facing. While shrubs may increase in range and biomass, warming may also cause a decline in cushion plants such as moss campion, and since cushion plants act as facilitator species across trophic levels and fill important ecological niches in several environments, this could cause cascading effects in these ecosystems that could severely affect the way in which they function and are structured.

The expansion of these shrubs can also have strong effects on other important ecological dynamics, such as the albedo effect. These shrubs change the winter surface of the tundra from undisturbed, uniform snow to mixed surface with protruding branches disrupting the snow cover, this type of snow cover has a lower albedo effect, with reductions of up to 55%, which contributes to a positive feedback loop on regional and global climate warming. This reduction of the albedo effect means that more radiation is absorbed by plants, and thus, surface temperatures increase, which could disrupt current surface-atmosphere energy exchanges and affect thermal regimes of permafrost. Carbon cycling is also being affected by these changes in vegetation, as parts of the tundra increase their shrub cover, they behave more like boreal forests in terms of carbon cycling. This is speeding up the carbon cycle, as warmer temperatures lead to increased permafrost thawing and carbon release, but also carbon capturing from plants that have increased growth. It is not certain whether this balance will go in one direction or the other, but studies have found that it is more likely that this will eventually lead to increased CO2 in the atmosphere.

For a more graphic and geographically focused overview of the situation, maps above show the Arctic Vegetation Index Trend between July 1982 and December 2011 in the Arctic Circle. Shades of green depict areas where plant productivity and abundance increased; shades of brown show where photosynthetic activity declined, both according to the NDVI index. The maps show a ring of greening in the treeless tundra ecosystems of the circumpolar Arctic—the northernmost parts of Canada, Russia, and Scandinavia. Tall shrubs and trees started to grow in areas that were previously dominated by tundra grasses, as part of the previously mentioned "shrubification" of the tundra. Researchers concluded that plant growth had increased by 7% to 10% overall.

However, boreal forests, particularly those in North America, showed a different response to warming. Many boreal forests greened, but the trend was not as strong as it was for tundra of the circumpolar Arctic, mostly characterized by shrub expansion and increased growth. In North America, some boreal forests actually experienced browning over the study period. Droughts, increased forest fire activity, animal behavior, industrial pollution, and a number of other factors may have contributed to browning.

Another important change affecting flora in the arctic is the increase of wildfires in the Arctic Circle, which in 2020 broke its record of CO2 emissions, peaking at 244 megatonnes of carbon dioxide emitted.  This is due to the burning of peatlands, carbon-rich soils that originate from the accumulation of waterlogged plants which are mostly found at Arctic latitudes. These peatlands are becoming more likely to burn as temperatures increase, but their own burning and releasing of CO2 contributes to their own likelihood of burning in a positive feedback loop.

In terms of aquatic vegetation, reduction of sea ice has boosted the productivity of phytoplankton by about twenty percent over the past thirty years. However, the effect on marine ecosystems is unclear, since the larger types of phytoplankton, which are the preferred food source of most zooplankton, do not appear to have increased as much as the smaller types. So far, Arctic phytoplankton have not had a significant impact on the global carbon cycle. In summer, the melt ponds on young and thin ice have allowed sunlight to penetrate the ice, in turn allowing phytoplankton to bloom in unexpected concentrations, although it is unknown just how long this phenomenon has been occurring, or what its effect on broader ecological cycles is.

Changes for animals

Projected change in polar bear habitat from 2001–2010 to 2041–2050

The northward shift of the subarctic climate zone is allowing animals that are adapted to that climate to move into the far north, where they are replacing species that are more adapted to a pure Arctic climate. Where the Arctic species are not being replaced outright, they are often interbreeding with their southern relations. Among slow-breeding vertebrate species, this usually has the effect of reducing the genetic diversity of the genus. Another concern is the spread of infectious diseases, such as brucellosis or phocine distemper virus, to previously untouched populations. This is a particular danger among marine mammals who were previously segregated by sea ice.

3 April 2007, the National Wildlife Federation urged the United States Congress to place polar bears under the Endangered Species Act. Four months later, the United States Geological Survey completed a year-long study which concluded in part that the floating Arctic sea ice will continue its rapid shrinkage over the next 50 years, consequently wiping out much of the polar bear habitat. The bears would disappear from Alaska, but would continue to exist in the Canadian Arctic Archipelago and areas off the northern Greenland coast. Secondary ecological effects are also resultant from the shrinkage of sea ice; for example, polar bears are denied their historic length of seal hunting season due to late formation and early thaw of pack ice.

Similarly, Arctic warming negatively affects the foraging and breeding ecology many other species of arctic marine mammals, such as walruses, seals, foxes or reindeers.  In July 2019, 200 Svalbard reindeer were found starved to death apparently due to low precipitation related to climate change.

In the short-term, climate warming may have neutral or positive effects on the nesting cycle of many Arctic-breeding shorebirds.

Permafrost thaw

Rapidly thawing Arctic permafrost and coastal erosion on the Beaufort Sea, Arctic Ocean, near Point Lonely, AK. Photo Taken in August 2013
 
Permafrost thaw ponds on Baffin Island
 

Permafrost is an important component of hydrological systems and ecosystems within the Arctic landscape. In the Northern Hemisphere the terrestrial permafrost domain comprises around 18 million km2. Within this permafrost region, the total soil organic carbon (SOC) stock is estimated to be 1,460-1,600 Pg (where 1 Pg = 1 billion tons), which constitutes double the amount of carbon currently contained in the atmosphere.

Human caused climate change leads to higher temperatures that cause permafrost thawing in the Arctic. The thawing of the various types of Arctic permafrost could release large amounts of carbon into the atmosphere.

The 2019 Arctic report card estimated that Arctic permafrost releases 0.3 Pg C per year. However, a recent study increased this estimate to 0.6 Pg, since the carbon emitted across the northern permafrost domain during the Arctic winter offsets the average carbon uptake during the growing season in that amount. Under a business-as-usual emissions scenario RCP 8.5, winter CO2 emissions from the norther permafrost domain is predicted to increase 41% by 2100, and 17% under the moderate scenario RCP 4.5.

Abrupt thaw

Permafrost thaw not only occurs gradually when climate warming increases permafrost temperature from the surface and gradually moves down. But abrupt thaw exists in <20% of the permafrost region, affecting half of the permafrost stored carbon. In contrast to gradual permafrost thaw (which extends over decades since warming of the soil surface slowly affects cm by cm), abrupt thaw rapidly affects wide areas of permafrost in a matter of years or even days.Thus, compared to just gradual thaw, abrupt thaw increases carbon emissions by ~125–190%.

Until now Permafrost carbon feedback (PCF) modeling had mainly focussed on gradual permafrost thaw, rather than taking abrupt thaw also into consideration, and therefore greatly underestimating thawing permafrost carbon release. Nevertheless, a study from 2018, by using field observations, radiocarbon dating, and remote sensing to account for thermokarst lakes, determined that abrupt thaw will more than double permafrost carbon emissions by 2100. And a second study from 2020, showed that under a high RCP 8.5 scenario, abrupt thaw carbon emissions across 2.5 million km2 are projected to provide the same feedback as gradual thaw of near-surface permafrost across the whole 18 million km2 it occupies.

Thawing permafrost represents a threat to industrial infrastructure. In May 2020, permafrost melting due to climate change caused the worst oil spill to date in the Arctic. The melting of permafrost caused a collapse of a fuel tank, spilling 6,000 tonnes of diesel into the land, 15,000 into the water. The rivers Ambarnaya, Daldykan and many smaller rivers were polluted. The pollution reached the lake Pyasino that is important to the water supply of the entire Taimyr Peninsula. State of emergency at the federal level was declared. Many buildings and infrastructure are built on permafrost, which cover 65% of Russian territory, and all those can be damaged as it melts. The thawing can also cause leakage of toxic elements from sites of buried toxic waste.

Subsea permafrost

Subsea permafrost occurs beneath the seabed and exists in the continental shelves of the polar regions. Thus, it can be defined as "the unglaciated continental shelf areas exposed during the Last Glacial Maximum (LGM, ~26 500 BP) that are currently inundated". Large stocks of organic matter (OM) and methane (CH4) are accumulated below and within the subsea permafrost deposits.This source of methane is different from methane clathrates, but contributes to the overall outcome and feedbacks in the Earth's climate system.

Sea ice serves to stabilise methane deposits on and near the shoreline, preventing the clathrate breaking down and venting into the water column and eventually reaching the atmosphere. Methane is released through bubbles from the subsea permafrost into the Ocean (a process called ebullition). During storms, methane levels in the water column drop dramatically, when wind-driven air-sea gas exchange accelerates the ebullition process into the atmosphere. This observed pathway suggests that methane from seabed permafrost will progress rather slowly, instead of abrupt changes. However, Arctic cyclones, fueled by global warming and further accumulation of greenhouse gases in the atmosphere could contribute to more release from this methane cache, which is really important for the Arctic. An update to the mechanisms of this permafrost degradation was published in 2017.

The size of today's subsea permafrost has been estimated at around 2 million km2 (~1/5 of the terrestrial permafrost domain size), which constitutes a 30-50% reduction since the LGM. Containing around 560 GtC in OM and 45 GtC in CH4, with a current release of 18 and 38 MtC per year respectively, which is due to the warming and thawing that the subsea permafrost domain has been experiencing since after the LGM (~14000 years ago). In fact, because the subsea permafrost systems responds at millennial timescales to climate warming, the current carbon fluxes it is emitting to the water are in response to climatic changes occurring after the LGM. Therefore, human-driven climate change effects on subsea permafrost will only be seen hundreds or thousands of years from today. According to predictions under a business-as-usual emissions scenario RCP 8.5, by 2100, 43 GtC could be released from the subsea permafrost domain, and 190 GtC by the year 2300. Whereas for the low emissions scenario RCP 2.6, 30% less emissions are estimated. This constitutes a significant anthropogenic-driven acceleration of carbon release in the upcoming centuries.

Effects on other parts of the world

On ocean circulation

Although this is now thought unlikely in the near future, it has also been suggested that there could be a shutdown of thermohaline circulation, similar to that which is believed to have driven the Younger Dryas, an abrupt climate change event. Even if a full shutdown is unlikely, a slowing down of this current and a weakening of its effects on climate has already been seen, with a 2015 study finding that the Atlantic meridional overturning circulation (AMOC) has weakened by 15% to 20% over the last 100 years. This slowing could lead to cooling in the North Atlantic, although this could be mitigated by global warming, but it is not clear up to what extent. Additional effects of this would be felt around the globe, with changes in tropical patterns, stronger storms in the North Atlantic and reduced European crop productivity among the potential repercussions.

There is also potentially a possibility of a more general disruption of ocean circulation, which may lead to an ocean anoxic event; these are believed to be much more common in the distant past. It is unclear whether the appropriate pre-conditions for such an event exist today, but these ocean anoxic events are thought to have been mainly caused by nutrient run-off, which was driven by increased CO2 emissions in the distant past. This draws an unsettling parallel with current climate change, but the amount of CO2 that's thought to have caused these events is far higher than the levels we're currently facing, so effects of this magnitude are considered unlikely on a short time scale.

On extremely cold winter weather

In 2021, scientists reported that the accelerated, higher-variability warming of the Arctic is causing more frequent extremely cold winter weather across parts of Asia and North America – including the February 2021 North American cold wave – via a, observed and modeled, stratospheric polar vortex disruption. However, before the study, some researchers stated that warming will make such events less likely. Such conclusions are considered to still be highly controversial.

Impacts on people

Territorial claims

Growing evidence that global warming is shrinking polar ice has added to the urgency of several nations' Arctic territorial claims in hopes of establishing resource development and new shipping lanes, in addition to protecting sovereign rights.

As ice sea coverage decreases more and more, year on year, Arctic countries (Russia, Canada, Finland, Iceland, Norway, Sweden, the United States and Denmark representing Greenland) are making moves on the geopolitical stage to ensure access to potential new shipping lanes, oil and gas reserves, leading to overlapping claims across the region. However, there is only one single land border dispute in the Arctic, with all others relating to the sea, that is Hans Island.  This small uninhabited island lies in the Nares strait, between Canada's Ellesmere Island and the northern coast of Greenland. Its status comes from its geographical position, right between the equidistant boundaries determined in a 1973 treaty between Canada and Denmark.  Even though both countries have acknowledged the possibility of splitting the island, no agreement on the island has been reached, with both nations still claiming it for themselves.

There is more activity in terms of maritime boundaries between countries, where overlapping claims for internal waters, territorial seas and particularly Exclusive Economic Zones (EEZs) can cause frictions between nations. Currently, official maritime borders have an unclaimed triangle of international waters lying between them, that is at the centerpoint of international disputes.

This unclaimed land can be obtainable by submitting a claim to the United Nations Convention on the Law of the Sea, these claims can be based on geological evidence that continental shelves extend beyond their current maritime borders and into international waters.

Some overlapping claims are still pending resolution by international bodies, such as a large portion containing the north pole that is both claimed by Denmark and Russia, with some parts of it also contested by Canada. Another example is that of the Northwest Passage, globally recognized as international waters, but technically in Canadian waters. This has led to Canada wanting to limit the number of ships that can go through for environmental reasons but the United States disputes that they have the authority to do so, favouring unlimited passage of vessels.

Impacts on indigenous peoples

As climate change speeds up, it is having more and more of a direct impact on societies around the world. This is particularly true of people that live in the Arctic, where increases in temperature are occurring at faster rates than at other latitudes in the world, and where traditional ways of living, deeply connected with the natural arctic environment are at particular risk of environmental disruption caused by these changes.

The warming of the atmosphere and ecological changes that come alongside it presents challenges to local communities such as the Inuit. Hunting, which is a major way of survival for some small communities, will be changed with increasing temperatures. The reduction of sea ice will cause certain species populations to decline or even become extinct. Inuit communities are deeply reliant on seal hunting, which is dependent on sea ice flats, where seals are hunted.

Unsuspected changes in river and snow conditions will cause herds of animals, including reindeer, to change migration patterns, calving grounds, and forage availability. In good years, some communities are fully employed by the commercial harvest of certain animals. The harvest of different animals fluctuates each year and with the rise of temperatures it is likely to continue changing and creating issues for Inuit hunters, as unpredictability and disruption of ecological cycles further complicate life in these communities, which already face significant problems, such as Inuit communities being the poorest and most unemployed of North America.

Other forms of transportation in the Arctic have seen negative impacts from the current warming, with some transportation routes and pipelines on land being disrupted by the melting of ice. Many Arctic communities rely on frozen roadways to transport supplies and travel from area to area. The changing landscape and unpredictability of weather is creating new challenges in the Arctic. Researchers have documented historical and current trails created by the Inuit in the Pan Inuit Trails Atlas, finding that the change in sea ice formation and breakup has resulted in changes to the routes of trails created by the Inuit.

Navigation

The Transpolar Sea Route is a future Arctic shipping lane running from the Atlantic Ocean to the Pacific Ocean across the center of the Arctic Ocean. The route is also sometimes called Trans-Arctic Route. In contrast to the Northeast Passage (including the Northern Sea Route) and the North-West Passage it largely avoids the territorial waters of Arctic states and lies in international high seas.

Governments and private industry have shown a growing interest in the Arctic. Major new shipping lanes are opening up: the northern sea route had 34 passages in 2011 while the Northwest Passage had 22 traverses, more than any time in history. Shipping companies may benefit from the shortened distance of these northern routes. Access to natural resources will increase, including valuable minerals and offshore oil and gas. Finding and controlling these resources will be difficult with the continually moving ice. Tourism may also increase as less sea ice will improve safety and accessibility to the Arctic.

The melting of Arctic ice caps is likely to increase traffic in and the commercial viability of the Northern Sea Route. One study, for instance, projects, "remarkable shifts in trade flows between Asia and Europe, diversion of trade within Europe, heavy shipping traffic in the Arctic and a substantial drop in Suez traffic. Projected shifts in trade also imply substantial pressure on an already threatened Arctic ecosystem."

Adaptation

Research

National

Individual countries within the Arctic zone, Canada, Denmark (Greenland), Finland, Iceland, Norway, Russia, Sweden, and the United States (Alaska) conduct independent research through a variety of organizations and agencies, public and private, such as Russia's Arctic and Antarctic Research Institute. Countries who do not have Arctic claims, but are close neighbors, conduct Arctic research as well, such as the Chinese Arctic and Antarctic Administration (CAA). The United States's National Oceanic and Atmospheric Administration (NOAA) produces an Arctic Report Card annually, containing peer-reviewed information on recent observations of environmental conditions in the Arctic relative to historical records.

International

International cooperative research between nations has become increasingly important:

Cryogenics

From Wikipedia, the free encyclopedia https://en.wikipedia.org/wiki/Cryogenics...