Search This Blog

Monday, August 29, 2022

Energy policy of China

From Wikipedia, the free encyclopedia
 
Most energy comes from coal
 
Development of carbon dioxide emissions
 
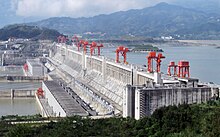
The 22,500 MW Three Gorges Dam hydroelectric power plant in China, the largest hydroelectric power station in the world.

Ensuring adequate energy supply to sustain economic growth has been a core concern of the Chinese government since 1949. The country is the world's largest emitter of greenhouse gases, and coal in China is a major cause of global warming. However, from 2010 to 2015 China reduced energy consumption per unit of GDP by 18%, and CO2 emissions per unit of GDP by 20%. On a per-capita basis, it was the world's 51st largest emitter of greenhouse gases in 2016. China is also the world's largest renewable energy producer. China is the largest producer of hydroelectricity, solar power and wind power in the world. The energy policy of China is connected to its industrial policy. The goals of China's industrial policy dictate its energy needs.   

Details for the power sector are likely to be released winter 2021/22 for the 14th five-year plan, and this is expected to determine whether the country builds more coal-fired power stations, and therefore whether global climate goals are likely to be met.

Summary

Growth in Chinese GDP and energy use since 1983
 
Energy in China

Population
(million)
Primary energy
TWh
Production
TWh
Import
TWh
Electricity
TWh
CO2 emissions
Mt
2004 1,296 18,717 17,873 1,051 2,055 4,732
2007 1,320 22,746 21,097 1,939 3,073 6,028
2008 1,326 24,614 23,182 2,148 3,252 6,508
2009 1,331 26,250 24,248 3,197 3,503 6,832
2010 1,338 28,111 25,690 3,905 3,938 7,270
Change 2004–10 3.3% 50% 44% 272% 92% 54%
Mtoe = 11.63 TWh, excludes Hong Kong.

Environment and carbon emissions

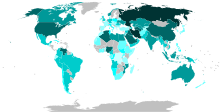
CO2 emission per year per country (2017 data)
 
Consumption-based CO2 emission per capita per year per country (2016 data)

On June 19, 2007, the Netherlands Environmental Assessment Agency announced that a preliminary study had indicated that China's greenhouse gas emissions for 2006 had exceeded those of the United States for the first time. The agency calculated that China's CO2 emissions from fossil fuels increased by 9% in 2006, while those of the United States fell by 1.4%, compared to 2005. The study used energy and cement production data from British Petroleum which they believed to be 'reasonably accurate', while warning that statistics for rapidly changing economies such as China are less reliable than data on OECD countries.

The Initial National Communication on Climate Change of the People's Republic of China calculated that carbon dioxide emissions in 2004 had risen to approximately 5.05 billion metric tons, with total greenhouse gas emissions reaching about 6.1 billion metric tons carbon dioxide equivalent.

In 2002, China ranked 2nd (after the United States) in the list of countries by carbon dioxide emissions, with emissions of 3.3 billion metric tons, representing 14.5% of the world total. In 2006, China overtook the US, producing 8% more emissions than the US to become the world's largest emitter of CO2 emissions. However per capita China was ranked 51st in CO2 emissions per capita in 2016, with emissions of 7.2 tonnes per person (compared to 15.5 tonnes per person in the United States). In addition, it has been estimated that around a third of China's carbon emissions in 2005 were due to manufacturing exported goods.

Energy use and carbon emissions by sector

In the industrial sector, six industries – electricity generation, steel, non-ferrous metals, construction materials, oil processing and chemicals – account for nearly 70% of energy use.

In the construction materials sector, China produced about 44% of the world's cement in 2006. Cement production produces more carbon emissions than any other industrial process, accounting for around 4% of global carbon emissions.

National Action Plan on Climate Change

China has been taking action on climate change for some years, with the publication on June 4, 2007, of China's first National Action Plan on Climate Change, and in that year China became the first developing country to publish a national strategy addressing global warming. The plan did not include targets for carbon dioxide emission reductions, but it has been estimated that, if fully implemented, China's annual emissions of greenhouse gases would be reduced by 1.5 billion tons of carbon dioxide equivalent by 2010. Other commentators, however, put the figure at 0.950 billion metric tons.

The publication of the strategy was officially announced during a meeting of the State Council, which called on governments and all sectors of the economy to implement the plan, and for the launch of a public environmental protection awareness campaign.

The National Action Plan includes increasing the proportion of electricity generation from renewable energy sources and from nuclear power, increasing the efficiency of coal-fired power stations, the use of cogeneration, and the development of coal-bed and coal-mine methane.

In addition, the one child policy in China has successfully slowed down the population increase, preventing 300 million births, the equivalent of 1.3 billion tons of CO2 emissions based on average world per capita emissions of 4.2 tons at 2005 level.

12th Five-year Plan 2011–2015

In January 2012, as part of its 12th Five-year Plan, China published a report 12th Five-year Plan on Greenhouse Emission Control (guofa [2011] No. 41), which establishes goals of reducing carbon intensity by 17% by 2015, compared with 2010 levels and raising energy consumption intensity by 16%, relative to GDP. More demanding targets were set for the most developed regions and those with most heavy industry, including Guangdong, Shanghai, Jiangsu, Zhejiang and Tianjin. China also plans to meet 11.4% of its primary energy requirements from non-fossil sources by 2015.

The plan will also pilot the construction of a number of low-carbon Development Zones and low-carbon residential communities, which it hopes will result in a cluster effect among businesses and consumers.

In addition, the Government will in future include data on greenhouse emissions in its official statistics.

Carbon trading scheme

In a separate development, on January 13, 2012,[23] the National Development and Reform Commission announced that the cities of Beijing, Tianjin, Shanghai, Chongqing and Shenzhen, and the provinces of Hubei and Guangdong would become the first to participate in a pilot carbon cap and trade scheme that would operate in a similar way to the European Union Emission Trading Scheme. The development follows an unsuccessful experiment with voluntary carbon exchanges that was set up in 2009 in Beijing, Shanghai and Tianjin.

Fossil fuels

A coal mine near Hailar, Inner Mongolia
 
Jinling Oil Refinery, Qixia, Nanjing
 
Oil well in Qaidam Basin, Qinghai

Coal

Coal in China (Mt) 

Production Net import Net available
2005 2,226 -47 2,179
2008 2,761 nd 2,761
2009 2,971 114 3,085
2010 3,162 157 3,319
2011 3,576 177 3,753
2015 3,527 199 3,726
Excludes Hong Kong

Coal remains the foundation of the Chinese energy system, covering close to 70 percent of the country's primary energy needs and representing 80 percent of the fuel used in electricity generation. China produces and consumes more coal than any other country. Analysis in 2016 shows that China's coal consumption appears to have peaked in 2014. According to Global Energy Monitor, China's government has limited the hours of 40% of coal-fired power stations built in 2019, due to overcapacity in electricity generation.

Petroleum

China's oil supply was 4,855 TWh in 2009 which represented 10% of the world's supply.

Although China is still a major crude oil producer, it became an oil importer in the 1990s. China became dependent on imported oil for the first time in its history in 1993 due to demand rising faster than domestic production. In 2002, annual crude petroleum production was 1,298,000,000 barrels, and annual crude petroleum consumption was 1,670,000,000 barrels. In 2006, it imported 145 million tons of crude oil, accounting for 47% of its total oil consumption. By 2014 China was importing approximately 7 mil. barrels of oil per day. Three state-owned oil companies – Sinopec, CNPC, and CNOOC – dominate its domestic market.

China announced on June 20, 2008, plans to raise petrol, diesel and aviation kerosene prices. This decision appeared to reflect a need to reduce the unsustainably high level of subsidies these fuels attract, given the global trend in the price of oil.

Top oil producers were in 2010: Russia 502 Mt (13%), Saudi Arabia 471 Mt (12%), US 336 Mt (8%), Iran 227 Mt (6%), China 200 Mt (5%), Canada 159 Mt (4%), Mexico 144 Mt (4%), UAE 129 Mt (3%). The world oil production increased from 2005 to 2010 1.3% and from 2009 to 2010 3.4%.

Natural gas

Countries by natural gas proven reserves (2014), based on data from The World Factbook

China's natural gas supply was 1,015 TWh in 2009 that was 3% of the world supply.

CNPC, Sinopec, and CNOOC are all active in the upstream gas sector, as well as in LNG import, and in midstream pipelines. Branch pipelines and urban networks are run by city gas companies including China Gas Holdings, ENN Energy, Towngas China, Beijing Enterprises Holdings and Kunlun Energy.

China was top seventh in natural gas production in 2010.

Issued by China's State Council in September 2013, China's Action Plan for the Prevention and Control of Air Pollution illustrates government desire to increase the share of natural gas in China's energy mix. In May 2014 China signed a 30-year deal with Russia to deliver 38 billion cubic metres of natural gas each year. The Power of Siberia pipeline is designed to reduce China's dependence on coal, which is more carbon intensive and causes more pollution than natural gas. The proposed western gas route from Russia's West Siberian petroleum basin to North-Western China is known as Power of Siberia 2.

In November 2021, U.S. producer Venture Global LNG signed a twenty-year contract with China's state-owned Sinopec to supply liquefied natural gas (LNG). China's imports of U.S. natural gas would more than double.

Electricity generation

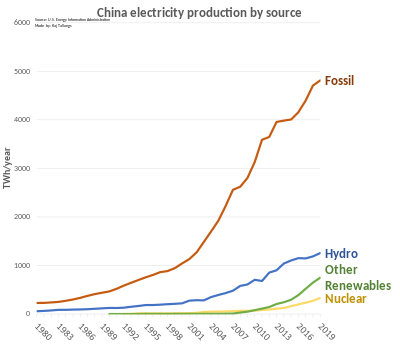
Electricity production in China by source
 
Liujiaxia Dam in Gansu, China.


In 2013, China's total annual electricity output was 5.398 trillion kWh and the annual consumption was 5.380 trillion kWh with an installed capacity of 1247 GW (all the largest in the world). 

This is an increase from 2009, when China's total annual electricity output was 3.71465 trillion kWh, and the annual consumption was 3.6430 trillion kWh (second largest in the world). In the same year, the total installed electricity generating capacity was 874 GW. China is undertaking substantial long-distance transmission projects with record breaking capacities, and has the goal of achieving an integrated nationwide grid in the period between 2015 and 2020.

Coal

In 2015, China generated 73% of its electricity from coal-fired power stations, which has been dropping from a peak of 81% in 2007.

Coal electricity in China (TWh) 

From coal Total %
2004 1,713 2,200 78%

2007 2,656 3,279 81%
2008 2,733 3,457 79%
2009 2,913 3,696 79%
2010 3,273 4,208 78%
2011 3,724 4,715 79%
2012 3,850 4,937 78%
2013 4,200 5,398 78%
2014 4,354 5,583 78%
2015 4,115 5,666 73%

Renewables

China is the world's leading renewable energy producer, with an installed capacity of 152 GW. China has been investing heavily in the renewable energy field in recent years. In 2007, the total renewable energy investment was US$12 billion, second only to Germany. In 2012, China invested US$65.1 billion in clean energy (20% more than in 2011), fully 30% of the total investment by the G-20, including 25% (US$31.2 billion) of global solar energy investment, 37% percent (US$27.2 billion) of global wind energy investment, and 47% (US$6.3 billion) of global investment in "other renewable energy" (small hydro, geothermal, marine, and biomass); 23 GW of clean generation capacity was installed.

China is also the largest producer of wind turbines and solar panels. Approximately 7% of China's energy was from renewable sources in 2006, a figure targeted to rise to 10% by 2010 and to 16% by 2020. The major renewable energy source in China is hydropower. Total hydro-electric output in China in 2009 was 615.64 TWh, constituting 16.6% of all electricity generated. The country already has the most hydro-electric capacity in the world, and the Three Gorges Dam is currently the largest hydro-electric power station in the world, with a total capacity of 22.5 GW. It has been in full operation since May 2012.

Nuclear power

In 2012, China had 15 nuclear power units with a total electric capacity of 11 GW and total output of 54.8 billion kWh, accounting for 1.9% country's total electricity output. This rose to 17 reactors in 2013. By 2016 the number of operating nuclear reactors was 32 with 22 under construction and other dozen to start construction this year. There are plans to increase nuclear power capacity and nuclear power percentage, bringing the total electricity output to 86 GW and 4% respectively by 2020. Plans are to increase this to 200 GWe by 2030, and 400 GWe by 2050. China has set an end-of-the-Century goal 1500GWs of nuclear energy, most of this from fast reactors. China has 32 reactors under construction, the highest number in the world.

Rural electrification

Following the completion of the similar Township Electrification Program in 2005, the Village Electrification Program plans to provide renewable electricity to 3.5 million households in 10,000 villages by 2010. This is to be followed by full rural electrification using renewable energy by 2015.

Renewable energy sources

Although a majority of the renewable energy in China is from hydropower, other renewable energy sources are in rapid development. In 2006, a total of 10 billion US dollars had been invested in renewable energy, second only to Germany.

Bioenergy

Jatropha curcas is to be grown for biofuel production
 

In 2006, 16 million tons of corn have been used to produce a first generation biofuel (ethanol). However, because food prices in China rose sharply during 2007, China has decided to ban the further expansion of the corn ethanol industry.

On February 7, a spokesman for the State Forestry Administration announced that 130,000 square kilometres (50,000 sq mi) would be devoted to biofuel production. Under an agreement reached with PetroChina in January 2007, 400 square kilometres of Jatropha curcas is to be grown for biodiesel production. Local governments are also developing oilseed projects. There were concerns that such developments may lead to environmental damage.

In 2018, The Telegraph reported that the biofuel industry is further on the rise. There also seems to be considerable interest in biofuels (i.e. biodiesel, green jet fuel, ...) which use waste material as the input source (second generation biofuel).

Solar power

China has become the world's largest consumer of solar energy. It is the largest producer of solar water heaters, accounting for 60 percent of the world's solar hot water heating capacity, and the total installed heaters is estimated at 30 million households. Solar PV production in China is also in rapid development. In 2007, 0.82 GW of Solar PV was produced, second only to Japan.

As part of the stimulus plan of "Golden Sun", announced by the government in 2009, several developments and projects became part of the milestones for the development of solar technology in China. These include the agreement signed by LDK for a 500MW solar project, a new thin film solar plant developed by Anwell Technologies in Henan province using its own proprietary solar technology and the solar power plant project in a desert, headed by First Solar and Ordos City. The effort to drive the renewable energy use in China was further assured after the speech by the Chinese President, given at the UN climate summit on 22 Sept 2009 in New York, pledging that China will plan to have 15% of its energy from renewable sources within a decade. China is using solar power in houses, buildings, and cars.

Wind power

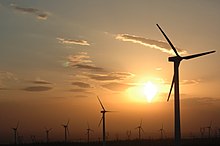
Huitengxile wind farm, Inner Mongolia, China
 

China's total wind power capacity reached 2.67 gigawatts (GW) in 2006 and 44.7 GW by 2010. This figure reached 281 GW in 2020, an increase of 71.6 GW on the previous year.

Energy conservation

General work plan

Officials were warned that violating energy conservation and environmental protection laws would lead to criminal proceedings, while failure to achieve targets would be taken into account in the performance assessment of officials and business leaders.

After achieving less than half the 4% reduction in energy intensity targeted for 2006, all companies and local and national government were asked to submit detailed plans for compliance before June 30, 2007.

During the first four years of the plan, energy intensity improved by 14.4%, but dropped sharply in the first quarter of 2010. In August 2010, China announced the closing of 2,087 steel mills, cement works and other energy-intensive factories by September 30, 2010. The factory closings were made more palatable by a labor shortage in much of China making it easier for workers to find other jobs.

Space heating and air conditioning

A State Council circular issued on June 3, 2007, restricts the temperature of air conditioning in public buildings to no lower than 26 °C in summer (78.8 °F), and of heating to no higher than 20 °C (68 °F) in winter. The sale of inefficient air conditioning units has also been outlawed.

Businesspeople

Chinese billionaires in energy business by Forbes included in 2013 Wang Yusuo & family ($2.4 B) the chairman of ENN Group, one of China's largest non-government-controlled energy businesses and Huo Qinghua ( $1.1 B) chairman of China Kingho Energy Group, one of the country's largest privately held mining and energy companies, with operations in China, Africa and Mongolia. and in Hong Kong Sit Kwong Lam ($1.35 B) the founder and chairman of Hong Kong-listed Brightoil Petroleum.

Public opinion

The Chinese results from the 1st Annual World Environment Review, published on June 5, 2007, revealed that, in a sample of 1024 people (50% male):

  • 88% are concerned about climate change.
  • 97% think their Government should do more to tackle global warming.
  • 63% think that China is too dependent on fossil fuels.
  • 56% think that China is too reliant on foreign oil.
  • 91% think that a minimum 25% of electricity should be generated from renewable energy sources.
  • 61% are concerned about nuclear power.
  • 79% are concerned about carbon dioxide emissions from developing countries.
  • 62% think it appropriate for developed countries to demand restrictions on carbon dioxide emissions from developing countries.

Another survey published in August 2007 by China Youth Daily and the British Council sampled 2,500 Chinese people with an average age of 30.1. It showed that 80% of young Chinese are concerned about global warming.

Protests

In December 2011 in Haimen, Guangdong, a coastal town of about 120,000 people, residents have protested ongoing for three days (22.12.2011) against plans for another coal-fired power plant. Police were armed with batons and shields and fired teargas to break up demonstrations.

Biobased economy

From Wikipedia, the free encyclopedia

Biobased economy, bioeconomy or biotechonomy is economic activity involving the use of biotechnology and biomass in the production of goods, services, or energy. The terms are widely used by regional development agencies, national and international organizations, and biotechnology companies. They are closely linked to the evolution of the biotechnology industry and the capacity to study, understand, and manipulate genetic material that has been possible due to scientific research and technological development. This includes the application of scientific and technological developments to agriculture, health, chemical, and energy industries.

The terms bioeconomy (BE) and bio-based economy (BBE) are sometimes used interchangeably. However, it is worth to distinguish them: the biobased economy takes into consideration the production of non-food goods, whilst bioeconomy covers both bio-based economy and the production and use of food and feed.

Origins and definitions

Bioeconomy has large variety of definitions. The bioeconomy comprises those parts of the economy that use renewable biological resources from land and sea – such as crops, forests, fish, animals and micro-organisms – to produce food, health, materials, products, textiles and energy. The definitions and usage does however vary between different areas of the world. 

In 2010 it was defined in the report “The Knowledge Based Bio-Economy (KBBE) in Europe: Achievements and Challenges” by Albrecht & al. as follows: The bio-economy is the sustainable production and conversion of biomass, for a range of food, health, fibre and industrial products and energy, where renewable biomass encompasses any biological material to be used as raw material.”

The First Global Bioeconomy Summit in Berlin in November 2015 defines bioeconomy as “knowledge-based production and utilization of biological resources, biological processes and principles to sustainably provide goods and services across all economic sectors”. According to the summit, bioeconomy involves three elements: renewable biomass, enabling and converging technologies, and integration across applications concerning primary production (i.e. all living natural resources), health (i.e. pharmaceuticals and medical devices), and industry (i.e. chemicals, plastics, enzymes, pulp and paper, bioenergy).

The term 'biotechonomy' was used by Juan Enríquez and Rodrigo Martinez  at the Genomics Seminar in the 1997 AAAS meeting. An excerpt of this paper was published in Science."

An important aspect of the bioeconomy is understanding mechanisms and processes at the genetic, molecular, and genomic levels, and applying this understanding to creating or improving industrial processes, developing new products and services, and producing new energy. Bioeconomy aims to reduce our dependence on fossil natural resources, to prevent biodiversity loss and to create new economic growth and jobs that are in line with the principles of sustainable development.

History

Enríquez and Martinez' 2002 Harvard Business School working paper, "Biotechonomy 1.0: A Rough Map of Biodata Flow", showed the global flow of genetic material into and out of the three largest public genetic databases: GenBank, EMBL and DDBJ. The authors then hypothesized about the economic impact that such data flows might have on patent creation, evolution of biotech startups and licensing fees. An adaptation of this paper was published in Wired magazine in 2003.

The term 'bioeconomy' became popular from the mid-2000s with its adoption by the European Union and Organisation for Economic Co-operation and Development as a policy agenda and framework to promote the use of biotechnology to develop new products, markets, and uses of biomass. Since then, both the EU (2012) and OECD (2006) have created dedicated bioeconomy strategies, as have an increasing number of countries around the world. Often these strategies conflate the bioeconomy with the term 'bio-based economy'. For example, since 2005 the Netherlands has sought to promote the creation of a biobased economy. Pilot plants have been started i.e. in Lelystad (Zeafuels), and a centralised organisation exists (Interdepartementaal programma biobased economy), with supporting research (Food & Biobased Research) being conducted. Other European countries have also developed and implemented bioeconomy or bio-based economy policy strategies and frameworks.

In 2012 president Barack Obama of the USA announced intentions to encourage biological manufacturing methods, with a National Bioeconomy Blueprint.

Aims

Global population growth and over consumption of many resources are causing increasing environmental pressure and climate change. Bioeconomy tackles with these challenges. It aims to ensure food security and to promote more sustainable natural resource use as well as to reduce the dependence on non-renewable resources, e.g. fossil natural resources and minerals. In some extent bioeconomy also helps economy to reduces greenhouse gas emissions and assists in mitigating and adapting to climate change.

Genetic modification

Organisms, ranging from bacteria over yeasts up to plants are used for production of enzymatic catalysis. Genetically modified bacteria have been used to produce insulin, artemisinic acid was made in engineered yeast. Some bioplastics (based on polyhydroxylbutyrate or polyhydroxylalkanoates are produced from sugar using genetically modified microbes.

Genetically modified organisms are also used for the production of biofuels. Biofuels are a type of carbon-neutral fuel.

Research is also being done towards CO2 fixation using a synthetic metabolic pathway. By genetically modifying E. coli bacteria so as to allow them to consume CO2, the bacterium may provide the infrastructure for the future renewable production of food and green fuels.

One of the organisms (Ideonella sakaiensis) that is able to break down PET (a plastic) into other substances has been genetically modified to break down PET even faster and also break down PEF. Once plastics (which are normally non-biodegradable) are broken down and recycled into other substances (i.e. biomatter in the case of Tenebrio molitor larvae) it can be used as an input for other animals.

Genetically modified crops are also used. Genetically modified energy crops for instance may provide some additional advantages such as reduced associated costs (i.e. costs during the manufacturing process) and less water use. One example are trees have been genetically modified to either have less lignin, or to express lignin with chemically labile bonds.

With genetically modified crops however, there are still some challenges involved (hurdles to regulatory approvals, market adoption and public acceptance).

Fields

According to European Union Bioeconomy Strategy updated in 2018 the bioeconomy covers all sectors and systems that rely on biological resources (animals, plants, micro-organisms and derived biomass, including organic waste), their functions and principles. It covers all primary production and economic and industrial sectors that base on use, production or processing biological resources from agriculture, forestry, fisheries and aquaculture. The product of bioeconomy are typically food, feed and other biobased products, bioenergy and services based on biological resources. The bioeconomy aims to drive towards sustainability, circularity as well as the protection of the environment and will enhance biodiversity.

In some definitions, bioeconomy comprises also ecosystem services that are services offered by the environment, including binding carbon dioxide and opportunities for recreation. Another key aspect of the bioeconomy is not wasting natural resources but using and recycling them efficiently.

According to EU Bioeconomy Report 2016, the bioeconomy brings together various sectors of the economy that produce, process and reuse renewable biological resources (agriculture, forestry, fisheries, food, bio-based chemicals and materials and bioenergy).

Agriculture

Cellular agriculture focuses on the production of agriculture products from cell cultures using a combination of biotechnology, tissue engineering, molecular biology, and synthetic biology to create and design new methods of producing proteins, fats, and tissues that would otherwise come from traditional agriculture. Most of the industry is focused on animal products such as meat, milk, and eggs, produced in cell culture rather than raising and slaughtering farmed livestock which is associated with substantial global problems of detrimental environmental impacts (e.g. of meat production), animal welfare, food security and human health. Cellular agriculture is field of the biobased economy. The most well known cellular agriculture concept is cultured meat. (Full article...)

However, not all synthetic nutrition products are animal food products – for instance, as of 2021 there are also products of synthetic coffee that are reported to be close to commercialization. Similar fields of research and production based on bioeconomy agriculture are:

Many of the foods produced with tools and methods of the bioeconomy may not be intended for human consumption but for non-human animals such as for livestock feed, insect-based pet food or sustainable aquacultural feed.

Moreover, crops could be genetically engineered in ways that e.g. safely increase yields, reduce the need for pesticides or ease indoor production.

One example of a product highly specific to the bioeconomy that is widely available is algae oil which is a dietary supplement that could substitute fish oil supplements.

Waste management, recycling and biomining

Biobased applications, research and development of waste management may form a part of the bioeconomy. Bio-based recycling (e-waste, plastics recycling, etc.) is linked to waste management and relevant standards and requirements of production and products. Some of the recycling of waste may be biomining and some biomining could be applied beyond recycling.

For example, in 2020, biotechnologists reported the genetically engineered refinement and mechanical description of synergistic enzymes – PETase, first discovered in 2016, and MHETase of Ideonella sakaiensis – for faster depolymerization of PET and also of PEF, which may be useful for depollution, recycling and upcycling of mixed plastics along with other approaches. Such approaches may be more environmentally-friendly as well as cost-effective than mechanical and chemical PET-recycling, enabling circular plastic bio-economy solutions via systems based on engineered strains. Moreover, microorganisms could be employed to mine useful elements from basalt rocks via bioleaching.

Medicine, nutritional science and the health economy

In 2020, the global industry for dietary supplements was valued at $140.3 billion by a "Grand View Research" analysis. Certain parts of the health economy may overlap with the bioeconomy, including anti-aging- and life extension-related products and activities, hygiene/beauty products, functional food, sports performance related products and bio-based tests (such as of one's microbiota) and banks (such as stool banks and DNA databases), all of which can in turn be used for individualized interventions, monitoring as well as for the development of new products. The pharmaceutical sector, including the research and development of new antibiotics, can also be considered to be a bioeconomy sector.

Forest bioeconomy

The forest bioeconomy is based on forests and their natural resources, and covers a variety of different industry and production processes. Forest bioeconomy includes, for example, the processing of forest biomass to provide products relating to, energy, chemistry, or the food industry. Thus, forest bioeconomy covers a variety of different manufacturing processes that are based on wood material and the range of end products is wide.

Besides different wood-based products, recreation, nature tourism and game are a crucial part of forest bioeconomy. Carbon sequestration and ecosystem services are also included in the concept of forest bioeconomy.

Pulp, paper, packaging materials and sawn timber are the traditional products of the forest industry. Wood is also traditionally used in furniture and construction industries. But in addition to these, as a renewable natural resource, ingredients from wood can be valorised into innovative bioproducts alongside a range of conventional forest industry products. Thus, traditional mill sites of large forest industry companies, for example in Finland, are in the process of becoming biorefineries. In different processes, forest biomass is used to produce textiles, chemicals, cosmetics, fuels, medicine, intelligent packaging, coatings, glues, plastics, food and feed.

Blue bioeconomy

The blue bioeconomy covers businesses that are based on the sustainable use of renewable aquatic resources as well water related expertise areas. It covers the development and marketing of blue bioeconomy products and services. In that respect, the key sectors include business activities based on water expertise and technology, water-based tourism, making use of aquatic biomass, and the value chain of fisheries. Furthermore, the immaterial value of aquatic natural resources is also very high. Water areas have also other values beyond being platforms of economic activities. It provides human well-being, recreation and health.

According to the European Union the blue bioeconomy has the focus on aquatic or marine environments, especially, on novel aquaculture applications, including non-food, food and feed.

In the European Report on the Blue Growth Strategy - Towards more sustainable growth and jobs in the blue economy (2017) the blue bioeconomy is defined differently to the blue economy. The blue economy means the industries that are related to marine environment activities, e.g. shipbuilding, transport, coastal tourism, renewable energies (such as off-shore windmills), living and non-living resources.

Energy

The bioeconomy also includes bioenergy, biohydrogen, biofuel and algae fuel.

According to World Bioenergy Association 17.8 % out of gross final energy consumption was covered with renewable energy. Among renewable energy sources, bioenergy (energy from bio-based sources) is the largest renewable energy source. In 2017, bioenergy accounted for 70% of renewable energy consumption.

The role of bioenergy varies in different countries and continents. In Africa it is the most important energy sources with the share of 96%. Bioenergy has significant shares in energy production in the Americas (59%), Asia (65%) and Europe (59%). The bioenergy is produced out of a large variety of biomass from forestry, agriculture and waste and side streams of industries to produce useful end products (pellets, wood chips, bioethanol, biogas and biodiesel) for electricity, heat and transportation fuel around the world.

Biomass is a renewable natural resource but it is still a limited resource. Globally there are huge resources, but environmental, social and economic aspects limit their use. Biomass can play an important role for low-carbon solutions in the fields of customer supplies, energy, food and feed. In practice, there are many competing uses.

The biobased economy uses first-generation biomass (crops), second-generation biomass (crop refuge), and third-generation biomass (seaweed, algae). Several methods of processing are then used (in biorefineries) to gather the most out of the biomass. This includes techniques such as

Anaerobic digestion is generally used to produce biogas, fermentation of sugars produces ethanol, pyrolysis is used to produce pyrolysis-oil (which is solidified biogas), and torrefaction is used to create biomass-coal. Biomass-coal and biogas is then burnt for energy production, ethanol can be used as a (vehicle)-fuel, as well as for other purposes, such as skincare products.

Getting the most out of the biomass

For economic reasons, the processing of the biomass is done according to a specific pattern (a process called cascading). This pattern depends on the types of biomass used. The whole of finding the most suitable pattern is known as biorefining. A general list shows the products with high added value and lowest volume of biomass to the products with the lowest added value and highest volume of biomass:

  • fine chemicals/medicines
  • food
  • chemicals/bioplastics
  • transport fuels
  • electricity and heat

Other fields and applications

Bioproducts or bio-based products are products that are made from biomass. The term “bioproduct” refers to a wide array of industrial and commercial products that are characterized by a variety of properties, compositions and processes, as well as different benefits and risks.

Bio-based products are developed in order to reduce dependency on fossil fuels and non-renewable resources. To achieve this, the key is to develop new bio-refining technologies to sustainably transform renewable natural resources into bio-based products, materials and fuels, e.g.

Nanoparticles, artificial cells and micro-droplets

Synthetic biology can be used for creating nanoparticles which can be used for drug-delivery as well as for other purposes. Complementing research and development seeks to and has created synthetic cells that mimics functions of biological cells. Applications include medicine such as designer-nanoparticles that make blood cells eat away – from the inside out – portions of atherosclerotic plaque that cause heart attacks. Synthetic micro-droplets for algal cells or synergistic algal-bacterial multicellular spheroid microbial reactors, for example, could be used to produce hydrogen as hydrogen economy biotechnology.

Climate change adaptation

Activities and technologies for bio-based climate change adaptation could be considered as part of the bioeconomy and may include artificial assistance to make coral reefs more resilient against climate change such as via application of probiotics.

Materials

There is a potential for biobased-production of building materials (insulation, surface materials, etc.) as well as new materials in general (polymers, plastics, composites, etc.). Photosynthetic microbial cells have been used as a step to synthetic production of spider silk.

Bioplastics

Bioplastics are not just one single material. They comprise a whole family of materials with different properties and applications. According to European Bioplastics, a plastic material is defined as a bioplastic if it is either bio-based plastic, biodegradable plastic, or is a material with both properties. Bioplastics have the same properties as conventional plastics and offer additional advantages, such as a reduced carbon footprint or additional waste management options, such as composting.

Bioplastics are divided into three main groups:

  • Bio-based or partially bio-based non-biodegradable plastics such as bio-based PE, PP, or PET (so-called drop-ins) and bio-based technical performance polymers such as PTT or TPC-ET
  • Plastics that are both bio-based and biodegradable, such as PLA and PHA or PBS
  • Plastics that are based on fossil resources and are biodegradable, such as PBAT

Additionally, new materials such as PLA, PHA, cellulose or starch-based materials offer solutions with completely new functionalities such as biodegradability and compostability, and in some cases optimized barrier properties. Along with the growth in variety of bioplastic materials, properties such as flexibility, durability, printability, transparency, barrier, heat resistance, gloss and many more have been significantly enhanced.

Bioplastics have been made from sugarbeet, by bacteria.

Examples of bioplastics
  • Paptic: There are packaging materials which combine the qualities of paper and plastic. For example, Paptic is produced from wood-based fibre that contains more than 70% wood. The material is formed with foam-forming technology that saves raw material and improves the qualities of the material. The material can be produced as reels, which enables it to be delivered with existing mills. The material is spatter-proof but is decomposed when put under water. It is more durable than paper and maintains its shape better than plastic. The material is recycled with cardboards.
Examples of bio-composites
  • Sulapac tins are made from wood chips and biodegradable natural binder and they have features similar to plastic. These packaging products tolerate water and fats, and they do not allow oxygen to pass. Sulapac products combine ecology, luxury and are not subject to design limitations. Sulapac can compete with traditional plastic tins by cost and is suitable for the same packing devices.
  • Woodio produces wood composite sinks and other bathroom furniture. The composite is produced by moulding a mixture of wood chips and crystal clear binder. Woodio has developed a solid wood composite that is entirely waterproof. The material has similar features to ceramic, but can be used for producing energy at the end of its lifespan, unlike ceramic waste. Solid wood composite is hard and can be moulded with wooden tools.
  • Woodcast is a renewable and biodegradable casting material. It is produced from woodchips and biodegradable plastic. It is hard and durable in room temperature but when heated is flexible and self-sticky. Woodcast can be applied to all plastering and supporting elements. The material is breathable and X-ray transparent. It is used in plastering and in occupational therapy and can be moulded to any anatomical shape. Excess pieces can be reused: used casts can be disposed of either as energy or biowaste. The composite differs from traditional lime cast in that it doesn’t need water and it is non-toxic. Therefore gas-masks, gauntlets or suction fans are not required when handling the cast.

Textiles

The textile industry, or certain activities and elements of it, could be considered to be a strong global bioeconomy sector. Textiles are produced from natural fibres, regenerated fibres and synthetic fibres (Sinclair 2014). The natural fibre textile industry is based on cotton, linen, bamboo, hemp, wool, silk, angora, mohair and cashmere.

Activities related to textile production and processing that more clearly fall under the domain of the bioeconomy are developments such as the biofabrication of leather-like material using fungi.

Textile fibres can be formed in chemical processes from bio-based materials. These fibres are called bio-based regenerated fibres. The oldest regenerated fibres are viscose and rayon, produced in the 19th century. The first industrial processes used a large amount of wood as raw material, as well as harmful chemicals and water. Later the process of regenerating fibres developed to reduce the use of raw materials, chemicals, water and energy.

In the 1990s the first more sustainable regenerated fibres, e.g. Lyocell, entered the market with the commercial name of Tencel. The production process uses wood cellulose and it processes the fibre without harmful chemicals.

The next generation of regenerated fibres are under development. The production processes use less or no chemicals, and the water consumption is also diminished.

Issues

Degrowth, green growth and circular economy

The bioeconomy has largely been associated with visions of "green growth". A study found that a "circular bioeconomy" may be "necessary to build a carbon neutral future in line with the climate objectives of the Paris Agreement". However, some are concerned that with a focus or reliance on technological progress a fundamentally unsustainable socioeconomic model might be maintained rather than be changed. Some are concerned it that may not lead to a ecologization of the economy but to an economization of the biological, "the living" and caution that potentials of non-bio-based techniques to achieve greater sustainability need to be considered. A study found that the, as of 2019, current EU interpretation of the bioeconomy is "diametrically opposite to the original narrative of Baranoff and Georgescu-Roegen that told us that expanding the share of activities based on renewable resources in the economy would slow down economic growth and set strict limits on the overall expansion of the economy". Furthermore, some caution that "Silicon Valley and food corporations" could use bioeconomy technologies for greenwashing and monopoly-concentrations. The bioeconomy, its potentials, disruptive new modes of production and innovations may distract from the need for systemic structural socioeconomic changes and provide a false illusion of technocapitalist utopianism/optimism that suggests technological fixes may make it possible to sustain contemporary patterns and structures.

Unemployment and work reallocation

Many farmers depend on conventional methods of producing crops and many of them live in developing economies. Cellular agriculture for products such as synthetic coffee could, if the contemporary socioeconomic context (the socioeconomic system's mechanisms such as incentives and resource distribution mechanisms like markets) remains unaltered (e.g. in nature, purposes, scopes, limits and degrees), threaten their employment and livelihoods as well as the respective nation's economy and social stability. A study concluded that "given the expertise required and the high investment costs of the innovation, it seems unlikely that cultured meat immediately benefits the poor in developing countries" and emphasized that animal agriculture is often essential for the subsistence for farmers in poor countries. However, not only developing countries may be affected.

Patents, intellectual property and monopolies

Observers worry that the bioeconomy will become as opaque and free of accountability as the industry it attempts to replace, that is the current food system. The fear is that its core products will be mass-produced, nutritionally dubious meat sold at the homogeneous fast-food joints of the future.

The medical community has warned that gene patents can inhibit the practice of medicine and progress of science. This can also apply to other areas where patents and private intellectual property licenses are being used, often entirely preventing the use and continued development of knowledge and techniques for many years or decades. On the other hand, some worry that without intellectual property protection as the type of R&D-incentive, particularly to current degrees and extents, companies would no longer have the resources or motives/incentives to perform competitive, viable biotech research – as otherwise they may not be able to generate sufficient returns from initial R&D investment or less returns than from other expenditures that are possible. "Biopiracy" refers to "the use of intellectual property systems to legitimize the exclusive ownership and control over biological resources and biological products that have been used over centuries in non-industrialized cultures".

Rather than leading to sustainable, healthy, inexpensive, safe, accessible food being produced with little labor locally – after knowledge- and technology transfer and timely, efficient innovation – the bioeconomy may lead to aggressive monopoly-formation and exacerbated inequality. For instance, while production costs may be minimal, costs – including of medicine – may be high.

Innovation management, public spending and governance

It has been argued that public investment would be a tool governments should use to regulate and license cellular agriculture. Private firms and venture capital would likely seek to maximise investor value rather than social welfare. Moreover, radical innovation is considered to be more risky, "and likely involves more information asymmetry, so that private financial markets may imperfectly manage these frictions". Governments may also help to coordinate "since several innovators may be needed to push the knowledge frontier and make the market profitable, but no single company wants to make the early necessary investments". They could also help innovators that lack the network "to naturally obtain the visibility and political influence necessary to obtain public funds" and could help determine relevant laws.

In popular media

Biopunk is a genre of science fiction, so called due to similarity with cyberpunk, that often thematizes the bioeconomy as well as its issues and technologies. The novel The Windup Girl portrays a world of society driven by a ruthless bioeconomy and ailing under climate change. In the more recent novel Change Agent prevalent black market clinics offer wealthy people unauthorized genetic human enhancement services and custom narcotics are 3D-printed locally or smuggled with soft robots. Solarpunk is another emerging genre that focuses on the relationship between human societies and the environment and also addresses many of the bioeconomy's issues and technologies such as genetic engineering, synthetic meat and commodification.

Factorial experiment

From Wikipedia, the free encyclopedia

Designed experiments with full factorial design (left), response surface with second-degree polynomial (right)

In statistics, a full factorial experiment is an experiment whose design consists of two or more factors, each with discrete possible values or "levels", and whose experimental units take on all possible combinations of these levels across all such factors. A full factorial design may also be called a fully crossed design. Such an experiment allows the investigator to study the effect of each factor on the response variable, as well as the effects of interactions between factors on the response variable.

For the vast majority of factorial experiments, each factor has only two levels. For example, with two factors each taking two levels, a factorial experiment would have four treatment combinations in total, and is usually called a 2×2 factorial design. In such a design, the interaction between the variables is often the most important. This applies even to scenarios where a main effect and an interaction is present.

If the number of combinations in a full factorial design is too high to be logistically feasible, a fractional factorial design may be done, in which some of the possible combinations (usually at least half) are omitted.

History

Factorial designs were used in the 19th century by John Bennet Lawes and Joseph Henry Gilbert of the Rothamsted Experimental Station.

Ronald Fisher argued in 1926 that "complex" designs (such as factorial designs) were more efficient than studying one factor at a time. Fisher wrote,

"No aphorism is more frequently repeated in connection with field trials, than that we must ask Nature few questions, or, ideally, one question, at a time. The writer is convinced that this view is wholly mistaken."

Nature, he suggests, will best respond to "a logical and carefully thought out questionnaire". A factorial design allows the effect of several factors and even interactions between them to be determined with the same number of trials as are necessary to determine any one of the effects by itself with the same degree of accuracy.

Frank Yates made significant contributions, particularly in the analysis of designs, by the Yates analysis.

The term "factorial" may not have been used in print before 1935, when Fisher used it in his book The Design of Experiments.

Advantages of factorial experiments

Many people examine the effect of only a single factor or variable. Compared to such one-factor-at-a-time (OFAT) experiments, factorial experiments offer several advantages:

  • Factorial designs are more efficient than OFAT experiments. They provide more information at similar or lower cost. They can find optimal conditions faster than OFAT experiments.
  • Factorial designs allow additional factors to be examined at no additional cost.
  • When the effect of one factor is different for different levels of another factor, it cannot be detected by an OFAT experiment design. Factorial designs are required to detect such interactions. Use of OFAT when interactions are present can lead to serious misunderstanding of how the response changes with the factors.
  • Factorial designs allow the effects of a factor to be estimated at several levels of the other factors, yielding conclusions that are valid over a range of experimental conditions.

Example of advantages of factorial experiments

In his book, Improving Almost Anything: Ideas and Essays, statistician George Box gives many examples of the benefits of factorial experiments. Here is one. Engineers at the bearing manufacturer SKF wanted to know if changing to a less expensive "cage" design would affect bearing life. The engineers asked Christer Hellstrand, a statistician, for help in designing the experiment.

Cube plot for bearing life.svg

Box reports the following. "The results were assessed by an accelerated life test. … The runs were expensive because they needed to be made on an actual production line and the experimenters were planning to make four runs with the standard cage and four with the modified cage. Christer asked if there were other factors they would like to test. They said there were, but that making added runs would exceed their budget. Christer showed them how they could test two additional factors "for free" – without increasing the number of runs and without reducing the accuracy of their estimate of the cage effect. In this arrangement, called a 2×2×2 factorial design, each of the three factors would be run at two levels and all the eight possible combinations included. The various combinations can conveniently be shown as the vertices of a cube ... " "In each case, the standard condition is indicated by a minus sign and the modified condition by a plus sign. The factors changed were heat treatment, outer ring osculation, and cage design. The numbers show the relative lengths of lives of the bearings. If you look at [the cube plot], you can see that the choice of cage design did not make a lot of difference. … But, if you average the pairs of numbers for cage design, you get the [table below], which shows what the two other factors did. … It led to the extraordinary discovery that, in this particular application, the life of a bearing can be increased fivefold if the two factor(s) outer ring osculation and inner ring heat treatments are increased together."

"Remembering that bearings like this one have been made for decades, it is at first surprising that it could take so long to discover so important an improvement. A likely explanation is that, because most engineers have, until recently, employed only one factor at a time experimentation, interaction effects have been missed."

Example

The simplest factorial experiment contains two levels for each of two factors. Suppose an engineer wishes to study the total power used by each of two different motors, A and B, running at each of two different speeds, 2000 or 3000 RPM. The factorial experiment would consist of four experimental units: motor A at 2000 RPM, motor B at 2000 RPM, motor A at 3000 RPM, and motor B at 3000 RPM. Each combination of a single level selected from every factor is present once.

This experiment is an example of a 22 (or 2×2) factorial experiment, so named because it considers two levels (the base) for each of two factors (the power or superscript), or #levels#factors, producing 22=4 factorial points.

Cube plot for factorial design

Designs can involve many independent variables. As a further example, the effects of three input variables can be evaluated in eight experimental conditions shown as the corners of a cube.

This can be conducted with or without replication, depending on its intended purpose and available resources. It will provide the effects of the three independent variables on the dependent variable and possible interactions.

Notation

The notation used to denote factorial experiments conveys a lot of information. When a design is denoted a 23 factorial, this identifies the number of factors (3); how many levels each factor has (2); and how many experimental conditions there are in the design (23 = 8). Similarly, a 25 design has five factors, each with two levels, and 25 = 32 experimental conditions. Factorial experiments can involve factors with different numbers of levels. A 243 design has five factors, four with two levels and one with three levels, and has 16 × 3 = 48 experimental conditions. 

To save space, the points in a two-level factorial experiment are often abbreviated with strings of plus and minus signs. The strings have as many symbols as factors, and their values dictate the level of each factor: conventionally, for the first (or low) level, and for the second (or high) level. The points in this experiment can thus be represented as , , , and .

The factorial points can also be abbreviated by (1), a, b, and ab, where the presence of a letter indicates that the specified factor is at its high (or second) level and the absence of a letter indicates that the specified factor is at its low (or first) level (for example, "a" indicates that factor A is on its high setting, while all other factors are at their low (or first) setting). (1) is used to indicate that all factors are at their lowest (or first) values.

Implementation

For more than two factors, a 2k factorial experiment can usually be recursively designed from a 2k−1 factorial experiment by replicating the 2k−1 experiment, assigning the first replicate to the first (or low) level of the new factor, and the second replicate to the second (or high) level. This framework can be generalized to, e.g., designing three replicates for three level factors, etc.

A factorial experiment allows for estimation of experimental error in two ways. The experiment can be replicated, or the sparsity-of-effects principle can often be exploited. Replication is more common for small experiments and is a very reliable way of assessing experimental error. When the number of factors is large (typically more than about 5 factors, but this does vary by application), replication of the design can become operationally difficult. In these cases, it is common to only run a single replicate of the design, and to assume that factor interactions of more than a certain order (say, between three or more factors) are negligible. Under this assumption, estimates of such high order interactions are estimates of an exact zero, thus really an estimate of experimental error.

When there are many factors, many experimental runs will be necessary, even without replication. For example, experimenting with 10 factors at two levels each produces 210=1024 combinations. At some point this becomes infeasible due to high cost or insufficient resources. In this case, fractional factorial designs may be used.

As with any statistical experiment, the experimental runs in a factorial experiment should be randomized to reduce the impact that bias could have on the experimental results. In practice, this can be a large operational challenge.

Factorial experiments can be used when there are more than two levels of each factor. However, the number of experimental runs required for three-level (or more) factorial designs will be considerably greater than for their two-level counterparts. Factorial designs are therefore less attractive if a researcher wishes to consider more than two levels.

Analysis

A factorial experiment can be analyzed using ANOVA or regression analysis. To compute the main effect of a factor "A", subtract the average response of all experimental runs for which A was at its low (or first) level from the average response of all experimental runs for which A was at its high (or second) level.

Other useful exploratory analysis tools for factorial experiments include main effects plots, interaction plots, Pareto plots, and a normal probability plot of the estimated effects.

When the factors are continuous, two-level factorial designs assume that the effects are linear. If a quadratic effect is expected for a factor, a more complicated experiment should be used, such as a central composite design. Optimization of factors that could have quadratic effects is the primary goal of response surface methodology.

Analysis example

Montgomery gives the following example of analysis of a factorial experiment:

An engineer would like to increase the filtration rate (output) of a process to produce a chemical, and to reduce the amount of formaldehyde used in the process. Previous attempts to reduce the formaldehyde have lowered the filtration rate. The current filtration rate is 75 gallons per hour. Four factors are considered: temperature (A), pressure (B), formaldehyde concentration (C), and stirring rate (D). Each of the four factors will be tested at two levels.

Onwards, the minus (−) and plus (+) signs will indicate whether the factor is run at a low or high level, respectively.

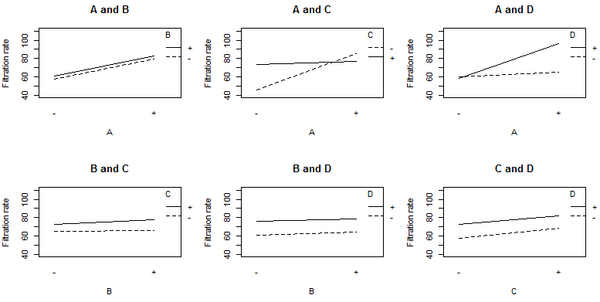
The non-parallel lines in the A:C interaction plot indicate that the effect of factor A depends on the level of factor C. A similar results holds for the A:D interaction. The graphs indicate that factor B has little effect on filtration rate. The analysis of variance (ANOVA) including all 4 factors and all possible interaction terms between them yields the coefficient estimates shown in the table below.

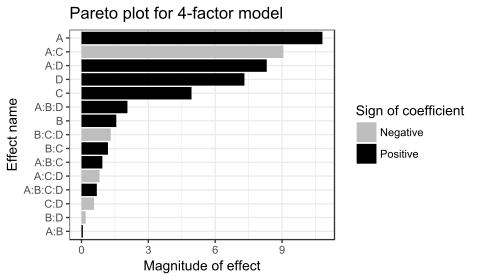
Pareto plot showing the relative magnitude of the factor coefficients.

Because there are 16 observations and 16 coefficients (intercept, main effects, and interactions), p-values cannot be calculated for this model. The coefficient values and the graphs suggest that the important factors are A, C, and D, and the interaction terms A:C and A:D.

The coefficients for A, C, and D are all positive in the ANOVA, which would suggest running the process with all three variables set to the high value. However, the main effect of each variable is the average over the levels of the other variables. The A:C interaction plot above shows that the effect of factor A depends on the level of factor C, and vice versa. Factor A (temperature) has very little effect on filtration rate when factor C is at the + level. But Factor A has a large effect on filtration rate when factor C (formaldehyde) is at the − level. The combination of A at the + level and C at the − level gives the highest filtration rate. This observation indicates how one-factor-at-a-time analyses can miss important interactions. Only by varying both factors A and C at the same time could the engineer discover that the effect of factor A depends on the level of factor C.

Cube plot for the ANOVA using factors A, C, and D, and the interaction terms A:C and A:D. The plot aids in visualizing the result and shows that the best combination is A+, D+, and C−.

The best filtration rate is seen when A and D are at the high level, and C is at the low level. This result also satisfies the objective of reducing formaldehyde (factor C). Because B does not appear to be important, it can be dropped from the model. Performing the ANOVA using factors A, C, and D, and the interaction terms A:C and A:D, gives the result shown in the following table, in which all the terms are significant (p-value < 0.05).

Bearing life vs. heat and osculation

Osculation − Osculation +
Heat − 18 23
Heat + 21 106
2×2 factorial experiment

A B
(1)
a +
b +
ab + +
Design matrix and resulting filtration rate
A B C D Filtration rate
45
+ 71
+ 48
+ + 65
+ 68
+ + 60
+ + 80
+ + + 65
+ 43
+ + 100
+ + 45
+ + + 104
+ + 75
+ + + 86
+ + + 70
+ + + + 96
ANOVA results
Coefficients Estimate
Intercept 70.063
A 10.813
B 1.563
C 4.938
D 7.313
A:B 0.063
A:C −9.063
B:C 1.188
A:D 8.313
B:D −0.188
C:D −0.563
A:B:C 0.938
A:B:D 2.063
A:C:D −0.813
B:C:D −1.313
A:B:C:D 0.688
ANOVA results
Coefficient Estimate Standard error t value p-value
Intercept 70.062 1.104 63.444 2.3 × 10−14
A 10.812 1.104 9.791 1.9 × 10−6
C 4.938 1.104 4.471 1.2 × 10−3
D 7.313 1.104 6.622 5.9 × 10−5
A:C −9.063 1.104 −8.206 9.4 × 10−6
A:D 8.312 1.104 7.527 2 × 10−5

Education

From Wikipedia, the free encyclopedia https://en.wikipedia.org/wiki/Education Education is the transmissio...