Search This Blog

Saturday, November 5, 2022

Fog

From Wikipedia, the free encyclopedia
 
View from Blassenstein mountain near Scheibbs (Lower Austria) to the west, with fog over Erlauf valley and Danube
 
A massive fog bank over Twentynine Palms, California, covers the entire city as it begins to rise and join the clouds above it.

Fog is a visible aerosol consisting of tiny water droplets or ice crystals suspended in the air at or near the Earth's surface. Fog can be considered a type of low-lying cloud usually resembling stratus, and is heavily influenced by nearby bodies of water, topography, and wind conditions. In turn, fog affects many human activities, such as shipping, travel, and warfare.

Fog appears when water vapor (water in its gaseous form) condenses. During condensation, molecules of water vapor combine to make tiny liquid water droplets that hang in the air. Sea fog, which shows up near bodies of saline water, is formed as water vapor condenses on bits of salt. Fog is similar to, but less transparent than, mist.

Definition

The term fog is typically distinguished from the more generic term cloud in that fog is low-lying, and the moisture in the fog is often generated locally (such as from a nearby body of water, like a lake or the ocean, or from nearby moist ground or marshes).

By definition, fog reduces visibility to less than 1 km (0.62 mi), whereas mist causes lesser impairment of visibility.

For aviation purposes in the United Kingdom, a visibility of less than 5 km (3.1 mi) but greater than 999 m (3,278 ft) is considered to be mist if the relative humidity is 95% or greater; below 95%, haze is reported.

Formation

Minute droplets of water constitute this after-dark radiation fog, with an ambient temperature of −2 °C (28 °F). Their motion trails are captured as streaks.
 
A close-up view of water droplets forming fog. Those outside the camera lens's depth of field appear as orbs.

Fog forms when the difference between air temperature and dew point is less than 2.5 °C (4.5 °F).

Fog begins to form when water vapor condenses into tiny water droplets that are suspended in the air. Some examples of ways that water vapor is added to the air are by wind convergence into areas of upward motion; precipitation or virga falling from above; daytime heating evaporating water from the surface of oceans, water bodies, or wet land; transpiration from plants; cool or dry air moving over warmer water; and lifting air over mountains. Water vapor normally begins to condense on condensation nuclei such as dust, ice, and salt in order to form clouds. Fog, like its elevated cousin stratus, is a stable cloud deck which tends to form when a cool, stable air mass is trapped underneath a warm air mass.

Fog normally occurs at a relative humidity near 100%. This occurs from either added moisture in the air, or falling ambient air temperature. However, fog can form at lower humidities, and can sometimes fail to form with relative humidity at 100%. At 100% relative humidity, the air cannot hold additional moisture, thus, the air will become supersaturated if additional moisture is added.

Fog commonly produces precipitation in the form of drizzle or very light snow. Drizzle occurs when the humidity of fog attains 100% and the minute cloud droplets begin to coalesce into larger droplets. This can occur when the fog layer is lifted and cooled sufficiently, or when it is forcibly compressed from above by descending air. Drizzle becomes freezing drizzle when the temperature at the surface drops below the freezing point.

The thickness of a fog layer is largely determined by the altitude of the inversion boundary, which in coastal or oceanic locales is also the top of the marine layer, above which the air mass is warmer and drier. The inversion boundary varies its altitude primarily in response to the weight of the air above it, which is measured in terms of atmospheric pressure. The marine layer, and any fog-bank it may contain, will be "squashed" when the pressure is high, and conversely, may expand upwards when the pressure above it is lowering.

Types

Fog can form in a number of ways, depending on how the cooling that caused the condensation occurred.

Radiation fog is formed by the cooling of land after sunset by infrared thermal radiation in calm conditions with a clear sky. The cooling ground then cools adjacent air by conduction, causing the air temperature to fall and reach the dew point, forming fog. In perfect calm, the fog layer can be less than a meter thick, but turbulence can promote a thicker layer. Radiation fog occurs at night, and usually does not last long after sunrise, but it can persist all day in the winter months, especially in areas bounded by high ground. Radiation fog is most common in autumn and early winter. Examples of this phenomenon include tule fog.

Ground fog is fog that obscures less than 60% of the sky and does not extend to the base of any overhead clouds. However, the term is usually a synonym for shallow radiation fog; in some cases the depth of the fog is on the order of tens of centimetres over certain kinds of terrain with the absence of wind.

Advection fog layer in San Francisco with the Golden Gate Bridge and skyline in the background

Advection fog occurs when moist air passes over a cool surface by advection (wind) and is cooled. It is common as a warm front passes over an area with significant snow-pack. It is most common at sea when moist air encounters cooler waters, including areas of cold water upwelling, such as along the California coast (see San Francisco fog). A strong enough temperature difference over water or bare ground can also cause advection fog.

Although strong winds often mix the air and can disperse, fragment, or prevent many kinds of fog, markedly warmer and humid air blowing over a snowpack can continue to generate advection fog at elevated velocities up to 80 km/h (50 mph) or more – this fog will be in a turbulent, rapidly moving, and comparatively shallow layer, observed as a few centimetres/inches in depth over flat farm fields, flat urban terrain and the like, and/or form more complex forms where the terrain is different such as rotating areas in the lee of hills or large buildings and so on.

Fog formed by advection along the California coastline is propelled onto land by one of several processes. A cold front can push the marine layer coast-ward, an occurrence most typical in the spring or late fall. During the summer months, a low-pressure trough produced by intense heating inland creates a strong pressure gradient, drawing in the dense marine layer. Also, during the summer, strong high pressure aloft over the desert southwest, usually in connection with the summer monsoon, produces a south to southeasterly flow which can drive the offshore marine layer up the coastline; a phenomenon known as a "southerly surge", typically following a coastal heat spell. However, if the monsoonal flow is sufficiently turbulent, it might instead break up the marine layer and any fog it may contain. Moderate turbulence will typically transform a fog bank, lifting it and breaking it up into shallow convective clouds called stratocumulus.

Evaporation fog or steam fog forms over bodies of water overlain by much colder air; this situation can also lead to the formation of steam devils, which look like their dust counterparts. Lake effect fog is of this type, sometimes in combination with other causes like radiation fog. It tends to differ from most advective fog formed over land in that it is, like lake-effect snow, a convective phenomenon, resulting in fog that can be very dense and deep and looks fluffy from above.

Frontal fog forms in much the same way as stratus cloud near a front when raindrops, falling from relatively warm air above a frontal surface, evaporate into cooler air close to the Earth's surface and cause it to become saturated. This type of fog can be the result of a very low frontal stratus cloud subsiding to surface level in the absence of any lifting agent after the front passes.

Ice fog forms in very low temperatures and can be the result of other mechanisms mentioned here, as well as the exhalation of moist warm air by herds of animals. It can be associated with the diamond dust form of precipitation, in which very small crystals of ice form and slowly fall. This often occurs during blue sky conditions, which can cause many types of halos and other results of refraction of sunlight by the airborne crystals.

Freezing fog, which deposits rime, is composed of droplets of supercooled water that freeze to surfaces on contact.

Precipitation fog (or frontal fog) forms as precipitation falls into drier air below the cloud, the liquid droplets evaporate into water vapor. The water vapor cools and at the dewpoint it condenses and fog forms.

Hail fog sometimes occurs in the vicinity of significant hail accumulations due to decreased temperature and increased moisture leading to saturation in a very shallow layer near the surface. It most often occurs when there is a warm, humid layer atop the hail and when wind is light. This ground fog tends to be localized but can be extremely dense and abrupt. It may form shortly after the hail falls; when the hail has had time to cool the air and as it absorbs heat when melting and evaporating.

Upslope fog forms when moist air is going up the slope of a mountain or hill (orographic lifting) which condenses into fog on account of adiabatic cooling, and to a lesser extent the drop in pressure with altitude.

Freezing conditions

Freezing fog occurs when liquid fog droplets freeze to surfaces, forming white soft or hard rime. This is very common on mountain tops which are exposed to low clouds. It is equivalent to freezing rain, and essentially the same as the ice that forms inside a freezer which is not of the "frostless" or "frost-free" type. The term "freezing fog" may also refer to fog where water vapor is super-cooled, filling the air with small ice crystals similar to very light snow. It seems to make the fog "tangible", as if one could "grab a handful".

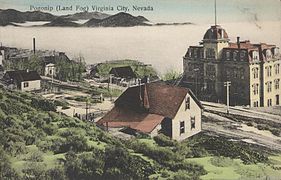
In the western United States, freezing fog may be referred to as pogonip. It occurs commonly during cold winter spells, usually in deep mountain valleys. The word pogonip is derived from the Shoshone word paγi̵nappi̵h, which means "cloud". In The Old Farmer's Almanac, in the calendar for December, the phrase "Beware the Pogonip" regularly appears. In his anthology Smoke Bellew, Jack London described a pogonip which surrounded the main characters, killing one of them.

The phenomenon is also extremely common in the inland areas of the Pacific Northwest, with temperatures in the 10 to 30 °F (−12 to −1 °C) range. The Columbia Plateau experiences this phenomenon most years due to temperature inversions, sometimes lasting for as long as three weeks. The fog typically begins forming around the area of the Columbia River and expands, sometimes covering the land to distances as far away as LaPine, Oregon, almost 150 miles (240 km) due south of the river and into south central Washington.

Frozen fog (also known as ice fog) is any kind of fog where the droplets have frozen into extremely tiny crystals of ice in midair. Generally, this requires temperatures at or below −35 °C (−31 °F), making it common only in and near the Arctic and Antarctic regions. It is most often seen in urban areas where it is created by the freezing of water vapor present in automobile exhaust and combustion products from heating and power generation. Urban ice fog can become extremely dense and will persist day and night until the temperature rises. Extremely small amounts of ice fog falling from the sky form a type of precipitation called ice crystals, often reported in Utqiaġvik, Alaska. Ice fog often leads to the visual phenomenon of light pillars.

Topographical influences

Fog over the Pedra do Sino (Bell Rock; top) and Dedo de Deus (God's Finger; bottom) peaks in the Serra dos Órgãos National Park, Rio de Janeiro state, Brazil

Up-slope fog or hill fog forms when winds blow air up a slope (called orographic lift), adiabatically cooling it as it rises, and causing the moisture in it to condense. This often causes freezing fog on mountaintops, where the cloud ceiling would not otherwise be low enough.

Valley fog forms in mountain valleys, often during winter. It is essentially a radiation fog confined by local topography, and can last for several days in calm conditions. In California's Central Valley, valley fog is often referred to as tule fog.

Sea and coastal fog

Sea fog (also known as haar or fret) is heavily influenced by the presence of sea spray and microscopic airborne salt crystals. Clouds of all types require minute hygroscopic particles upon which water vapor can condense. Over the ocean surface, the most common particles are salt from salt spray produced by breaking waves. Except in areas of storminess, the most common areas of breaking waves are located near coastlines, hence the greatest densities of airborne salt particles are there.

Condensation on salt particles has been observed to occur at humidities as low as 70%, thus fog can occur even in relatively dry air in suitable locations such as the California coast. Typically, such lower humidity fog is preceded by a transparent mistiness along the coastline as condensation competes with evaporation, a phenomenon that is typically noticeable by beachgoers in the afternoon. Another recently discovered source of condensation nuclei for coastal fog is kelp seaweed. Researchers have found that under stress (intense sunlight, strong evaporation, etc.), kelp releases particles of iodine which in turn become nuclei for condensation of water vapor, causing fog that diffuses direct sunlight.

Sea smoke, also called steam fog or evaporation fog, is the most localized form and is created by cold air passing over warmer water or moist land. It often causes freezing fog, or sometimes hoar frost.

Arctic sea smoke is similar to sea smoke, but occurs when the air is very cold. Instead of condensing into water droplets, columns of freezing, rising, and condensing water vapor is formed. The water vapor produces the sea smoke fog, and is usually misty and smoke-like.

Garúa fog near the coast of Chile and Peru, occurs when typical fog produced by the sea travels inland, but suddenly meets an area of hot air. This causes the water particles of fog to shrink by evaporation, producing a "transparent mist". Garua fog is nearly invisible, yet it still forces drivers to use windshield wipers because of deposition of liquid water on hard surfaces. Camanchaca is a similar, dense fog.

Visibility effects

Light fog reduces visibility on a suburban street, rendering the cyclist very hazy at about 200 m (220 yd). The limit of visibility is about 400 m (440 yd), which is before the end of the street.

Depending on the concentration of the droplets, visibility in fog can range from the appearance of haze, to almost zero visibility. Many lives are lost each year worldwide from accidents involving fog conditions on the highways, including multiple-vehicle collisions.

The aviation travel industry is affected by the severity of fog conditions. Even though modern auto-landing computers can put an aircraft down without the aid of a pilot, personnel manning an airport control tower must be able to see if aircraft are sitting on the runway awaiting takeoff. Safe operations are difficult in thick fog, and civilian airports may forbid takeoffs and landings until conditions improve.

A solution for landing returning military aircraft developed in World War II was called Fog Investigation and Dispersal Operation (FIDO). It involved burning enormous amounts of fuel alongside runways to evaporate fog, allowing returning fighter and bomber pilots sufficient visual cues to safely land their aircraft. The high energy demands of this method discourage its use for routine operations.

Shadows

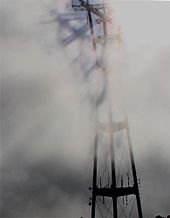
Sutro Tower casts a 3-dimensional fog shadow

Shadows are cast through fog in three dimensions. The fog is dense enough to be illuminated by light that passes through gaps in a structure or tree, but thin enough to let a large quantity of that light pass through to illuminate points further on. As a result, object shadows appear as "beams" oriented in a direction parallel to the light source. These voluminous shadows are created the same way as crepuscular rays, which are the shadows of clouds. In fog, it is solid objects that cast shadows.

Sound propagation and acoustic effects

Sound typically travels fastest and farthest through solids, then liquids, then gases such as the atmosphere. Sound is affected during fog conditions due to the small distances between water droplets, and air temperature differences.

Molecular effect: Though fog is essentially liquid water, the many droplets are separated by small air gaps. High-pitched sounds have a high frequency, which in turn means they have a short wavelength. To transmit a high frequency wave, air must move back and forth very quickly. Short-wavelength high-pitched sound waves are reflected and refracted by many separated water droplets, partially cancelling and dissipating their energy (a process called "damping"). In contrast, low pitched notes, with a low frequency and a long wavelength, move the air less rapidly and less often, and lose less energy to interactions with small water droplets. Low-pitched notes are less affected by fog and travel further, which is why foghorns use a low-pitched tone.

Temperature effect: A fog can be caused by a temperature inversion where cold air is pooled at the surface which helped to create the fog, while warmer air sits above it. The inverted boundary between cold air and warm air reflects sound waves back toward the ground, allowing sound that would normally radiate out escaping into the upper atmosphere to instead bounce back and travel near the surface. A temperature inversion increases the distance that lower frequency sounds can travel, by reflecting the sound between the ground and the inversion layer.

Record extremes

Particularly foggy places include Hamilton, New Zealand and Grand Banks off the coast of Newfoundland (the meeting place of the cold Labrador Current from the north and the much warmer Gulf Stream from the south). Some very foggy land areas in the world include Argentia (Newfoundland) and Point Reyes (California), each with over 200 foggy days per year. Even in generally warmer southern Europe, thick fog and localized fog are often found in lowlands and valleys, such as the lower part of the Po Valley and the Arno and Tiber valleys in Italy; Ebro Valley in northeastern Spain; as well as on the Swiss plateau, especially in the Seeland area, in late autumn and winter. Other notably foggy areas include coastal Chile (in the south); coastal Namibia; Nord, Greenland; and the Severnaya Zemlya islands.

As a water source

Redwood forests in California receive approximately 30–40% of their moisture from coastal fog by way of fog drip. Change in climate patterns could result in relative drought in these areas. Some animals, including insects, depend on wet fog as a principal source of water, particularly in otherwise desert climes, as along many African coastal areas. Some coastal communities use fog nets to extract moisture from the atmosphere where groundwater pumping and rainwater collection are insufficient. Fog can be of different type according to climatic conditions.

Artificial fog

Artificial fog is man-made fog that is usually created by vaporizing a water- and glycol- or glycerine-based fluid. The fluid is injected into a heated metal block, and evaporates quickly. The resulting pressure forces the vapor out of a vent. Upon coming into contact with cool outside air, the vapor condenses in microscopic droplets and appears as fog. Such fog machines are primarily used for entertainment applications.

Historical references

The presence of fog has often played a key role in historical events, such as strategic battles. One example is the Battle of Long Island (27 August 1776), when American general George Washington and his command were able to evade imminent capture by the British Army, using fog to conceal their escape. Another example is D-Day (6 June 1944) during World War II, when the Allies landed on the beaches of Normandy, France during fog conditions. Both positive and negative results were reported from both sides during that battle, due to impaired visibility.

Research and development

From Wikipedia, the free encyclopedia
https://en.wikipedia.org/wiki/Research_and_development

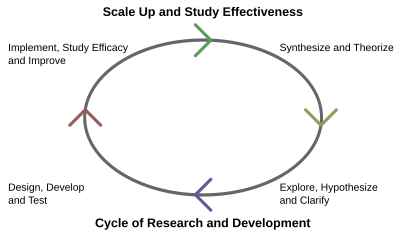
Cycle of research and development
 
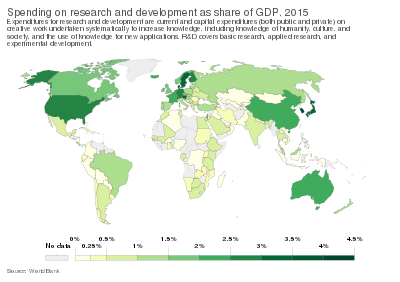
Spending on research and development as share of GDP (2015)

Research and development (R&D or R+D), known in Europe as research and technological development (RTD), is the set of innovative activities undertaken by corporations or governments in developing new services or products, and improving existing ones. Research and development constitutes the first stage of development of a potential new service or the production process.

R&D activities differ from institution to institution, with two primary models of an R&D department either staffed by engineers and tasked with directly developing new products, or staffed with industrial scientists and tasked with applied research in scientific or technological fields, which may facilitate future product development. R&D differs from the vast majority of corporate activities in that it is not intended to yield immediate profit, and generally carries greater risk and an uncertain return on investment. However R&D is crucial for acquiring larger shares of the market through the marketisation of new products. R&D&I or R&D&i are also acronyms with the same general meaning of R&D and stand for research, development and innovation.

Background

New product design and development is often a crucial factor in the survival of a company. In a global industrial landscape that is changing fast, firms must continually revise their design and range of products. This is necessary as well due to the fierce competition and the evolving preferences of consumers. Without an R&D program, a firm must rely on strategic alliances, acquisitions, and networks to tap into the innovations of others.

A system driven by marketing is one that puts the customer needs first, and produces goods that are known to sell. Market research is carried out, which establishes the needs of consumers and the potential niche market of a new product. If the development is technology driven, R&D is directed toward developing products to meet the unmet needs.

In general, research and development activities are conducted by specialized units or centers belonging to a company, or can be out-sourced to a contract research organization, universities, or state agencies. In the context of commerce, "research and development" normally refers to future-oriented, longer-term activities in science or technology, using similar techniques to scientific research but directed toward desired outcomes and with broad forecasts of commercial yield.

Statistics on organizations devoted to "R&D" may express the state of an industry, the degree of competition or the lure of progress. Some common measures include: budgets, numbers of patents or on rates of peer-reviewed publications. Bank ratios are one of the best measures, because they are continuously maintained, public and reflect risk.

In the United States, a typical ratio of research and development for an industrial company is about 3.5% of revenues; this measure is called "R&D intensity". A high technology company, such as a computer manufacturer, might spend 7% or a pharmaceutical companies such as Merck & Co. 14.1% or Novartis 15.1%. Anything over 15% is remarkable, and usually gains a reputation for being a high technology company such as engineering company Ericsson 24.9%, or biotech company Allergan, which tops the spending table with 43.4% investment. Such companies are often seen as credit risks because their spending ratios are so unusual.

Generally such firms prosper only in markets whose customers have extreme high technology needs, like certain prescription drugs or special chemicals, scientific instruments, and safety-critical systems in medicine, aeronautics or military weapons. The extreme needs justify the high risk of failure and consequently high gross margins from 60% to 90% of revenues. That is, gross profits will be as much as 90% of the sales cost, with manufacturing costing only 10% of the product price, because so many individual projects yield no exploitable product. Most industrial companies get 40% revenues only.

On a technical level, high tech organizations explore ways to re-purpose and repackage advanced technologies as a way of amortizing the high overhead. They often reuse advanced manufacturing processes, expensive safety certifications, specialized embedded software, computer-aided design software, electronic designs and mechanical subsystems.

Research from 2000 has shown that firms with a persistent R&D strategy outperform those with an irregular or no R&D investment program.

Business R&D

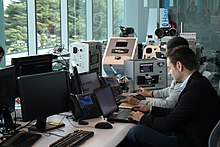
Mercedes Benz Research Development North America (13896037060)

Research and development are very difficult to manage, since the defining feature of research is that the researchers do not know in advance exactly how to accomplish the desired result. As a result, "higher R&D spending does not guarantee more creativity, higher profit or a greater market share". Research is the most risky financing area because both the development of an invention and its successful realization carries uncertainty including the profitability of the invention. One way entrepreneurs can reduce these uncertainties is to buy the licence for a franchise, so that the know-how is already incorporated in the licence.

Benefit by sector

In general, it has been found that there is a positive correlation between the research and development and firm productivity across all sectors, but that this positive correlation is much stronger in high-tech firms than in low-tech firms. In research done by Francesco Crespi and Cristiano Antonelli, high-tech firms were found to have "virtuous" Matthew effects while low-tech firms experienced "vicious" Matthew effects, meaning that high-tech firms were awarded subsidies on merit while low-tech firms most often were given subsidies based on name recognition, even if not put to good use. While the strength of the correlation between R&D spending and productivity in low-tech industries is less than in high-tech industries, studies have been done showing non-trivial carryover effects to other parts of the marketplace by low-tech R&D.

Risks

Business R&D is risky for at least two reasons. The first source of risks comes from R&D nature, where R&D project could fail without residual values. The second source of risks comes from takeover risks, which means R&D is appealing to bidders because they could gain technologies from acquisition targets. Therefore, firms may gain R&D profit that co-moves with takeover waves, causing risks to the company which engages in R&D activity.

Global

Global R&D management is the discipline of designing and leading R&D processes globally, across cultural and lingual settings, and the transfer of knowledge across international corporate networks.

Government expenditures

United States

Mercedes Benz Research Development North America (13896049248)

President Barack Obama requested $147.696 billion for research and development in FY2012, 21% of which was destined to fund basic research. According to National Science Foundation in U.S., in 2015, R&D expenditures performed by federal government and local governments are 54 and 0.6 billions of dollars. The federal research and development budget for fiscal year 2020 was $156 billion, 41.4% of which was for the Department of Defense (DOD). DOD's total research, development, test, and evaluation budget was roughly $108.5 billion.

European Union

Research and innovation in Europe are financially supported by the programme Horizon 2020, which is open to participation worldwide.

A notable example is the European environmental research and innovation policy, based on the Europe 2020 strategy which will run from 2014 to 2020, a multidisciplinary effort to provide safe, economically feasible, environmentally sound and socially acceptable solutions along the entire value chain of human activities.

Firms that have embraced advanced digital technology devote a greater proportion of their investment efforts to R&D. Firms who engaged in digitisation during the pandemic report spending a big portion of their expenditure in 2020 on software, data, IT infrastructure, and website operations.

Worldwide

In 2015, research and development constituted an average 2.2% of the global GDP according to the UNESCO Institute for Statistics.

By 2018, research and development constituted an average 1.79% of the global GDP according to the UNESCO Institute for Statistics. Countries agreed in 2015 to monitor their progress in raising research intensity (SDG 9.5.1), as well as researcher density (SDG 9.5.2), as part of their commitment to reaching the Sustainable Development Goals by 2030. However, this undertaking has not spurred an increase in reporting of data. On the contrary, a total of 99 countries reported data on domestic investment in research in 2015 but only 69 countries in 2018. Similarly, 59 countries recorded the number of researchers (in full-time equivalents) in 2018, down from 90 countries in 2015. UNESCO Institute for Statistics is the global custodian of these R&D data; data can be freely obtained from the UIS database.

Top Countries by R&D spending
Country R&D as Percentage of GDP
Israel
5.44
Korea
4.81
Sweden
3.53
Belgium
3.48
USA
3.45
Japan
3.26
Austria
3.20
Switzerland
3.15
Germany
3.14
Denmark
2.96
Finland
2.94
Iceland
2.47
China
2.40
France
2.35
Netherlands
2.29
Norway
2.28
Slovenia
2.15
Czechia
1.99
Singapore
1.89
Australia
1.83

Database model

From Wikipedia, the free encyclopedia

A database model is a type of data model that determines the logical structure of a database. It fundamentally determines in which manner data can be stored, organized and manipulated. The most popular example of a database model is the relational model, which uses a table-based format.

Types

Common logical data models for databases include:

It is the oldest form of data base model. It was developed by IBM for IMS (information Management System). It is a set of organized data in tree structure. DB record is a tree consisting of many groups called segments. It uses one to many relationships. The data access is also predictable.

An object–relational database combines the two related structures.

Physical data models include:

Other models include:

Relationships and functions

A given database management system may provide one or more models. The optimal structure depends on the natural organization of the application's data, and on the application's requirements, which include transaction rate (speed), reliability, maintainability, scalability, and cost. Most database management systems are built around one particular data model, although it is possible for products to offer support for more than one model.

Various physical data models can implement any given logical model. Most database software will offer the user some level of control in tuning the physical implementation, since the choices that are made have a significant effect on performance.

A model is not just a way of structuring data: it also defines a set of operations that can be performed on the data. The relational model, for example, defines operations such as select (project) and join. Although these operations may not be explicit in a particular query language, they provide the foundation on which a query language is built.

Flat model

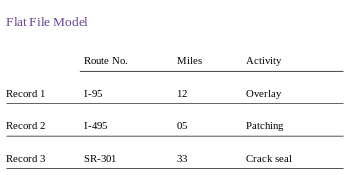
Flat File Model
 

The flat (or table) model consists of a single, two-dimensional array of data elements, where all members of a given column are assumed to be similar values, and all members of a row are assumed to be related to one another. For instance, columns for name and password that might be used as a part of a system security database. Each row would have the specific password associated with an individual user. Columns of the table often have a type associated with them, defining them as character data, date or time information, integers, or floating point numbers. This tabular format is a precursor to the relational model.

Early data models

These models were popular in the 1960s, 1970s, but nowadays can be found primarily in old legacy systems. They are characterized primarily by being navigational with strong connections between their logical and physical representations, and deficiencies in data independence.

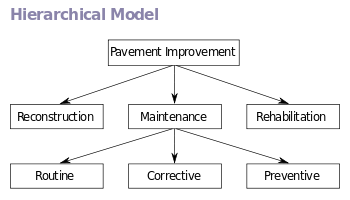
Hierarchical model

Hierarchical Model
 

In a hierarchical model, data is organized into a tree-like structure, implying a single parent for each record. A sort field keeps sibling records in a particular order. Hierarchical structures were widely used in the early mainframe database management systems, such as the Information Management System (IMS) by IBM, and now describe the structure of XML documents. This structure allows one-to-many relationship between two types of data. This structure is very efficient to describe many relationships in the real world; recipes, table of contents, ordering of paragraphs/verses, any nested and sorted information.

This hierarchy is used as the physical order of records in storage. Record access is done by navigating downward through the data structure using pointers combined with sequential accessing. Because of this, the hierarchical structure is inefficient for certain database operations when a full path (as opposed to upward link and sort field) is not also included for each record. Such limitations have been compensated for in later IMS versions by additional logical hierarchies imposed on the base physical hierarchy.

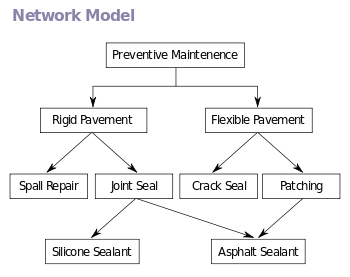
Network model

Network Model
 

The network model expands upon the hierarchical structure, allowing many-to-many relationships in a tree-like structure that allows multiple parents. It was most popular before being replaced by the relational model, and is defined by the CODASYL specification.

The network model organizes data using two fundamental concepts, called records and sets. Records contain fields (which may be organized hierarchically, as in the programming language COBOL). Sets (not to be confused with mathematical sets) define one-to-many relationships between records: one owner, many members. A record may be an owner in any number of sets, and a member in any number of sets.

A set consists of circular linked lists where one record type, the set owner or parent, appears once in each circle, and a second record type, the subordinate or child, may appear multiple times in each circle. In this way a hierarchy may be established between any two record types, e.g., type A is the owner of B. At the same time another set may be defined where B is the owner of A. Thus all the sets comprise a general directed graph (ownership defines a direction), or network construct. Access to records is either sequential (usually in each record type) or by navigation in the circular linked lists.

The network model is able to represent redundancy in data more efficiently than in the hierarchical model, and there can be more than one path from an ancestor node to a descendant. The operations of the network model are navigational in style: a program maintains a current position, and navigates from one record to another by following the relationships in which the record participates. Records can also be located by supplying key values.

Although it is not an essential feature of the model, network databases generally implement the set relationships by means of pointers that directly address the location of a record on disk. This gives excellent retrieval performance, at the expense of operations such as database loading and reorganization.

Popular DBMS products that utilized it were Cincom Systems' Total and Cullinet's IDMS. IDMS gained a considerable customer base; in the 1980s, it adopted the relational model and SQL in addition to its original tools and languages.

Most object databases (invented in the 1990s) use the navigational concept to provide fast navigation across networks of objects, generally using object identifiers as "smart" pointers to related objects. Objectivity/DB, for instance, implements named one-to-one, one-to-many, many-to-one, and many-to-many named relationships that can cross databases. Many object databases also support SQL, combining the strengths of both models.

Inverted file model

In an inverted file or inverted index, the contents of the data are used as keys in a lookup table, and the values in the table are pointers to the location of each instance of a given content item. This is also the logical structure of contemporary database indexes, which might only use the contents from a particular columns in the lookup table. The inverted file data model can put indexes in a set of files next to existing flat database files, in order to efficiently directly access needed records in these files.

Notable for using this data model is the ADABAS DBMS of Software AG, introduced in 1970. ADABAS has gained considerable customer base and exists and supported until today. In the 1980s it has adopted the relational model and SQL in addition to its original tools and languages.

Document-oriented database Clusterpoint uses inverted indexing model to provide fast full-text search for XML or JSON data objects for example.

Relational model

Two tables with a relationship
 

The relational model was introduced by E.F. Codd in 1970 as a way to make database management systems more independent of any particular application. It is a mathematical model defined in terms of predicate logic and set theory, and implementations of it have been used by mainframe, midrange and microcomputer systems.

The products that are generally referred to as relational databases in fact implement a model that is only an approximation to the mathematical model defined by Codd. Three key terms are used extensively in relational database models: relations, attributes, and domains. A relation is a table with columns and rows. The named columns of the relation are called attributes, and the domain is the set of values the attributes are allowed to take.

The basic data structure of the relational model is the table, where information about a particular entity (say, an employee) is represented in rows (also called tuples) and columns. Thus, the "relation" in "relational database" refers to the various tables in the database; a relation is a set of tuples. The columns enumerate the various attributes of the entity (the employee's name, address or phone number, for example), and a row is an actual instance of the entity (a specific employee) that is represented by the relation. As a result, each tuple of the employee table represents various attributes of a single employee.

All relations (and, thus, tables) in a relational database have to adhere to some basic rules to qualify as relations. First, the ordering of columns is immaterial in a table. Second, there can't be identical tuples or rows in a table. And third, each tuple will contain a single value for each of its attributes.

A relational database contains multiple tables, each similar to the one in the "flat" database model. One of the strengths of the relational model is that, in principle, any value occurring in two different records (belonging to the same table or to different tables), implies a relationship among those two records. Yet, in order to enforce explicit integrity constraints, relationships between records in tables can also be defined explicitly, by identifying or non-identifying parent-child relationships characterized by assigning cardinality (1:1, (0)1:M, M:M). Tables can also have a designated single attribute or a set of attributes that can act as a "key", which can be used to uniquely identify each tuple in the table.

A key that can be used to uniquely identify a row in a table is called a primary key. Keys are commonly used to join or combine data from two or more tables. For example, an Employee table may contain a column named Location which contains a value that matches the key of a Location table. Keys are also critical in the creation of indexes, which facilitate fast retrieval of data from large tables. Any column can be a key, or multiple columns can be grouped together into a compound key. It is not necessary to define all the keys in advance; a column can be used as a key even if it was not originally intended to be one.

A key that has an external, real-world meaning (such as a person's name, a book's ISBN, or a car's serial number) is sometimes called a "natural" key. If no natural key is suitable (think of the many people named Brown), an arbitrary or surrogate key can be assigned (such as by giving employees ID numbers). In practice, most databases have both generated and natural keys, because generated keys can be used internally to create links between rows that cannot break, while natural keys can be used, less reliably, for searches and for integration with other databases. (For example, records in two independently developed databases could be matched up by social security number, except when the social security numbers are incorrect, missing, or have changed.)

The most common query language used with the relational model is the Structured Query Language (SQL).

Dimensional model

The dimensional model is a specialized adaptation of the relational model used to represent data in data warehouses in a way that data can be easily summarized using online analytical processing, or OLAP queries. In the dimensional model, a database schema consists of a single large table of facts that are described using dimensions and measures. A dimension provides the context of a fact (such as who participated, when and where it happened, and its type) and is used in queries to group related facts together. Dimensions tend to be discrete and are often hierarchical; for example, the location might include the building, state, and country. A measure is a quantity describing the fact, such as revenue. It is important that measures can be meaningfully aggregated—for example, the revenue from different locations can be added together.

In an OLAP query, dimensions are chosen and the facts are grouped and aggregated together to create a summary.

The dimensional model is often implemented on top of the relational model using a star schema, consisting of one highly normalized table containing the facts, and surrounding denormalized tables containing each dimension. An alternative physical implementation, called a snowflake schema, normalizes multi-level hierarchies within a dimension into multiple tables.

A data warehouse can contain multiple dimensional schemas that share dimension tables, allowing them to be used together. Coming up with a standard set of dimensions is an important part of dimensional modeling.

Its high performance has made the dimensional model the most popular database structure for OLAP.

Post-relational database models

Products offering a more general data model than the relational model are sometimes classified as post-relational. Alternate terms include "hybrid database", "Object-enhanced RDBMS" and others. The data model in such products incorporates relations but is not constrained by E.F. Codd's Information Principle, which requires that

all information in the database must be cast explicitly in terms of values in relations and in no other way

Some of these extensions to the relational model integrate concepts from technologies that pre-date the relational model. For example, they allow representation of a directed graph with trees on the nodes. The German company sones implements this concept in its GraphDB.

Some post-relational products extend relational systems with non-relational features. Others arrived in much the same place by adding relational features to pre-relational systems. Paradoxically, this allows products that are historically pre-relational, such as PICK and MUMPS, to make a plausible claim to be post-relational.

The resource space model (RSM) is a non-relational data model based on multi-dimensional classification.

Graph model

Graph databases allow even more general structure than a network database; any node may be connected to any other node.

Multivalue model

Multivalue databases are "lumpy" data, in that they can store exactly the same way as relational databases, but they also permit a level of depth which the relational model can only approximate using sub-tables. This is nearly identical to the way XML expresses data, where a given field/attribute can have multiple right answers at the same time. Multivalue can be thought of as a compressed form of XML.

An example is an invoice, which in either multivalue or relational data could be seen as (A) Invoice Header Table - one entry per invoice, and (B) Invoice Detail Table - one entry per line item. In the multivalue model, we have the option of storing the data as on table, with an embedded table to represent the detail: (A) Invoice Table - one entry per invoice, no other tables needed.

The advantage is that the atomicity of the Invoice (conceptual) and the Invoice (data representation) are one-to-one. This also results in fewer reads, less referential integrity issues, and a dramatic decrease in the hardware needed to support a given transaction volume.

Object-oriented database models

Object-Oriented Model
 

In the 1990s, the object-oriented programming paradigm was applied to database technology, creating a new database model known as object databases. This aims to avoid the object–relational impedance mismatch – the overhead of converting information between its representation in the database (for example as rows in tables) and its representation in the application program (typically as objects). Even further, the type system used in a particular application can be defined directly in the database, allowing the database to enforce the same data integrity invariants. Object databases also introduce the key ideas of object programming, such as encapsulation and polymorphism, into the world of databases.

A variety of these ways have been tried for storing objects in a database. Some products have approached the problem from the application programming end, by making the objects manipulated by the program persistent. This typically requires the addition of some kind of query language, since conventional programming languages do not have the ability to find objects based on their information content. Others have attacked the problem from the database end, by defining an object-oriented data model for the database, and defining a database programming language that allows full programming capabilities as well as traditional query facilities.

Object databases suffered because of a lack of standardization: although standards were defined by ODMG, they were never implemented well enough to ensure interoperability between products. Nevertheless, object databases have been used successfully in many applications: usually specialized applications such as engineering databases or molecular biology databases rather than mainstream commercial data processing. However, object database ideas were picked up by the relational vendors and influenced extensions made to these products and indeed to the SQL language.

An alternative to translating between objects and relational databases is to use an object–relational mapping (ORM) library.

Pantheism

From Wikipedia, the free encyclopedia https://en.wikipedia.org/wiki/Pantheism     Pantheism is the philosophic...