Search This Blog

Tuesday, August 15, 2023

Net metering

From Wikipedia, the free encyclopedia
https://en.wikipedia.org/wiki/Net_metering

Net metering (or net energy metering, NEM) is an electricity billing mechanism that allows consumers who generate some or all of their own electricity to use that electricity anytime, instead of when it is generated. This is particularly important with renewable energy sources like wind and solar, which are non-dispatchable (when not coupled to storage). Monthly net metering allows consumers to use solar power generated during the day at night, or wind from a windy day later in the month. Annual net metering rolls over a net kilowatt-hour (kWh) credit to the following month, allowing solar power that was generated in July to be used in December, or wind power from March in August.

Net metering policies can vary significantly by country and by state or province: if net metering is available, if and how long banked credits can be retained, and how much the credits are worth (retail/wholesale). Most net metering laws involve monthly rollover of kWh credits, a small monthly connection fee, require a monthly payment of deficits (i.e. normal electric bill), and annual settlement of any residual credit. Net metering uses a single, bi-directional meter and can measure the current flowing in two directions. Net metering can be implemented solely as an accounting procedure, and requires no special metering, or even any prior arrangement or notification.

Net metering is an enabling policy designed to foster private investment in renewable energy.

History

Net metering originated in the United States, where small wind turbines and solar panels were connected to the electrical grid, and consumers wanted to be able to use the electricity generated at a different time or date from when it was generated. The first two projects to use net metering were an apartment complex and a solar test house in Massachusetts in 1979. Minnesota is commonly cited as passing the first net metering law, in 1983, and allowed anyone generating less than 40 kW to either roll over any credit to the next month, or be paid for the excess. In 2000 this was amended to compensation "at the average retail utility energy rate". This is the simplest and most general interpretation of net metering, and in addition allows small producers to sell electricity at the retail rate.

Utilities in Idaho adopted net metering in 1980, and in Arizona in 1981. Massachusetts adopted net metering in 1982. By 1998, 22 states or utilities therein had adopted net metering. Two California utilities initially adopted a monthly "net metering" charge, which included a "standby charge", until the Public Utilities Commission (PUC) banned such charges. In 2005, all U.S. utilities were required to consider adopting rules offering net metering "upon request" by the Energy Policy Act of 2005. Excess generation is not addressed. As of 2013, 43 U.S. states have adopted net metering, as well as utilities in 3 of the remaining states, leaving only 4 states without any established procedures for implementing net metering. However, a 2017 study showed that only 3% of U.S. utilities offer full retail compensation for net metering with the remainder offering less than retail rates, having credit expire annually, or some form of indefinite rollover.

Net metering was slow to be adopted in Europe, especially in the United Kingdom, because of confusion over how to address the value added tax (VAT). Only one utility company in Great Britain offers net metering.

The United Kingdom government is reluctant to introduce the net metering principle because of complications in paying and refunding the value added tax that is payable on electricity, but pilot projects are underway in some areas.

In Canada, some provinces have net metering programs.

In the Philippines, Net Metering scheme is governed by Republic Act 9513 (Renewable Energy Act of 2008) and its implementing rules and regulation (IRR). The implementing body is the Energy Regulatory Commission (ERC) in consultation with the National Renewable Energy Board (NREB). Unfortunately, the scheme is not a true net metering scheme but in reality a net billing scheme. As the Dept of Energy's Net Metering guidelines say, “Net-metering allows customers of Distribution Utilities (DUs) to install an on-site Renewable Energy (RE) facility not exceeding 100 kilowatts (kW) in capacity so they can generate electricity for their own use. Any electricity generated that is not consumed by the customer is automatically exported to the DU’s distribution system. The DU then gives a peso credit for the excess electricity received equivalent to the DU’s blended generation cost, excluding other generation adjustments, and deducts the credits earned to the customer’s electric bill.” 

Thus Philippine consumers who generate their own electricity and sell their surplus to the utility are paid what is called the "generation cost" which is often less than 50% of the retail price of electricity.

Controversy

Net metering is controversial as it affects different interests on the grid. A report prepared by Peter Kind of Energy Infrastructure Advocates for the trade association Edison Electric Institute stated that distributed generation systems, like rooftop solar, present unique challenges to the future of electric utilities. Utilities in the United States have led a largely unsuccessful campaign to eliminate net metering.

Benefits

Renewable advocates point out that while distributed solar and other energy efficiency measures do pose a challenge to electric utilities' existing business model, the benefits of distributed generation outweigh the costs, and those benefits are shared by all ratepayers. Grid benefits of private distributed solar investment include reduced need for centralizing power plants and reduced strain on the utility grid. They also point out that, as a cornerstone policy enabling the growth of rooftop solar, net metering creates a host of societal benefits for all ratepayers that are generally not accounted for by the utility analysis, including: public health benefits, employment and downstream economic effects, market price impacts, grid security benefits, and water savings.

An independent report conducted by the consulting firm Crossborder Energy found that the benefits of California's net metering program outweigh the costs to ratepayers. Those net benefits will amount to more than US$92 million annually upon the completion of the current net metering program.

A 2012 report on the cost of net metering in the State of California, commissioned by the California Public Utilities Commission (CPUC), showed that those customers without distributed generation systems will pay US$287 in additional costs to use and maintain the grid every year by 2020. The report also showed the net cost will amount to US$1.1 billion by 2020. Notably, the same report found that solar customers do pay more on their power bills than what it costs the utility to serve them (Table 5, page 10: average 103% of their cost of service across the three major utilities in 2011).

Drawbacks

Many electric utilities state that owners of generation systems do not pay the full cost of service to use the grid, thus shifting their share of the cost onto customers without distributed generation systems. Most owners of rooftop solar or other types of distributed generation systems still rely on the grid to receive electricity from utilities at night or when their systems cannot generate sufficient power.

A 2014 report funded by the Institute for Electric Innovation claims that net metering in California produces excessively large subsidies for typical residential rooftop solar photovoltaic (PV) facilities. These subsidies must then be paid for by other residential customers, most of whom are less affluent than the rooftop solar PV customers. In addition, the report points out that most of these large subsidies go to the solar leasing companies, which accounted for about 75 percent of the solar PV facilities installed in 2013. The report concludes that changes are needed in California, ranging from the adoption of retail tariffs that are more cost-reflective to replacing net metering with a separate "Buy All - Sell All" arrangement that requires all rooftop solar PV customers to buy all of their consumed energy under the existing retail tariffs and separately sell all of their onsite generation to their distribution utilities at the utilities' respective avoided costs.

Post-net metering successor tariffs

On a nationwide basis, energy officials have debated replacement programs for net metering for several years. As of 2018, a few "replicable models" have emerged. Utility companies have always contended that customers with solar get their bills reduced by too much under net metering, and as a result, that shifts costs for keeping up the grid infrastructure to the rest of the non-solar customers. "The policy has led to heated state-level debates since 2003 over whether — and how — to construct a successor to the policy," according to Utility Dive. The key challenge to constructing pricing and rebate schemes in a post-net metering environment is how to compensate rooftop solar customers fairly while not imposing costs on non-solar customers. Experts have said that a good "successor tariff," as the post-net metering policies have been called, is one that supports the growth of distributed energy resources in a way where customers and the grid get benefits from it.

Thirteen states swapped successor tariffs for retail rate net metering programs in 2017. In 2018, three more states made similar changes. For example, compensation in Nevada will go down over time, but today the compensation is at the retail rate (meaning, solar customers who send energy to the grid get compensated at the same rate they pay for electricity). In Arizona, the new solar rate is ten percent below the retail rate.

The two most common successor tariffs are called net billing and buy-all-sell-all (BASA). "Net billing pays the retail rate for customer-consumed PV generation and a below retail rate for exported generation. With BASA, the utility both charges and compensates at a below-retail rate."

Comparison

Net metering, unlike a feed-in tariff, requires only one meter, but it must be bi-directional.

There is considerable confusion between the terms "net metering" and "feed-in tariff"# (FIT). In general there are three types of compensation for local, distributed generation:

  1. Net metering: always at retail, and which is not technically compensation, although it may become compensation if there is excess generation and payments are allowed by the utility.
  2. Feed-in tariff: generally above retail, and reduces to retail as the percentage of adopters increases.
  3. Power purchase agreement: Compensation generally below retail, also known as a "Standard Offer Program", can be above retail, particularly in the case of solar, which tends to be generated close to peak demand.

Net metering only requires one meter. A feed-in tariff requires two.

Time of use metering

Time of use (TOU) net metering employs a smart (electric) meter that is programmed to determine electricity usage any time during the day. Time-of-use allows utility rates and charges to be assessed based on when the electricity was used (i.e., day/night and seasonal rates). Typically the generation cost of electricity is highest during the daytime peak usage period at sunset, and lowest in the middle of night. Time of use metering is a significant issue for renewable-energy sources, since, for example, solar power systems tend to produce most energy at noon and produce little power during the daytime peak-price period (see also duck curve), and no power during the night period when price is low. California, Italy and Australia has installed so many photovoltaic cells that peak prices no longer are during the day, but are instead in the evening. TOU net metering affects the apparent cost of net metering to a utility.

Market rate net metering

In market rate net metering systems the user's energy use is priced dynamically according to some function of wholesale electric prices. The users' meters are programmed remotely to calculate the value and are read remotely. Net metering applies such variable pricing to excess power produced by a qualifying system.

Market rate metering systems were implemented in California starting in 2006, and under the terms of California's net metering rules will be applicable to qualifying photovoltaic and wind systems. Under California law the payback for surplus electricity sent to the grid must be equal to the (variable, in this case) price charged at that time.

Net metering enables small systems to result in zero annual net cost to the consumer provided that the consumer is able to shift demand loads to a lower price time, such as by chilling water at a low cost time for later use in air conditioning, or by charging a battery electric vehicle during off-peak times, while the electricity generated at peak demand time can be sent to the grid rather than used locally (see Vehicle-to-grid). No credit is given for annual surplus production.

Excess generation

Excess generation is a separate issue from net metering, but it is normally dealt with in the same rules, because it can arise. If local generation offsets a portion of the demand, net metering is not used. If local generation exceeds demand some of the time, for example during the day, net metering is used. If local generation exceeds demand for the billing cycle, best practices calls for a perpetual roll over of the kilowatt-hour credits, although some regions have considered having any kWh credits expire after 36 months. The normal definition of excess generation is annually, although the term is equally applicable monthly. The treatment of annual excess generation (and monthly) ranges from lost, to compensation at avoided cost, to compensation at retail rate. Left over kWh credits upon termination of service would ideally be paid at retail rate, from the consumer standpoint, and lost, from the utility standpoint, with avoided cost a minimum compromise. Some regions allow optional payment for excess annual generation, which allows perpetual roll over or payment, at the customers choice. Both wind and solar are inherently seasonal, and it is highly likely to use up a surplus later, unless more solar panels or a larger wind turbine have been installed than needed.

Energy storage

Net metering systems can have energy storage integrated, to store some of the power locally (i.e. from the renewable energy source connected to the system) rather than selling everything back to the mains electricity grid. Often, the batteries used are industrial deep cycle batteries as these last for 10 to 20 years. Lead-acid batteries are often also still used, but last much less long (5 years or so). Lithium-ion batteries are sometimes also used, but too have a relatively short lifespan. Finally, nickel-iron batteries last the longest with a lifespan of up to 40 years. A 2017 study of solar panels with battery storage indicated an 8 to 14 percent extra consumption of electricity from charging and discharging batteries.

Adoption by country

Australia

In some Australian states, the "feed-in tariff" is actually net metering, except that it pays monthly for net generation at a higher rate than retail, with Environment Victoria Campaigns Director Mark Wakeham calling it a "fake feed-in tariff." A feed-in tariff requires a separate meter, and pays for all local generation at a preferential rate, while net metering requires only one meter. The financial differences are very substantial.

In Victoria, from 2009, householders were paid 60 cents for every excess kilowatt hour of energy fed back into the state electricity grid. This was around three times the retail price for electricity at that time. However, subsequent state governments reduced the feed-in in several updates, until in 2016 the feed-in is as low as 5 cents per kilowatt hour.

In Queensland starting in 2008, the Solar Bonus Scheme pays 44 cents for every excess kilowatt hour of energy fed back into the state electricity grid. This is around three times the current retail price for electricity. However, from 2012, the Queensland feed in tariff has been reduced to 6-10 cents per kilowatt hour depending on which electricity retailer the customer has signed up with.

Australian smart grid technologist, Steve Hoy, originated the opposing concept of "True Zero", as opposed to "Net Zero", to express the emerging capability to trace electricity through net metering. The meter allows consumers to trace their electricity to the source, making clean energy more accessible to everyone.

Canada

Ontario allows net metering for systems up to 500 kW, however credits can only be carried for 12 consecutive months. Should a consumer establish a credit where they generate more than they consume for 8 months and use up the credits in the 10th month, then the 12-month period begins again from the date that the next credit is shown on an invoice. Any unused credits remaining at the end of 12 consecutive months of a consumer being in a credit situation are cleared at the end of that billing.

Areas of British Columbia serviced by BC Hydro are allowed net metering for up to 100 kW. At each annual anniversary on March 1 the customer is paid a market price, calculated as daily average mid-Columbia price for a previous year. FortisBC which serves an area in South Central BC also allows net-metering for up to 50 kW. Customers are paid their existing retail rate for any net energy they produce. The City of New Westminster, which has its own electrical utility, also allows net metering.

New Brunswick allows net metering for installations up to 100 kW. Credits from excess generated power can be carried over until March at which time any excess credits are lost.

SaskPower allows net metering for installations up to 100 kW. Credits from excess generated power can be carried over until the customer's annual anniversary date, at which time any excess credits are lost.

In Nova Scotia, in 2015, 43 residences and businesses began using solar panels for electricity. By 2017, the number was up to 133. These customers’ solar systems are net metered. The excess power produced by the solar panels is bought back from the homeowner by Nova Scotia Power at the same rate that the utility sells it to its customers. “The downside for Nova Scotia Power is that it must maintain the capacity to produce electricity even when it is not sunny.”

European Union

Denmark established net-metering for privately owned PV systems in mid-1998 for a pilot-period of four years. In 2002 the net-metering scheme was extended another four years up to end of 2006. Net-metering has proved to be a cheap, easy to administer and effective way of stimulating the deployment of PV in Denmark; however the relative short time window of the arrangement has so far prevented it from reaching its full potential. During the political negotiations in the fall of 2005 the net-metering for privately owned PV systems was made permanent.

The Netherlands has net-metering since 2004. Initially there was a limit of 3000 kWh per year. Later this limit was increased to 5000 kWh. The limit was removed altogether on January 1, 2014.

Italy offers a support scheme, mixing net-metering and a well segmented premium FiT.

Slovenia has annual net-metering since January 2016 for up to 11 kVA. In a calendar year up to 10 MVA can be installed in the country.

In 2010, Spain, net-metering has been proposed by the Asociación de la Industria Fotovoltaica (ASIF) to promote renewable electricity, without requiring additional economic support. Net-metering for privately owned systems will be established in 2019, after Royal Decree 244/2019 was accepted by the government on April 5.

Some form of net metering is now proposed by Électricité de France. According to their website, energy produced by home-owners is bought at a higher price than what is charged as consumers. Hence, some recommend to sell all energy produced, and buy back all energy needed at a lower price. The price has been fixed for 20 years by the government.

Ireland is planning to implement a net metering system, under the "Micro-generation Support Scheme"

Under the proposed scheme, micro-generators can sell 30% of the excess electricity they produce and export it back to the grid. The price that electricity will be sold at is being formulated during the consultation process.

Poland has introduced net metering for private and commercial renewable energy sources of up to 50 kW in 2015. Under this legislation energy sent to grid must be used within one year from feed-in, otherwise it is considered as lost. The amount of energy that was exported and can be taken back by the user is subtracted by 20% for installations up to 10 kW, or by 30% for installations up to 50 kW. This legislation guarantees that this net metering policy will be kept for a minimum of 15 years from the moment of registering renewable energy source. This legislation together with government subsidies for microgeneration created a substantial boost in installations of PV systems in Poland.

Portugal has a very limited form of "net-metering" that is constrained to 15 minute periods where the excess injected in the grid is not compensated when above the consumption from the grid within each 15 minute period. Only the injected energy up to the consumed energy within the same 15 minute period is netted out of the final monthly bill. In fact the old analog electricity meters that would allow for true net-metering are immediately replaced when a consumer installs solar pv.

India

Almost every state in India has implemented net-metering, wherein, the consumers are allowed to sell the surplus energy generated by their solar system to the grid and get compensated for the same. However, the net-metering policy is not common throughout the country and varies from state to state.

To avail of net-metering in the country, the consumer is required to submit an application with the local electricity distribution company along with the planned rooftop solar project and requisite fee. The distribution company reviews the application and the feasibility of the solar project, which is either approved or rejected. If approved, another application for registration of the rooftop is submitted to the distribution company. An agreement is signed between the consumer and the company, and the net-meter is installed.

The Indian states of Karnataka and Andhra Pradesh have started the implementation of net metering, and the policy was announced by the respective state electricity boards in 2014. After review and inspection by the electricity board, a bidirectional meter is installed. Applications are taken up for up to 30% of the distribution transformer capacity on a first-come, first-served basis and technical feasibility.

Since September 2015, Maharashtra state (MERC) has also had a net metering policy and consumers have started installation of Solar Rooftop Grid Tie Net metering systems. MERC Policy allows up to 40% transformer capacity to be on Solar net metering.

The various DISCOMs in Maharashtra namely MSEDCL, Tata, Reliance and Torrent Power are expected to support net metering.

As of now MSEDCL does not use the TOD (Time of The Day differential) charging tariffs for residential consumers and net metering. Export and import units are considered at par for calculating Net Units and bill amount.

United States

Growth of net metering in the United States

Net metering is a policy by many states in the United States designed to help the adoption of renewable energy. Net metering was pioneered in the United States as a way to allow solar and wind to provide electricity whenever available and allow use of that electricity whenever it was needed, beginning with utilities in Idaho in 1980, and in Arizona in 1981. In 1983, Minnesota passed the first state net metering law. As of March 2015, 44 states and Washington, D.C. have developed mandatory net metering rules for at least some utilities. However, although the states' rules are clear, few utilities actually compensate at full retail rates.

Net metering policies are determined by states, which have set policies varying on a number of key dimensions. The Energy Policy Act of 2005 required state electricity regulators to "consider" (but not necessarily implement) rules that mandate public electric utilities make net metering available to their customers upon request. Several legislative bills have been proposed to institute a federal standard limit on net metering. They range from H.R. 729, which sets a net metering cap at 2% of forecasted aggregate customer peak demand, to H.R. 1945, which has no aggregate cap, but does limit residential users to 10 kW, a low limit compared to many states, such as New Mexico, with an 80,000 kW limit, or states such as Arizona, Colorado, New Jersey, and Ohio, which limit as a percentage of load.

Net purchase and sale

Net purchase and sale is a different method of providing power to the electricity grid that does not offer the price symmetry of net metering, making this system a lot less profitable for home users of small renewable electricity systems.

Under this arrangement, two uni-directional meters are installed—one records electricity drawn from the grid, and the other records excess electricity generated and fed back into the grid. The user pays retail rate for the electricity they use, and the power provider purchases their excess generation at its avoided cost (wholesale rate). There may be a significant difference between the retail rate the user pays and the power provider's avoided cost.

Germany, Spain, Ontario (Canada), some states in the USA, and other countries, on the other hand, have adopted a price schedule, or feed-in tariff (FIT), whereby customers get paid for any electricity they generate from renewable energy on their premises. The actual electricity being generated is counted on a separate meter, not just the surplus they feed back to the grid. In Germany, for the solar power generated, a feed-in tariff is being paid in order to boost solar power (figure from 2009). Germany once paid several times the retail rate for solar but has successfully reduced the rates drastically while actual installation of solar has grown exponentially at the same time due to installed cost reductions. Wind energy, in contrast, only receives around a half of the domestic retail rate, because the German system pays what each source costs (including a reasonable profit margin).

Virtual net metering

Another method of producing power to the grid is through virtual net metering (also called peer-to-peer (P2P) energy trading, wheeling and sometimes local energy trading). Peer-to-peer energy trading is a novel paradigm of power system operation, where sellers can generate their own energy in dwellings, offices and factories, and share it with each other locally. Several companies offering virtual net metering use blockchain technology.

Related technology

Sources that produce direct current, such as solar panels, must be coupled with an electrical inverter to convert the output to alternating current for use with conventional appliances. The phase of the outgoing power must be synchronized with the grid, and a mechanism must be included to disconnect the feed in the event of grid failure. This is for safety – for example, workers repairing downed power lines must be protected from "downstream" sources, in addition to being disconnected from the main "upstream" distribution grid. Although a small generator lacks the power to energize a loaded line, this can happen if the line is isolated from other loads. Solar inverters are designed for safety – while one inverter could not energize a line, a thousand might. In addition, electrical workers are trained to treat every line as though it was live, even when they know it should be safe.
Solar guerrilla

Solar guerrilla (or the guerrilla solar movement) is a term originated by Home Power Magazine and is applied to someone who connects solar panels without permission or notification and uses monthly net metering without regard for law.

Server (computing)

From Wikipedia, the free encyclopedia
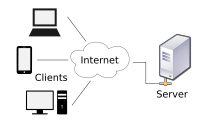
A computer network diagram of client computers communicating with a server computer via the Internet
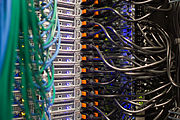
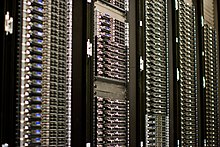
Wikimedia Foundation rackmount servers on racks in a data center
The first WWW server is located at CERN with its original sticker that says: "This machine is a server. DO NOT POWER IT DOWN!!"

In computing, a server is a piece of computer hardware or software (computer program) that provides functionality for other programs or devices, called "clients". This architecture is called the client–server model. Servers can provide various functionalities, often called "services", such as sharing data or resources among multiple clients or performing computations for a client. A single server can serve multiple clients, and a single client can use multiple servers. A client process may run on the same device or may connect over a network to a server on a different device. Typical servers are database servers, file servers, mail servers, print servers, web servers, game servers, and application servers.

Client–server systems are usually most frequently implemented by (and often identified with) the request–response model: a client sends a request to the server, which performs some action and sends a response back to the client, typically with a result or acknowledgment. Designating a computer as "server-class hardware" implies that it is specialized for running servers on it. This often implies that it is more powerful and reliable than standard personal computers, but alternatively, large computing clusters may be composed of many relatively simple, replaceable server components.

History

The use of the word server in computing comes from queueing theory, where it dates to the mid 20th century, being notably used in Kendall (1953) (along with "service"), the paper that introduced Kendall's notation. In earlier papers, such as the Erlang (1909), more concrete terms such as "[telephone] operators" are used.

In computing, "server" dates at least to RFC 5 (1969), one of the earliest documents describing ARPANET (the predecessor of Internet), and is contrasted with "user", distinguishing two types of host: "server-host" and "user-host". The use of "serving" also dates to early documents, such as RFC 4, contrasting "serving-host" with "using-host".

The Jargon File defines "server" in the common sense of a process performing service for requests, usually remote, with the 1981 (1.1.0) version reading:

SERVER n. A kind of DAEMON which performs a service for the requester, which often runs on a computer other than the one on which the server runs.

Operation

A network based on the client–server model where multiple individual clients request services and resources from centralized servers

Strictly speaking, the term server refers to a computer program or process (running program). Through metonymy, it refers to a device used for (or a device dedicated to) running one or several server programs. On a network, such a device is called a host. In addition to server, the words serve and service (as verb and as noun respectively) are frequently used, though servicer and servant are not.[a] The word service (noun) may refer to the abstract form of functionality, e.g. Web service. Alternatively, it may refer to a computer program that turns a computer into a server, e.g. Windows service. Originally used as "servers serve users" (and "users use servers"), in the sense of "obey", today one often says that "servers serve data", in the same sense as "give". For instance, web servers "serve [up] web pages to users" or "service their requests".

The server is part of the client–server model; in this model, a server serves data for clients. The nature of communication between a client and server is request and response. This is in contrast with peer-to-peer model in which the relationship is on-demand reciprocation. In principle, any computerized process that can be used or called by another process (particularly remotely, particularly to share a resource) is a server, and the calling process or processes is a client. Thus any general-purpose computer connected to a network can host servers. For example, if files on a device are shared by some process, that process is a file server. Similarly, web server software can run on any capable computer, and so a laptop or a personal computer can host a web server.

While request–response is the most common client-server design, there are others, such as the publish–subscribe pattern. In the publish-subscribe pattern, clients register with a pub-sub server, subscribing to specified types of messages; this initial registration may be done by request-response. Thereafter, the pub-sub server forwards matching messages to the clients without any further requests: the server pushes messages to the client, rather than the client pulling messages from the server as in request-response.

Purpose

The role of a server is to share data as well as to share resources and distribute work. A server computer can serve its own computer programs as well; depending on the scenario, this could be part of a quid pro quo transaction, or simply a technical possibility. The following table shows several scenarios in which a server is used.

Server type Purpose Clients
Application server Hosts web apps (computer programs that run inside a web browser) allowing users in the network to run and use them, without having to install a copy on their own computers. Unlike what the name might imply, these servers do not need to be part of the World Wide Web; any local network would do. Computers with a web browser
Catalog server Maintains an index or table of contents of information that can be found across a large distributed network, such as computers, users, files shared on file servers, and web apps. Directory servers and name servers are examples of catalog servers. Any computer program that needs to find something on the network, such a Domain member attempting to log in, an email client looking for an email address, or a user looking for a file
Communications server Maintains an environment needed for one communication endpoint (user or devices) to find other endpoints and communicate with them. It may or may not include a directory of communication endpoints and a presence detection service, depending on the openness and security parameters of the network Communication endpoints (users or devices)
Computing server Shares vast amounts of computing resources, especially CPU and random-access memory, over a network. Any computer program that needs more CPU power and RAM than a personal computer can probably afford. The client must be a networked computer; otherwise, there would be no client-server model.
Database server Maintains and shares any form of database (organized collections of data with predefined properties that may be displayed in a table) over a network. Spreadsheets, accounting software, asset management software or virtually any computer program that consumes well-organized data, especially in large volumes
Fax server Shares one or more fax machines over a network, thus eliminating the hassle of physical access Any fax sender or recipient
File server Shares files and folders, storage space to hold files and folders, or both, over a network Networked computers are the intended clients, even though local programs can be clients
Game server Enables several computers or gaming devices to play multiplayer video games Personal computers or gaming consoles
Mail server Makes email communication possible in the same way that a post office makes snail mail communication possible Senders and recipients of email
Media server Shares digital video or digital audio over a network through media streaming (transmitting content in a way that portions received can be watched or listened to as they arrive, as opposed to downloading an entire file and then using it) User-attended personal computers equipped with a monitor and a speaker
Print server Shares one or more printers over a network, thus eliminating the hassle of physical access Computers in need of printing something
Sound server Enables computer programs to play and record sound, individually or cooperatively Computer programs of the same computer and network clients.
Proxy server Acts as an intermediary between a client and a server, accepting incoming traffic from the client and sending it to the server. Reasons for doing so include content control and filtering, improving traffic performance, preventing unauthorized network access or simply routing the traffic over a large and complex network. Any networked computer
Virtual server Shares hardware and software resources with other virtual servers. It exists only as defined within specialized software called hypervisor. The hypervisor presents virtual hardware to the server as if it were real physical hardware. Server virtualization allows for a more efficient infrastructure. Any networked computer
Web server Hosts web pages. A web server is what makes the World Wide Web possible. Each website has one or more web servers. Also, each server can host multiple websites. Computers with a web browser

Almost the entire structure of the Internet is based upon a client–server model. High-level root nameservers, DNS, and routers direct the traffic on the internet. There are millions of servers connected to the Internet, running continuously throughout the world and virtually every action taken by an ordinary Internet user requires one or more interactions with one or more servers. There are exceptions that do not use dedicated servers; for example, peer-to-peer file sharing and some implementations of telephony (e.g. pre-Microsoft Skype).

Hardware

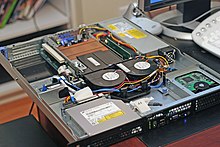
A rack-mountable server with the top cover removed to reveal internal components

Hardware requirement for servers vary widely, depending on the server's purpose and its software. Servers are more often than not, more powerful and expensive than the clients that connect to them.

Since servers are usually accessed over a network, many run unattended without a computer monitor or input device, audio hardware and USB interfaces. Many servers do not have a graphical user interface (GUI). They are configured and managed remotely. Remote management can be conducted via various methods including Microsoft Management Console (MMC), PowerShell, SSH and browser-based out-of-band management systems such as Dell's iDRAC or HP's iLo.

Large servers

Large traditional single servers would need to be run for long periods without interruption. Availability would have to be very high, making hardware reliability and durability extremely important. Mission-critical enterprise servers would be very fault tolerant and use specialized hardware with low failure rates in order to maximize uptime. Uninterruptible power supplies might be incorporated to guard against power failure. Servers typically include hardware redundancy such as dual power supplies, RAID disk systems, and ECC memory, along with extensive pre-boot memory testing and verification. Critical components might be hot swappable, allowing technicians to replace them on the running server without shutting it down, and to guard against overheating, servers might have more powerful fans or use water cooling. They will often be able to be configured, powered up and down, or rebooted remotely, using out-of-band management, typically based on IPMI. Server casings are usually flat and wide, and designed to be rack-mounted, either on 19-inch racks or on Open Racks.

These types of servers are often housed in dedicated data centers. These will normally have very stable power and Internet and increased security. Noise is also less of a concern, but power consumption and heat output can be a serious issue. Server rooms are equipped with air conditioning devices.

Clusters

A server farm or server cluster is a collection of computer servers maintained by an organization to supply server functionality far beyond the capability of a single device. Modern data centers are now often built of very large clusters of much simpler servers, and there is a collaborative effort, Open Compute Project around this concept.

Appliances

A class of small specialist servers called network appliances are generally at the low end of the scale, often being smaller than common desktop computers.

Mobile

A mobile server has a portable form factor, e.g. a laptop. In contrast to large data centers or rack servers, the mobile server is designed for on-the-road or ad hoc deployment into emergency, disaster or temporary environments where traditional servers are not feasible due to their power requirements, size, and deployment time. The main beneficiaries of so-called "server on the go" technology include network managers, software or database developers, training centers, military personnel, law enforcement, forensics, emergency relief groups, and service organizations. To facilitate portability, features such as the keyboard, display, battery (uninterruptible power supply, to provide power redundancy in case of failure), and mouse are all integrated into the chassis.

Operating systems

Sun's Cobalt Qube 3; a computer server appliance (2002); running Cobalt Linux (a customized version of Red Hat Linux, using the 2.2 Linux kernel), complete with the Apache web server.

On the Internet, the dominant operating systems among servers are UNIX-like open-source distributions, such as those based on Linux and FreeBSD, with Windows Server also having a significant share. Proprietary operating systems such as z/OS and macOS Server are also deployed, but in much smaller numbers. Servers that run Linux are commonly used as Webservers or Databanks. Windows Servers are used for Networks that are made out of Windows Clients.

Specialist server-oriented operating systems have traditionally had features such as:

  • GUI not available or optional
  • Ability to reconfigure and update both hardware and software to some extent without restart
  • Advanced backup facilities to permit regular and frequent online backups of critical data,
  • Transparent data transfer between different volumes or devices
  • Flexible and advanced networking capabilities
  • Automation capabilities such as daemons in UNIX and services in Windows
  • Tight system security, with advanced user, resource, data, and memory protection.
  • Advanced detection and alerting on conditions such as overheating, processor and disk failure.

In practice, today many desktop and server operating systems share similar code bases, differing mostly in configuration.

Energy consumption

In 2010, data centers (servers, cooling, and other electrical infrastructure) were responsible for 1.1-1.5% of electrical energy consumption worldwide and 1.7-2.2% in the United States. One estimate is that total energy consumption for information and communications technology saves more than 5 times its carbon footprint in the rest of the economy by increasing efficiency.

Global energy consumption is increasing due to the increasing demand of data and bandwidth. Natural Resources Defense Council (NRDC) states that data centers used 91 billion kilowatt hours (kWh) electrical energy in 2013 which accounts to 3% of global electricity usage.

Environmental groups have placed focus on the carbon emissions of data centers as it accounts to 200 million metric tons of carbon dioxide in a year.

United States incarceration rate

From Wikipedia, the free encyclopedia
A map of U.S. states by adult incarceration rate per 100,000 adult population, as of December 31, 2013. State prisons and local jails. Excludes federal prisoners.

According to the latest available data at the World Prison Brief on May 7, 2023, the United States has the sixth highest incarceration rate in the world, at 531 people per 100,000. Between 2019 and 2020, the United States saw a significant drop in the total number of incarcerations. State and federal prison and local jail incarcerations dropped by 14% from 2.1 million in 2019 to 1.8 million in mid-2020. In 2018, the United States had the highest incarceration rate in the world.

While the United States represents about 4.2 percent of the world's population, it houses around 20 percent of the world's prisoners. Corrections (which includes prisons, jails, probation, and parole) cost around $74 billion in 2007 according to the U.S. Bureau of Justice Statistics (BJS). According to the Justice Expenditures and Employment in the United States, 2017 report release by BJS, it is estimated that county and municipal governments spent roughly US$30 billion on corrections in 2017.

As of their March 2023 publication, the Prison Policy Initiative, a non-profit organization for decarceration, estimated that in the United States, about 1.9 million people were or are currently incarcerated. Of those who were incarcerated, 1,047,000 people were in state prison, 514,000 in local jails, 209,000 in federal prisons, 36,000 in youth correctional facilities, 34,000 in immigration detention camps, 22,000 in involuntary commitment, 8,000 in territorial prisons, 2,000 in Indian Country jails, and 1,000 in United States military prisons. The data is from various years depending on what is the latest available data.

Prison and jail population

Total incarceration in the United States by year
Total US incarceration peaked in 2008. Total correctional population peaked in 2007.

Total U.S. incarceration (prisons and jails) peaked in 2008. Total correctional population peaked in 2007. If all prisoners are counted (including those juvenile, territorial, U.S. Immigration and Customs Enforcement (ICE) (immigration detention), Indian country, and military), then in 2008 the United States had around 24.7% of the world's 9.8 million prisoners.

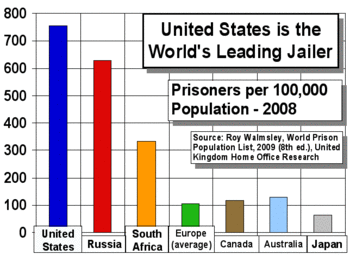
In 2009, the United States had the highest documented incarceration rate in the world, at 754 per 100,000. However, following over a decade of decarceration, the prison population had declined from a 2008 peak of 2,307,504 to 1,675,400 (500 per 100,000). This has resulted in a decline to the 6th highest incarceration rate of 505 per 100,000.

This number comprises local jails with a nominal capacity of 907,700 inmates occupied at 60.5%, state prisons with a nominal capacity of 1,121,402 occupied at 86.9%, and federal prisons with a nominal capacity of 134,133 occupied at 112.8%. Of this number, 23.3% are pretrial detainees (2019), 10.2% are female prisoners (2019), 0.2% are juveniles (2019), and 7.3% are foreign prisoners (2019).

The imprisonment rate varies widely by state; Louisiana surpasses this by about 100%, but Maine incarcerates at about a fifth this rate. A report released 28 February 2008, indicates that more than 1 in 100 adults in the United States are in prison.

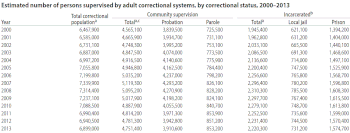
According to a U.S. Department of Justice report published in 2006, over 7.2 million people were at that time in prison, on probation, or on parole (released from prison with restrictions). That means roughly 1 in every 32 adult Americans are under some sort of criminal justice system control.

Growth and Subsequent Decline

US incarceration count, and rate per 100,000 population. Jails, state prisons, federal prisons.
Year Count Rate
1940 264,834 201
1950 264,620 176
1960 346,015 193
1970 503,586 161
1980 503,586 220
1985 744,208 311
1990 1,148,702 457
1995 1,585,586 592
2000 1,937,482 683
2002 2,033,022 703
2004 2,135,335 725
2006 2,258,792 752
2008 2,307,504 755
2010 2,270,142 731
2012 2,228,424 707
2014 2,217,947 693
2016 2,157,800 666
2018 2,102,400 642
2020 1,675,400 505

In the last quarter of the twentieth century, the incarceration rate in the US increased by a factor of five. Between the years 2001 and 2012, crime rates (both property and violent crimes) have declined 22% after already falling 30% in years prior between 1991 and 2001. In 2012, 710 out of every 100,000 U.S. residents were imprisoned in either local jails, state prisons, federal prisons, and privately operated facilities; close to a quarter of the global prison population.

The Bureau of Justice Statistics has released a study which finds that, despite the total number of prisoners incarcerated for drug-related offenses increasing by 57,000 between 1997 and 2004, the proportion of drug offenders to total prisoners in State prison populations stayed steady at 21%. The percentage of Federal prisoners serving time for drug offenses declined from 63% in 1997 to 55% in that same period. In the twenty-five years since the passage of the Anti-Drug Abuse Act of 1986, the United States penal population rose from around 300,000 to more than two million. Between 1986 and 1991, African-American women's incarceration in state prisons for drug offenses increased by 828 percent.

In 2009, the U.S. Department of Justice announced that the growth rate of the state prison population had fallen to its lowest since 2006, but it still had a 0.2% growth-rate compared to the total U.S. prison population. The California state prison system population fell in 2009, the first year that populations had fallen in 38 years.

When looking at specific populations within the criminal justice system the growth rates are vastly different. In 1977, there were just slightly more than eleven thousand incarcerated women. By 2004, the number of women under state or federal prison had increased by 757 percent, to more than 111,000, and the percentage of women in prison has increased every year, at roughly double the rate of men, since 2000. The rate of incarcerated women has expanded at about 4.6% annually between 1995 and 2005 with women now accounting for 7% of the population in state and federal prisons.

Comparison with other countries

In comparison to countries with similar percentages of immigrants, Germany has an incarceration rate of 67 per 100,000 population (as of June 2022), Italy is 97 per 100,000 (as of November 2022), and Saudi Arabia is 207 per 100,000 (as of 2017). When compared to other countries with a zero tolerance policy for illegal drugs, the rate of Russia is 304 per 100,000 (as of November 2022), Kazakhstan is 184 per 100,000 (as of July 2022), Singapore is 169 per 100,000 (as of December 2021), and Sweden is 74 per 100,000 (as of January 2022).

US timeline graphs of number of people incarcerated in jails and prisons.
The stats source is the World Prison Population List. 8th edition. Prisoners per 100,000 population.

Causes

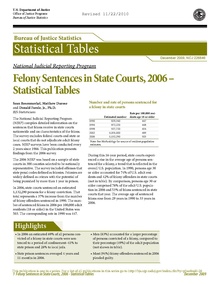
Felony Sentences in State Courts, study by the United States Department of Justice.
Correctional populations in the United States 1980–2013
2009. Percent of adult males incarcerated by race and ethnicity.

A 2014 report by the National Research Council identified two main causes of the increase in the United States' incarceration rate over the previous 40 years: longer prison sentences and increases in the likelihood of imprisonment. The same report found that longer prison sentences were the main driver of increasing incarceration rates since 1990.

Increased sentencing laws

Even though there are other countries that commit more inmates to prison annually, the fact that the United States keeps their prisoners longer causes the total rate to become higher. To give an example, the average burglary sentence in the United States is 16 months, compared to 5 months in Canada and 7 months in England.

Looking at reasons for imprisonment will further clarify why the incarceration rate and length of sentences are so high. The practice of imposing longer prison sentences on repeat offenders is common in many countries but the three-strikes laws in the U.S. with mandatory 25 year imprisonment — implemented in many states in the 1990s — are statutes enacted by state governments in the United States which mandate state courts to impose harsher sentences on habitual offenders who are previously convicted of two prior serious criminal offenses and then commit a third.

The Violent Crime Control and Law Enforcement Act of 1994 may have had a minor effect on mass incarceration.

Economic and age contributions

Crime rates in low-income areas are much higher than in middle to high class areas. As a result, Incarceration rates in low-income areas are much higher than in wealthier areas due to these high crime rates. When the incarcerated or criminal is a youth, there is a significant impact on the individual and rippling effects on entire communities. Social capital is lost when an individual is incarcerated. How much social capital is lost is hard to accurately estimate, however Aizer and Doyle found a strong positive correlation between lower income as an adult if an individual is incarcerated in their youth in comparison to those who are not incarcerated. 63 percent to 66 percent of those involved in crimes are under the age of thirty. People incarcerated at a younger age lose the capability to invest in themselves and in their communities. Their children and families become susceptible to financial burden preventing them from escaping low-income communities. This contributes to the recurring cycle of poverty that is positively correlated with incarceration. Poverty rates have not been curbed despite steady economic growth. Poverty is not the sole dependent variable for increasing incarceration rates. Incarceration leads to more incarceration by putting families and communities at a dynamic social disadvantage.

Drug sentencing laws

U.S. prisoners (excluding jails) as a percent of the population: male (dashed red), combined (solid black), female (dotted green)

The "War on Drugs" is a policy that was initiated by Richard Nixon with the Comprehensive Drug Abuse Prevention and Control Act of 1970 and vigorously pursued by Ronald Reagan. By 2010, drug offenders in federal prison had increased to 500,000 per year, up from 41,000 in 1985. According to Michelle Alexander, drug related charges accounted for more than half the rise in state prisoners between 1985 and 2000. 31 million people have been arrested on drug related charges, approximately 1 in 10 Americans. In contrast, John Pfaff of Fordham Law School has accused Alexander of exaggerating the influence of the War on Drugs on the rise in the United States' incarceration rate: according to him, the percent of state prisoners whose primary offense was drug-related peaked at 22% in 1990. The Brookings Institution reconciles the differences between Alexander and Pfaff by explaining two ways to look at the prison population as it relates to drug crimes, concluding "The picture is clear: Drug crimes have been the predominant reason for new admissions into state and federal prisons in recent decades" and "rolling back the war on drugs would not, as Pfaff and Urban Institute scholars maintain, totally solve the problem of mass incarceration, but it could help a great deal, by reducing exposure to prison."

As of December 2017, only 14.4% of state prisoners were serving sentences for a drug offenses with 3.7% of serving for possession and 10.8% serving for trafficking, other drug offenses, and unspecified drug offenses. Time served for drug related offenses are also amongst the shortest with prisoners released in 2016 having served an average sentence length 22 months while the median time served only 14 months.

After the passage of Reagan's Anti-Drug Abuse Act in 1986, incarceration for non-violent offenses dramatically increased. The Act imposed the same five-year mandatory sentence on those with convictions involving crack as on those possessing 100 times as much powder cocaine. This had a disproportionate effect on low-level street dealers and users of crack, who were more commonly poor blacks, Latinos, the young, and women.

Courts were given more discretion in sentencing by the Kimbrough v. United States (2007) decision, and the disparity was decreased to 18:1 by the Fair Sentencing Act of 2010.

By 2003, 58% of all women in federal prison were convicted of drug offenses. Black and Hispanic women in particular have been disproportionately affected by the War on Drugs. Since 1986, incarceration rates have risen by 400% for women of all races, while rates for Black women have risen by 800%. Formerly incarcerated Black women are also most negatively impacted by the collateral legal consequences of conviction.

According to the American Civil Liberties Union, "Even when women have minimal or no involvement in the drug trade, they are increasingly caught in the ever-widening net cast by current drug laws, through provisions of the criminal law such as those involving conspiracy, accomplice liability, and constructive possession that expand criminal liability to reach partners, relatives and bystanders."

These new policies also disproportionately affect African-American women. According to Dorothy E. Roberts, the explanation is that poor women, who are disproportionately black, are more likely to be placed under constant supervision by the State in order to receive social services. They are then more likely to be caught by officials who are instructed to look specifically for drug offenses. Roberts argues that the criminal justice system's creation of new crimes has a direct effect on the number of women, especially black women, who then become incarcerated.

Racialization

One of the first laws in the U.S. against drugs was the Smoking Opium Exclusion Act of 1909. It prohibited the smoking of opium, which was ingested but not smoked by a substantial portion of Caucasian housewives in America. It was smoked mainly by Asian American immigrants coming to build the railroads. These immigrants were targeted with anti-Asian sentiment, as many voters believed they were losing jobs to Asian immigrants.

Disproportional incarceration of black people

Currently, the U.S. is at its highest rate of imprisonment in history, with young Black men experiencing the highest levels of incarceration. One out of every 15 people imprisoned across the world is a Black American incarcerated in the United States. A 2004 study reported that the majority of people sentenced to prison in the United States are Black, and almost one-third of Black men in their twenties are either on parole, on probation, or in prison. These disproportionate levels of imprisonment have made incarceration a normalized occurrence for African-American communities. This has caused a distrust from Black individuals towards aspects of the legal system such as police, courts, and heavy sentences. In 2011, more than 580,000 Black men and women were in state or federal prison. Black men and women are imprisoned at higher rates compared to all other age groups, with the highest rate being Black men aged 25 to 39. In 2001, almost 17% of Black men had previously been imprisoned in comparison to 2.6% of White men. By the end of 2002, of the two million inmates of the U.S. incarceration system, Black men surpassed the number of White men (586,700 to 436,800 respectively of inmates with sentences more than one year). In the same year, there were also more Black women behind bars than White women (36,000 to 35,400). African-Americans are about eight times more likely to be imprisoned than Whites. The Sentencing Project, a Washington, D.C.-based non-profit organization, released in 1990 that almost one in four Black men in the U.S. between the ages of 20 and 29 were under some degree of control by the criminal justice system. In 1995, the organization announced that the rate had increased to one in three. In the same year, the non-profit stated that more than half of young Black men were then under criminal supervision in both D.C. and Baltimore. In addition, African-American women are the largest growing incarcerated population.

The War on Drugs plays a role in the disproportionate amount of incarcerated African-Americans. Despite a general decline in crime, the massive increase in new inmates due to drug offenses ensured historically high incarceration rates during the 1990s and beyond, with New York City serving as an example. Drug-related arrests continued to increase in the city despite a near 50% drop in felony crimes. While White individuals have a higher rate of drug use, 60% of people imprisoned for drug charges in 1998 were Black. Drug crimes constituted 27% of the increase in the number of Black state prisoners in the 1990s, while Whites experienced a 14% increase. The rise in African-American imprisonment as a result of newer drug crimes has been justified for its alleged societal benefits. Law officials and advocates of these policies argue that targeting underserved, primarily inner-city neighborhoods is appropriate because these areas see the more harmful and violent effects of drug use. These same individuals further point to the negative effects drug distribution has on these areas to support the inequity in how crimes involving, for example, powdered cocaine can be treated with less severity than crack cocaine. This ideology results in a greater number of arrests of poor, inner-city Black individuals.

A significant contributing factor to these figures are the racially and economically segregated neighborhoods that account for the majority of the Black prison population. These neighborhoods are normally impoverished and possess a high minority population. For example, as many as one in eight adult males who inhabit these urban areas is sent to prison each year, and one in four of these men is in prison on any given day. A 1992 study revealed that 72% of all New York State's prisoners came from only 7 of New York City's 55 community districts. Many recently released individuals return to the area they lived in prior to incarceration. Also in New York City, rates of incarceration stayed the same or grew in 1996 in neighborhoods that had the highest rates in 1990. Additionally, in these same neighborhoods, there was a stronger police presence and parole surveillance despite a period of a general decline in crime.

Finding employment post-release is a significant struggle for African-Americans. American sociologist Devah Pager performed a study to prove this. She assembled pairs of fake job seekers to find jobs with résumés that portrayed the applicant had a criminal record. The findings indicated that the presence of a criminal record reduced callbacks by approximately 50%. This was more common for African-Americans than for Whites.

Prison privatization

In the 1980s, the rising number of people incarcerated as a result of the War on Drugs and the wave of privatization that occurred under the Reagan Administration saw the emergence of the for-profit prison industry. Although modern private prisons did not exist in the US prior to the 1980s, the concept of private prisons can be found within the United States as early as the 1800s. In 1844, Louisiana privatized its penitentiary when it allowed a private company to run the facility as a factory where prisoners were used to manufacture clothing.

In a 2011 report by the ACLU, it is claimed that the rise of the for-profit prison industry is a "major contributor" to "mass incarceration," along with bloated state budgets. Louisiana, for example, has the highest rate of incarceration in the world with the majority of its prisoners being housed in privatized, for-profit facilities. Such institutions could face bankruptcy without a steady influx of prisoners. A 2013 Bloomberg report states that in the past decade the number of inmates in for-profit prisons throughout the U.S. rose 44 percent.

Corporations who operate prisons, such as CoreCivic (formerly the Corrections Corporation of America) and The GEO Group, spend significant amounts of money lobbying the federal government along with state governments. The two aforementioned companies, the largest in the industry, have been contributors to the American Legislative Exchange Council (ALEC), which seeks to expand the privatization of corrections and lobbies for policies that would increase incarceration, such as three-strike laws and "truth-in-sentencing" legislation. Prison companies also sign contracts with states that guarantee at least 90 percent of prison beds be filled. If these "lockup quotas" aren't met, the state must reimburse the prison company for the unused beds. Prison companies use the profits to expand and put pressure on lawmakers to incarcerate a certain number of people. This influence on the government by the private prison industry has been referred to as the Prison–industrial complex.

The industry is well aware of what reduced crime rates could mean to their bottom line. This from the CCA's SEC report in 2010:

Our growth … depends on a number of factors we cannot control, including crime rates … [R]eductions in crime rates … could lead to reductions in arrests, convictions and sentences requiring incarceration at correctional facilities.

In January 2021, U.S. President Joe Biden signed an executive order directing the Department of Justice (DOJ) to begin phasing out its contracts with private federal prisons.

As of March 2021, the private prison population of the United States has seen a 16% decline since reaching its peak in 2012 with 137,000 people incarcerated. According to a March 2021 report released by The Sentencing Project, 115,428 people were incarcerated in private prisons in the US, representing 8% of the total state and federal prison population.

Editorial policies of major media

Gallup polling since 1989 has found that in most years in which there was a decline in the U.S. crime rate, a majority of Americans said that violent crime was getting worse.

A substantial body of research claims that incarceration rates are primarily a function of media editorial policies, largely unrelated to the actual crime rate. Constructing Crime: Perspectives on Making News and Social Problems is a book collecting together papers on this theme. The researchers say that the jump in incarceration rate from 0.1% to 0.5% of the United States population from 1975 to 2000 (documented in the figure above) was driven by changes in the editorial policies of the mainstream commercial media and is unrelated to any actual changes in crime. Media consolidation reduced competition on content. That allowed media company executives to maintain substantially the same audience while slashing budgets for investigative journalism and filling the space from the police blotter, which tended to increase and stabilize advertising revenue. It is safer, easier and cheaper to write about crimes committed by poor people than the wealthy. Poor people can be libeled with impunity, but major advertisers can materially impact the profitability of a commercial media organization by reducing their purchases of advertising space with that organization.

News media thrive on feeding frenzies (such as missing white women) because they tend to reduce production costs while simultaneously building an audience interested in the latest development in a particular story. It takes a long time for a reporter to learn enough to write intelligently about a specific issue. Once a reporter has achieved that level of knowledge, it is easier to write subsequent stories. However, major advertisers have been known to spend their advertising budgets through different channels when they dislike the editorial policies. Therefore, a media feeding frenzy focusing on an issue of concern to an advertiser may reduce revenue and profits.

Sacco described how "competing news organizations responded to each other's coverage [while] the police, in their role as gatekeepers of crime news, reacted to the increased media interest by making available more stories that reflected and reinforced" a particular theme. "[T]he dynamics of competitive journalism created a media feeding frenzy that found news workers 'snatching at shocking numbers' and 'smothering reports of stable or decreasing use under more ominous headlines.'"

The reasons cited above for increased incarcerations (US racial demographics, Increased sentencing laws, and Drug sentencing laws) have been described as consequences of the shift in editorial policies of the mainstream media.

Additionally, media coverage has been proven to have a profound impact on criminal sentencing. Beale found that the more media attention a criminal case is given, the greater the incentive for prosecutors and judges to pursue harsher sentences. This is directly linked to the enormous increase in media coverage of crime over the past two decades. While crime decreased by 8% between 1992 and 2002, news reports on crime increased by 800% and the average prison sentence length increased by 2,000% for all crimes. Less media coverage means a greater chance of a lighter sentence or that the defendant may avoid prison time entirely.

Citizenship statistics

Inmate citizenship statistics, which are updated monthly by the Federal Bureau of Prisons, lists the following statistics for July 2021: 83.67% of Federal inmates are U.S. citizens; 9.3% are citizens of Mexico, and the next three countries—Colombia, Cuba, and the Dominican Republic, contribute less than 1% each; 4.9% have other or unknown citizenship. The Bureau did not state how many had come to the U.S. legally.

Introduction to entropy

From Wikipedia, the free encyclopedia https://en.wikipedia.org/wiki/Introduct...