Search This Blog

Friday, August 18, 2023

Arctic sea ice decline

From Wikipedia, the free encyclopedia
https://en.wikipedia.org/wiki/Arctic_sea_ice_decline

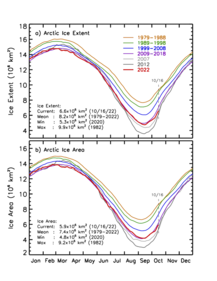
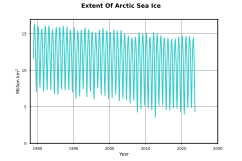
Decline in arctic sea ice extent (area) from 1979 to 2022
 
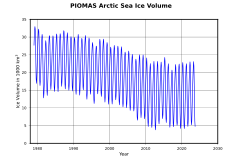
Decline in arctic sea ice volume from 1979 to 2022

Sea ice in the Arctic has declined in recent decades in area and volume due to climate change. It has been melting more in summer than it refreezes in winter. Global warming, caused by greenhouse gas forcing is responsible for the decline in Arctic sea ice. The decline of sea ice in the Arctic has been accelerating during the early twenty‐first century, with a decline rate of 4.7% per decade (it has declined over 50% since the first satellite records). It is also thought that summertime sea ice will cease to exist sometime during the 21st century.

The region is at its warmest in at least 4,000 years and the Arctic-wide melt season has lengthened at a rate of five days per decade (from 1979 to 2013), dominated by a later autumn freeze-up. The IPCC Sixth Assessment Report (2021) stated that Arctic sea ice area will likely drop below 1 million km2 in at least some Septembers before 2050. In September 2020, the US National Snow and Ice Data Center reported that the Arctic sea ice in 2020 had melted to an area of 3.74 million km2, its second-smallest area since records began in 1979.

Sea ice loss is one of the main drivers of Arctic amplification, the phenomenon that the Arctic warms faster than the rest of the world under climate change. It is hypothesized that sea ice decline also makes the jet stream weaker, which would cause more persistent and extreme weather in mid-latitudes. Shipping is more often possible in the Arctic now, and expected to increase further. Both the disappearance of sea ice and the resulting possibility of more human activity in the Arctic Ocean pose a risk to local wildlife such as polar bears.
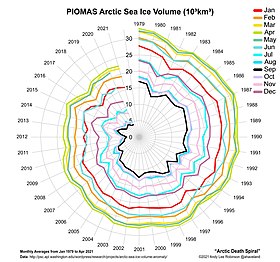
Monthly averages 1979–2021. Data source via the Polar Science Center (University of Washington).

Definitions

September 2, 2012, the record lowest minimum ever observed in the satellite record
September 2, 2012. Two weeks later, the record lowest minimum occurred: 3,410,000 square kilometres (1,320,000 sq mi).

The Arctic Ocean is the mass of water positioned approximately above latitude 65° N. Arctic Sea Ice refers to the area of the Arctic Ocean covered by ice. The Arctic sea ice minimum is the day in a given year when Arctic sea ice reaches its smallest extent, occurring at the end of the summer melting season, normally during September. Arctic Sea ice maximum is the day of a year when Arctic sea ice reaches its largest extent near the end of the Arctic cold season, normally during March. Typical data visualizations for Arctic sea ice include average monthly measurements or graphs for the annual minimum or maximum extent, as shown in the adjacent images.

Sea ice extent is defined as the area with at least 15% of sea ice cover; it is more often used as a metric than simple total sea ice area. This metric is used to address uncertainty in distinguishing open sea water from melted water on top of solid ice, which satellite detection methods have difficulty differentiating. This is primarily an issue in summer months.

Observations

Average decadal extent and area of the Arctic Ocean sea ice since 1979.
Average decadal extent and area of the Arctic Ocean sea ice since the start of satellite observations.
Annual trend in the Arctic sea ice extent and area for the 2011-2022 time period.

A 2007 study found the decline to be "faster than forecasted" by model simulations. A 2011 study suggested that it could be reconciled by internal variability enhancing the greenhouse gas-forced sea ice decline over the last few decades. A 2012 study, with a newer set of simulations, also projected rates of retreat that were somewhat less than that actually observed.

Satellite era
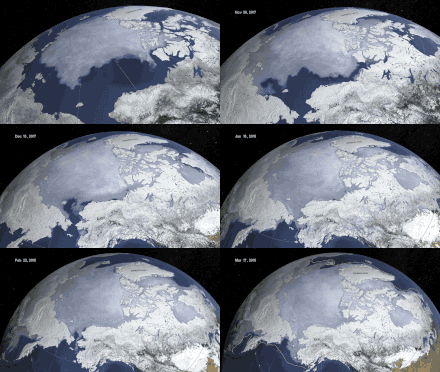
2018 sea ice extent visualization

Observation with satellites shows that Arctic sea ice area, extent, and volume have been in decline for a few decades. The amount of multi-year sea ice in the Arctic has declined considerably in recent decades. In 1988, ice that was at least 4 years old accounted for 26% of the Arctic's sea ice. By 2013, ice that age was only 7% of all Arctic sea ice.

Scientists recently measured sixteen-foot (five-meter) wave heights during a storm in the Beaufort Sea in mid-August until late October 2012. This is a new phenomenon for the region, since a permanent sea ice cover normally prevents wave formation. Wave action breaks up sea ice, and thus could become a feedback mechanism, driving sea ice decline.

For January 2016, the satellite-based data showed the lowest overall Arctic sea ice extent of any January since records began in 1979. Bob Henson from Wunderground noted:

Hand in hand with the skimpy ice cover, temperatures across the Arctic have been extraordinarily warm for midwinter. Just before New Year’s, a slug of mild air pushed temperatures above freezing to within 200 miles of the North Pole. That warm pulse quickly dissipated, but it was followed by a series of intense North Atlantic cyclones that sent very mild air poleward, in tandem with a strongly negative Arctic oscillation during the first three weeks of the month.

January 2016's remarkable phase transition of Arctic oscillation was driven by a rapid tropospheric warming in the Arctic, a pattern that appears to have increased surpassing the so-called stratospheric sudden warming. The previous record of the lowest extent of the Arctic Ocean covered by ice in 2012 saw a low of 1.31 million square miles (3.387 million square kilometers). This replaced the previous record set on September 18, 2007, at 1.61 million square miles (4.16 million square kilometers). The minimum extent on 18th Sept 2019 was 1.60 million square miles (4.153 million square kilometers). 

A 2018 study of the thickness of sea ice found a decrease of 66% or 2.0 m over the last six decades and a shift from permanent ice to largely seasonal ice cover.

Future ice loss

Arctic sea ice grows and extends through the winter. On March 7, 2017, Arctic sea ice reached its record lowest maximum.

An "ice-free" Arctic Ocean, sometimes referred to as a "Blue Ocean Event", is often defined as "having less than 1 million square kilometers of sea ice", because it is very difficult to melt the thick ice around the Canadian Arctic Archipelago. The IPCC AR5 defines "nearly ice-free conditions" as a sea ice extent of less than 106 km2 for at least five consecutive years.

Estimating the exact year when the Arctic Ocean will become "ice-free" is very difficult, due to the large role of interannual variability in sea ice trends. In Overland and Wang (2013), the authors investigated three different ways of predicting future sea ice levels. They noted that the average of all models used in 2013 was decades behind the observations, and only the subset of models with the most aggressive ice loss was able to match the observations. However, the authors cautioned that there is no guarantee those models would continue to match the observations, and hence that their estimate of ice-free conditions first appearing in 2040s may still be flawed. Thus, they advocated for the use of expert judgement in addition to models to help predict ice-free Arctic events, but they noted that expert judgement could also be done in two different ways: directly extrapolating ice loss trends (which would suggest and ice-free Arctic in 2020) or assuming a slower decline trend punctuated by the occasional "big melt" seasons (such as those of 2007 and 2012) which pushes back the date to 2028 or further into 2030s, depending on the starting assumptions about the timing and the extent of the next "big melt". Consequently, there has been a recent history of competing projections from climate models and from individual experts.

Climate models

A 2006 paper examined projections from the Community Climate System Model and predicted "near ice-free September conditions by 2040".

A 2009 paper from Muyin Wang and James E. Overland applied observational constraints to the projections from six CMIP3 climate models and estimated nearly ice-free Arctic Ocean around September 2037, with a chance it could happen as early as 2028. In 2012, this pair of researchers repeated the exercise with CMIP5 models and found that under the highest-emission scenario in CMIP5, Representative Concentration Pathway 8.5, ice-free September first occurs between 14 and 36 years after the baseline year of 2007, with the median of 28 years (i.e. around 2035).

In 2009, a study using 18 CMIP3 climate models found that they project ice-free Arctic a little before 2100 under a scenario of medium future greenhouse gas emissions. In 2012, a different team used CMIP5 models and their moderate emission scenario, RCP 4.5 (which represents somewhat lower emissions than the scenario in CMIP3), and found that while their mean estimate avoids ice-free Arctic before the end of the century, ice-free conditions in 2045 were within one standard deviation of the mean.

In 2013, a study compared projections from the best-performing subset of CMIP5 models with the output from all 30 models after it was constrained by the historical ice conditions, and found good agreement between these approaches. Altogether, it projected ice-free September between 2054 and 2058 under RCP 8.5, while under RCP 4.5, Arctic ice gets very close to the ice-free threshold in 2060s, but does not cross it by the end of the century, and stays at an extent of 1.7 million km2.

In 2014, IPCC Fifth Assessment Report indicated a risk of ice-free summer around 2050 under the scenario of highest possible emissions.

The Third U.S. National Climate Assessment (NCA), released May 6, 2014, reported that the Arctic Ocean is expected to be ice free in summer before mid-century. Models that best match historical trends project a nearly ice-free Arctic in the summer by the 2030s.

In 2021, IPCC Sixth Assessment Report report assesses that there is "high confidence" that the Arctic Ocean will likely become practically ice-free in September before the year 2050 under all SSP scenarios.

A paper published in 2021 shows that the CMIP6 models which perform the best at simulating Arcic sea ice trends project the first ice-free conditions around 2035 under SSP5-8.5, which is the scenario of continually accelerating greenhouse gas emissions.

By weighting multiple CMIP6 projections, the first year of an ice-free Arctic is likely to occur during 2040–2072 under the SSP3-7.0 scenario.

Impacts on the physical environment

Global climate change
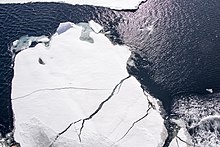
The dark ocean surface reflects only 6 percent of incoming solar radiation; instead sea ice reflects 50 to 70 percent.

Arctic sea ice maintains the cool temperature of the polar regions and it has an important albedo effect on the climate. Its bright shiny surface reflects sunlight during the Arctic summer; dark ocean surface exposed by the melting ice absorbs more sunlight and becomes warmer, which increases the total ocean heat content and helps to drive further sea ice loss during the melting season, as well as potentially delaying its recovery during the polar night. Arctic ice decline between 1979 and 2011 is estimated to have been responsible for as much radiative forcing as a quarter of CO2 emissions the same period, which is equivalent to around 10% of the cumulative CO2 increase since the start of the Industrial Revolution. When compared to the other greenhouse gases, it has had the same impact as the cumulative increase in nitrous oxide, and nearly half of the cumulative increase in methane concentrations.

The effect of Arctic sea ice decline on global warming will intensify in the future as more and more ice is lost. This feedback has been accounted for by all CMIP5 and CMIP6 models, and it is included in all warming projections they make, such as the estimated warming by 2100 under each Representative Concentration Pathway and Shared Socioeconomic Pathway. They are also capable of resolving the second-order effects of sea ice loss, such as the effect on lapse rate feedback, the changes in water vapor concentrations and regional cloud feedbacks.

Ice-free summer vs. ice-free winter

As ice melts, the liquid water collects in depressions on the surface and deepens them, forming these melt ponds in the Arctic. These fresh water ponds are separated from the salty sea below and around it, until breaks in the ice merge the two.

In 2021, the IPCC Sixth Assessment Report said with high confidence that there is no hysteresis and no tipping point in the loss of Arctic summer sea ice. This can be explained by the increased influence of stabilizing feedback compared to the ice albedo feedback. Specifically, thinner sea ice leads to increased heat loss in the winter, creating a negative feedback loop. This counteracts the positive ice albedo feedback. As such, sea ice would recover even from a true ice-free summer during the winter, and if the next Arctic summer is less warm, it may avoid another ice-free episode until another similarly warm year down the line. However, higher levels of global warming would delay the recovery from ice-free episodes and make them occur more often and earlier in the summer. A 2018 paper estimated that an ice-free September would occur once in every 40 years under a global warming of 1.5 degrees Celsius, but once in every 8 years under 2 degrees and once in every 1.5 years under 3 degrees.

Very high levels of global warming could eventually prevent Arctic sea ice from reforming during the Arctic winter. This is known as an ice-free winter, and it ultimately amounts to a total of loss of Arctic ice throughout the year. A 2022 assessment found that unlike an ice-free summer, it may represent an irreversible tipping point. It estimated that it is most likely to occur at around 6.3 degrees Celsius, though it could potentially occur as early as 4.5 °C or as late as 8.7 °C. Relative to today's climate, an ice-free winter would add 0.6 degrees, with a regional warming between 0.6 and 1.2 degrees.

Amplified Arctic warming

Arctic amplification and its acceleration is strongly tied to declining Arctic sea ice: modelling studies show that strong Arctic amplification only occurs during the months when significant sea ice loss occurs, and that it largely disappears when the simulated ice cover is held fixed. Conversely, the high stability of ice cover in Antarctica, where the thickness of the East Antarctic ice sheet allows it to rise nearly 4 km above the sea level, means that this continent has not experienced any net warming over the past seven decades: ice loss in the Antarctic and its contribution to sea level rise is instead driven entirely by the warming of the Southern Ocean, which had absorbed 35–43% of the total heat taken up by all oceans between 1970 and 2017.

Impacts on extreme weather

Meanders (Rossby Waves) of the Northern Hemisphere's polar jet stream developing (a), (b); then finally detaching a "drop" of cold air (c). Orange: warmer masses of air; pink: jet stream.
Since the early 2000s, climate models have consistently identified that global warming will gradually push jet streams poleward. In 2008, this was confirmed by observational evidence, which proved that from 1979 to 2001, the northern jet stream moved northward at an average rate of 2.01 kilometres (1.25 mi) per year, with a similar trend in the Southern Hemisphere jet stream. Climate scientists have hypothesized that the jet stream will also gradually weaken as a result of global warming. Trends such as Arctic sea ice decline, reduced snow cover, evapotranspiration patterns, and other weather anomalies have caused the Arctic to heat up faster than other parts of the globe, in what is known as the Arctic amplification. In 2021-2022, it was found that since 1979, the warming within the Arctic Circle has been nearly four times faster than the global average, and some hotspots in the Barents Sea area warmed up to seven times faster than the global average. While the Arctic remains one of the coldest places on Earth today, the temperature gradient between it and the warmer parts of the globe will continue to diminish with every decade of global warming as the result of this amplification. If this gradient has a strong influence on the jet stream, then it will eventually become weaker and more variable in its course, which would allow more cold air from the polar vortex to leak mid-latitudes and slow the progression of Rossby Waves, leading to more persistent and more extreme weather.

Barents Sea ice

Barents Sea is the fastest-warming part of the Arctic, and some assessments now treat Barents sea ice as a separate tipping point from the rest of the Arctic sea ice, suggesting that it could permanently disappear once the global warming exceeds 1.5 degrees. This rapid warming also makes it easier to detect any potential connections between the state of sea ice and weather conditions elsewhere than in any other area. The first study proposing a connection between floating ice decline in the Barents Sea and the neighbouring Kara Sea and more intense winters in Europe was published in 2010, and there has been extensive research into this subject since then. For instance, a 2019 paper holds BKS ice decline responsible for 44% of the 1995–2014 central Eurasian cooling trend, far more than indicated by the models, while another study from that year suggests that the decline in BKS ice reduces snow cover in the North Eurasia but increases it in central Europe. There are also potential links to summer precipitation: a connection has been proposed between the reduced BKS ice extent in November–December and greater June rainfall over South China. One paper even identified a connection between Kara Sea ice extent and the ice cover of Lake Qinghai on the Tibetan Plateau.

However, BKS ice research is often subject to the same uncertainty as the broader research into Arctic amplification/whole-Arctic sea ice loss and the jet stream, and is often challenged by the same data. Nevertheless, the most recent research still finds connections which are statistically robust, yet non-linear in nature: two separate studies published in 2021 indicate that while autumn BKS ice loss results in cooler Eurasian winters, ice loss during winter makes Eurasian winters warmer: as BKS ice loss accelerates, the risk of more severe Eurasian winter extremes diminishes while heatwave risk in the spring and summer is magnified.

Other possible impacts on weather

In 2019, it was proposed that the reduced sea ice around Greenland in autumn affects snow cover during the Eurasian winter, and this intensifies Korean summer monsoon, and indirectly affects the Indian summer monsoon.

2021 research suggested that autumn ice loss in the East Siberian Sea, Chukchi Sea and Beaufort Sea can affect spring Eurasian temperature. Autumn sea ice decline of one standard deviation in that region would reduce mean spring temperature over central Russia by nearly 0.8 °C, while increasing the probability of cold anomalies by nearly a third.

Atmospheric chemistry

Cracks in sea ice can expose the food chain to greater amounts of atmospheric mercury.

A 2015 study concluded that Arctic sea ice decline accelerates methane emissions from the Arctic tundra, with the emissions for 2005-2010 being around 1.7 million tonnes higher than they would have been with the sea ice at 1981–1990 levels. One of the researchers noted, "The expectation is that with further sea ice decline, temperatures in the Arctic will continue to rise, and so will methane emissions from northern wetlands."

Shipping

Map illustrating various Arctic shipping routes

Economic implications of ice-free summers and the decline in Arctic ice volumes include a greater number of journeys across the Arctic Ocean Shipping lanes during the year. This number has grown from 0 in 1979 to 400–500 along the Bering strait and >40 along the Northern Sea Route in 2013. Traffic through the Arctic Ocean is likely to increase further. An early study by James Hansen and colleagues suggested in 1981 that a warming of 5 to 10 °C, which they expected as the range of Arctic temperature change corresponding to doubled CO2 concentrations, could open the Northwest Passage. A 2016 study concludes that Arctic warming and sea ice decline will lead to "remarkable shifts in trade flows between Asia and Europe, diversion of trade within Europe, heavy shipping traffic in the Arctic and a substantial drop in Suez traffic. Projected shifts in trade also imply substantial pressure on an already threatened Arctic ecosystem."

In August 2017, the first ship traversed the Northern Sea Route without the use of ice-breakers. Also in 2017, the Finnish icebreaker MSV Nordica set a record for the earliest crossing of the Northwest Passage. According to the New York Times, this forebodes more shipping through the Arctic, as the sea ice melts and makes shipping easier. A 2016 report by the Copenhagen Business School found that large-scale trans-Arctic shipping will become economically viable by 2040.

Impacts on wildlife

The decline of Arctic sea ice will provide humans with access to previously remote coastal zones. As a result, this will lead to an undesirable effect on terrestrial ecosystems and put marine species at risk.

Sea ice decline has been linked to boreal forest decline in North America and is assumed to culminate with an intensifying wildfire regime in this region. The annual net primary production of the Eastern Bering Sea was enhanced by 40–50% through phytoplankton blooms during warm years of early sea ice retreat.

Polar bears are turning to alternative food sources because Arctic sea ice melts earlier and freezes later each year. As a result, they have less time to hunt their historically preferred prey of seal pups, and must spend more time on land and hunt other animals. As a result, the diet is less nutritional, which leads to reduced body size and reproduction, thus indicating population decline in polar bears. The Arctic refuge is where polar bears main habitat is to den and the melting arctic sea ice is causing a loss of species. There are only about 900 bears in the Arctic refuge national conservation area.

As arctic ice decays, microorganisms produce substances with various effects on melting and stability. Certain types of bacteria in rotten ice pores produce polymer-like substances, which may influence the physical properties of the ice. A team from the University of Washington studying this phenomenon hypothesizes that the polymers may provide a stabilizing effect to the ice. However, other scientists have found algae and other microorganisms help create a substance, cryoconite, or create other pigments that increase rotting and increase the growth of the microorganisms.
Bomb


From Wikipedia, the free encyclopedia
https://en.wikipedia.org/wiki/Bomb
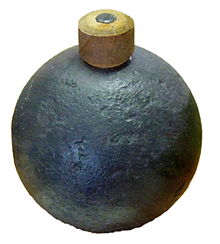
An iron grenade with a wooden fuse from 1580

A bomb is an explosive weapon that uses the exothermic reaction of an explosive material to provide an extremely sudden and violent release of energy. Detonations inflict damage principally through ground- and atmosphere-transmitted mechanical stress, the impact and penetration of pressure-driven projectiles, pressure damage, and explosion-generated effects. Bombs have been utilized since the 11th century starting in East Asia.

The term bomb is not usually applied to explosive devices used for civilian purposes such as construction or mining, although the people using the devices may sometimes refer to them as a "bomb". The military use of the term "bomb", or more specifically aerial bomb action, typically refers to airdropped, unpowered explosive weapons most commonly used by air forces and naval aviation. Other military explosive weapons not classified as "bombs" include shells, depth charges (used in water), or land mines. In unconventional warfare, other names can refer to a range of offensive weaponry. For instance, in recent Middle Eastern conflicts, homemade bombs called "improvised explosive devices" (IEDs) have been employed by insurgent fighters to great effectiveness.

The word comes from the Latin bombus, which in turn comes from the Greek βόμβος romanized bombos, an onomatopoetic term meaning 'booming', 'buzzing'.

A "wind-and-dust" bomb depicted in the Ming Dynasty book Huolongjing. The pot contains a tube of gunpowder, and was thrown at invaders.

History

An illustration depicting bombs thrown at Manchu assault ladders during the siege of Ningyuan, from the book Thai Tsu Shih Lu Thu (Veritable Records of the Great Ancestor) written in 1635. The bombs are known as "thunder crash bombs."

Explosive bombs were used in East Asia in 1221, by a Jurchen Jin army against a Chinese Song city. Bombs built using bamboo tubes appear in the 11th century. Bombs made of cast iron shells packed with explosive gunpowder date to 13th century China. The term was coined for this bomb (i.e. "thunder-crash bomb") during a Jin dynasty (1115–1234) naval battle of 1231 against the Mongols.

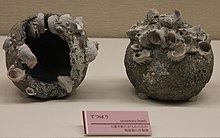
Thunder crash bombs from the Mongol invasions of Japan (13th century) that were excavated from a shipwreck near the Liancourt Rocks

The History of Jin 《金史》 (compiled by 1345) states that in 1232, as the Mongol general Subutai (1176–1248) descended on the Jin stronghold of Kaifeng, the defenders had a "thunder crash bomb" which "consisted of gunpowder put into an iron container ... then when the fuse was lit (and the projectile shot off) there was a great explosion the noise whereof was like thunder, audible for more than thirty miles, and the vegetation was scorched and blasted by the heat over an area of more than half a mou. When hit, even iron armour was quite pierced through."

The Song Dynasty (960–1279) official Li Zengbo wrote in 1257 that arsenals should have several hundred thousand iron bomb shells available and that when he was in Jingzhou, about one to two thousand were produced each month for dispatch of ten to twenty thousand at a time to Xiangyang and Yingzhou. The Ming Dynasty text Huolongjing describes the use of poisonous gunpowder bombs, including the "wind-and-dust" bomb.

During the Mongol invasions of Japan, the Mongols used the explosive "thunder-crash bombs" against the Japanese. Archaeological evidence of the "thunder-crash bombs" has been discovered in an underwater shipwreck off the shore of Japan by the Kyushu Okinawa Society for Underwater Archaeology. X-rays by Japanese scientists of the excavated shells confirmed that they contained gunpowder.

Shock

Explosive shock waves can cause situations such as body displacement (i.e., people being thrown through the air), dismemberment, internal bleeding and ruptured eardrums.

Shock waves produced by explosive events have two distinct components, the positive and negative wave. The positive wave shoves outward from the point of detonation, followed by the trailing vacuum space "sucking back" towards the point of origin as the shock bubble collapses. The greatest defense against shock injuries is distance from the source of shock. As a point of reference, the overpressure at the Oklahoma City bombing was estimated in the range of 28 MPa.

Heat

A thermal wave is created by the sudden release of heat caused by an explosion. Military bomb tests have documented temperatures of up to 2,480 °C (4,500 °F). While capable of inflicting severe to catastrophic burns and causing secondary fires, thermal wave effects are considered very limited in range compared to shock and fragmentation. This rule has been challenged, however, by military development of thermobaric weapons, which employ a combination of negative shock wave effects and extreme temperature to incinerate objects within the blast radius.

Fragmentation

An illustration of a fragmentation bomb from the 14th century Ming Dynasty text Huolongjing. The black dots represent iron pellets.

Fragmentation is produced by the acceleration of shattered pieces of bomb casing and adjacent physical objects. The use of fragmentation in bombs dates to the 14th century, and appears in the Ming Dynasty text Huolongjing. The fragmentation bombs were filled with iron pellets and pieces of broken porcelain. Once the bomb explodes, the resulting fragments are capable of piercing the skin and blinding enemy soldiers.

While conventionally viewed as small metal shards moving at super-supersonic and hypersonic speeds, fragmentation can occur in epic proportions and travel for extensive distances. When the SS Grandcamp exploded in the Texas City Disaster on April 16, 1947, one fragment of that blast was a two-ton anchor which was hurled nearly two miles inland to embed itself in the parking lot of the Pan American refinery.

Effects on living things

To people who are close to a blast incident, such as bomb disposal technicians, soldiers wearing body armor, deminers, or individuals wearing little to no protection, there are four types of blast effects on the human body: overpressure (shock), fragmentation, impact, and heat. Overpressure refers to the sudden and drastic rise in ambient pressure that can damage the internal organs, possibly leading to permanent damage or death. Fragmentation can also include sand, debris and vegetation from the area surrounding the blast source. This is very common in anti-personnel mine blasts. The projection of materials poses a potentially lethal threat caused by cuts in soft tissues, as well as infections, and injuries to the internal organs. When the overpressure wave impacts the body it can induce violent levels of blast-induced acceleration. Resulting injuries may range from minor to unsurvivable. Immediately following this initial acceleration, deceleration injuries can occur when a person impacts directly against a rigid surface or obstacle after being set in motion by the force of the blast. Finally, injury and fatality can result from the explosive fireball as well as incendiary agents projected onto the body. Personal protective equipment, such as a bomb suit or demining ensemble, as well as helmets, visors and foot protection, can dramatically reduce the four effects, depending upon the charge, proximity and other variables.

Types

Diagram of a simple time bomb in the form of a pipe bom
An American B61 nuclear bomb on its loading carriage
Unexploded unguided aerial bomb with contact fuse used by the Portuguese Air Force, Guinea-Bissau War of Independence, March 1974.

Experts commonly distinguish between civilian and military bombs. The latter are almost always mass-produced weapons, developed and constructed to a standard design out of standard components and intended to be deployed in a standard explosive device. IEDs are divided into three basic categories by basic size and delivery. Type 76, IEDs are hand-carried parcel or suitcase bombs, type 80, are "suicide vests" worn by a bomber, and type 3 devices are vehicles laden with explosives to act as large-scale stationary or self-propelled bombs, also known as VBIED (vehicle-borne IEDs).

Improvised explosive materials are typically unstable and subject to spontaneous, unintentional detonation triggered by a wide range of environmental effects, ranging from impact and friction to electrostatic shock. Even subtle motion, change in temperature, or the nearby use of cellphones or radios can trigger an unstable or remote-controlled device. Any interaction with explosive materials or devices by unqualified personnel should be considered a grave and immediate risk of death or dire injury. The safest response to finding an object believed to be an explosive device is to get as far away from it as possible.

Atomic bombs are based on the theory of nuclear fission, that when a large atom splits, it releases a massive amount of energy. Thermonuclear weapons, (colloquially known as "hydrogen bombs") use the energy from an initial fission explosion to create an even more powerful fusion explosion.

The term "dirty bomb" refers to a specialized device that relies on a comparatively low explosive yield to scatter harmful material over a wide area. Most commonly associated with radiological or chemical materials, dirty bombs seek to kill or injure and then to deny access to a contaminated area until a thorough clean-up can be accomplished. In the case of urban settings, this clean-up may take extensive time, rendering the contaminated zone virtually uninhabitable in the interim.

The power of large bombs is typically measured in kilotons (kt) or megatons of TNT (Mt). The most powerful bombs ever used in combat were the two atomic bombs dropped by the United States to attack Hiroshima and Nagasaki, and the most powerful ever tested was the Tsar Bomba. The most powerful non-nuclear bomb is Russian "Father of All Bombs" (officially Aviation Thermobaric Bomb of Increased Power (ATBIP)) followed by the United States Air Force's MOAB (officially Massive Ordnance Air Blast, or more commonly known as the "Mother of All Bombs").

Below is a list of five different types of bombs based on the fundamental explosive mechanism they employ.

Compressed gas

Relatively small explosions can be produced by pressurizing a container until catastrophic failure such as with a dry ice bomb. Technically, devices that create explosions of this type can not be classified as "bombs" by the definition presented at the top of this article. However, the explosions created by these devices can cause property damage, injury, or death. Flammable liquids, gasses and gas mixtures dispersed in these explosions may also ignite if exposed to a spark or flame.

Low explosive

The simplest and oldest bombs store energy in the form of a low explosive. Black powder is an example of a low explosive. Low explosives typically consist of a mixture of an oxidizing salt, such as potassium nitrate (saltpeter), with solid fuel, such as charcoal or aluminium powder. These compositions deflagrate upon ignition, producing hot gas. Under normal circumstances, this deflagration occurs too slowly to produce a significant pressure wave; low explosives, therefore, must generally be used in large quantities or confined in a container with a high burst pressure to be useful as a bomb.

High explosive

A high explosive bomb is one that employs a process called "detonation" to rapidly go from an initially high energy molecule to a very low energy molecule. Detonation is distinct from deflagration in that the chemical reaction propagates faster than the speed of sound (often many times faster) in an intense shock wave. Therefore, the pressure wave produced by a high explosive is not significantly increased by confinement as detonation occurs so quickly that the resulting plasma does not expand much before all the explosive material has reacted. This has led to the development of plastic explosive. A casing is still employed in some high explosive bombs, but with the purpose of fragmentation. Most high explosive bombs consist of an insensitive secondary explosive that must be detonated with a blasting cap containing a more sensitive primary explosive.

Thermobaric

A thermobaric bomb is a type of explosive that utilizes oxygen from the surrounding air to generate an intense, high-temperature explosion, and in practice the blast wave typically produced by such a weapon is of a significantly longer duration than that produced by a conventional condensed explosive. The fuel-air bomb is one of the best-known types of thermobaric weapons.

Nuclear fission

Nuclear fission type atomic bombs utilize the energy present in very heavy atomic nuclei, such as U-235 or Pu-239. In order to release this energy rapidly, a certain amount of the fissile material must be very rapidly consolidated while being exposed to a neutron source. If consolidation occurs slowly, repulsive forces drive the material apart before a significant explosion can occur. Under the right circumstances, rapid consolidation can provoke a chain reaction that can proliferate and intensify by many orders of magnitude within microseconds. The energy released by a nuclear fission bomb may be tens of thousands of times greater than a chemical bomb of the same mass.

Nuclear fusion

A thermonuclear weapon is a type of nuclear bomb that releases energy through the combination of fission and fusion of the light atomic nuclei of deuterium and tritium. With this type of bomb, a thermonuclear detonation is triggered by the detonation of a fission type nuclear bomb contained within a material containing high concentrations of deuterium and tritium. Weapon yield is typically increased with a tamper that increases the duration and intensity of the reaction through inertial confinement and neutron reflection. Nuclear fusion bombs can have arbitrarily high yields making them hundreds or thousands of times more powerful than nuclear fission.

A pure fusion weapon is a hypothetical nuclear weapon that does not require a primary fission stage to start a fusion reaction.

Antimatter

Antimatter bombs can theoretically be constructed, but antimatter is very costly to produce and hard to store safely.

Other

Delivery

A B-2 Spirit drops forty-seven 500 lb (230 kg) class Mark 82 bombs (little more than half a B-2's maximum total ordnance payload) in a 1994 live fire exercise in California
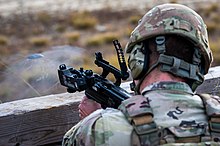
A United States National Guard soldier firing a 40 mm grenade from an M320 grenade launcher
Destruction caused by Soviet bombing during the Continuation War in Helsinki, Finland, the night of February 6–7, 1944

The first air-dropped bombs were used by the Austrians in the 1849 siege of Venice. Two hundred unmanned balloons carried small bombs, although few bombs actually hit the city.

The first bombing from a fixed-wing aircraft took place in 1911 when the Italians dropped bombs by hand on the Turkish lines in what is now Libya, during the Italo-Turkish War. The first large scale dropping of bombs took place during World War I starting in 1915 with the German Zeppelin airship raids on London, England, and the same war saw the invention of the first heavy bombers. One Zeppelin raid on 8 September 1915 dropped 4,000 lb (1,800 kg) of high explosives and incendiary bombs, including one bomb that weighed 600 lb (270 kg).

During World War II bombing became a major military feature, and a number of novel delivery methods were introduced. These included Barnes Wallis's bouncing bomb, designed to bounce across water, avoiding torpedo nets and other underwater defenses, until it reached a dam, ship, or other destination, where it would sink and explode. By the end of the war, planes such as the allied forces' Avro Lancaster were delivering with 50 yd (46 m) accuracy from 20,000 ft (6,100 m), ten ton earthquake bombs (also invented by Barnes Wallis) named "Grand Slam", which, unusually for the time, were delivered from high altitude in order to gain high speed, and would, upon impact, penetrate and explode deep underground ("camouflet"), causing massive caverns or craters, and affecting targets too large or difficult to be affected by other types of bomb.

Modern military bomber aircraft are designed around a large-capacity internal bomb bay, while fighter-bombers usually carry bombs externally on pylons or bomb racks or on multiple ejection racks, which enable mounting several bombs on a single pylon. Some bombs are equipped with a parachute, such as the World War II "parafrag" (an 11 kg (24 lb) fragmentation bomb), the Vietnam War-era daisy cutters, and the bomblets of some modern cluster bombs. Parachutes slow the bomb's descent, giving the dropping aircraft time to get to a safe distance from the explosion. This is especially important with air-burst nuclear weapons (especially those dropped from slower aircraft or with very high yields), and in situations where the aircraft releases a bomb at low altitude. A number of modern bombs are also precision-guided munitions, and may be guided after they leave an aircraft by remote control, or by autonomous guidance.

Aircraft may also deliver bombs in the form of warheads on guided missiles, such as long-range cruise missiles, which can also be launched from warships.

A hand grenade is delivered by being thrown. Grenades can also be projected by other means, such as being launched from the muzzle of a rifle (as in the rifle grenade), using a grenade launcher (such as the M203), or by attaching a rocket to the explosive grenade (as in a rocket-propelled grenade (RPG)).

A bomb may also be positioned in advance and concealed.

A bomb destroying a rail track just before a train arrives will usually cause the train to derail. In addition to the damage to vehicles and people, a bomb exploding in a transport network often damages, and is sometimes mainly intended to damage, the network itself. This applies to railways, bridges, runways, and ports, and, to a lesser extent (depending on circumstances), to roads.

In the case of suicide bombing, the bomb is often carried by the attacker on their body, or in a vehicle driven to the target.

The Blue Peacock nuclear mines, which were also termed "bombs", were planned to be positioned during wartime and be constructed such that, if disturbed, they would explode within ten seconds.

The explosion of a bomb may be triggered by a detonator or a fuse. Detonators are triggered by clocks, remote controls like cell phones or some kind of sensor, such as pressure (altitude), radar, vibration or contact. Detonators vary in ways they work, they can be electrical, fire fuze or blast initiated detonators and others,

Blast seat

In forensic science, the point of detonation of a bomb is referred to as its blast seat, seat of explosion, blast hole or epicenter. Depending on the type, quantity and placement of explosives, the blast seat may be either spread out or concentrated (i.e., an explosion crater).

Other types of explosions, such as dust or vapor explosions, do not cause craters or even have definitive blast seats.

Blood vessel

From Wikipedia, the free encyclopedia
https://en.wikipedia.org/wiki/Blood_vessel

Blood vessel
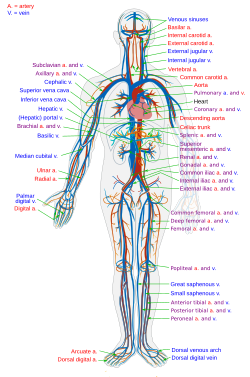
Simple diagram of the human circulatory system

Blood vessels are the components of the circulatory system that transport blood throughout the human body. These vessels transport blood cells, nutrients, and oxygen to the tissues of the body. They also take waste and carbon dioxide away from the tissues. Blood vessels are needed to sustain life, because all of the body's tissues rely on their functionality.

There are five types of blood vessels: the arteries, which carry the blood away from the heart; the arterioles; the capillaries, where the exchange of water and chemicals between the blood and the tissues occurs; the venules; and the veins, which carry blood from the capillaries back towards the heart.

The word vascular, meaning relating to the blood vessels, is derived from the Latin vas, meaning vessel. Some structures – such as cartilage, the epithelium, and the lens and cornea of the eye – do not contain blood vessels and are labeled avascular.

Etymology

  • artery: late Middle English; from Latin arteria, from Greek artēria, probably from airein ("raise")
  • vein: Middle English; from Old French veine, from Latin vena. The earliest senses were "blood vessel" and "small natural underground channel of water".
  • capillary: mid 17th century; from Latin capillaris, from capillus ("hair"), influenced by Old French capillaire.

Structure

The arteries and veins have three layers. The middle layer is thicker in the arteries than it is in the veins:

  • The inner layer, tunica intima, is the thinnest layer. It is a single layer of flat cells (simple squamous epithelium) glued by a polysaccharide intercellular matrix, surrounded by a thin layer of subendothelial connective tissue interlaced with a number of circularly arranged elastic bands called the internal elastic lamina. A thin membrane of elastic fibers in the tunica intima run parallel to the vessel.
  • The middle layer tunica media is the thickest layer in arteries. It consists of circularly arranged elastic fiber, connective tissue, polysaccharide substances, the second and third layer are separated by another thick elastic band called external elastic lamina. The tunica media may (especially in arteries) be rich in vascular smooth muscle, which controls the caliber of the vessel. Veins do not have the external elastic lamina, but only an internal one. The tunica media is thicker in the arteries rather than the veins.
  • The outer layer is the tunica adventitia and the thickest layer in veins. It is entirely made of connective tissue. It also contains nerves that supply the vessel as well as nutrient capillaries (vasa vasorum) in the larger blood vessels.

Capillaries consist of a single layer of endothelial cells with a supporting subendothelium consisting of a basement membrane and connective tissue.

When blood vessels connect to form a region of diffuse vascular supply it is called an anastomosis. Anastomoses provide critical alternative routes for blood to flow in case of blockages.

Leg veins have valves which prevent backflow of the blood being pumped against gravity by the surrounding muscles.

Types

Transmission electron micrograph of a blood vessel displaying an erythrocyte (red blood cell, E) within its lumen, endothelial cells forming its tunica intima (inner layer), and pericytes forming its tunica adventitia (outer layer).

There are various kinds of blood vessels:

They are roughly grouped as "arterial" and "venous", determined by whether the blood in it is flowing away from (arterial) or toward (venous) the heart. The term "arterial blood" is nevertheless used to indicate blood high in oxygen, although the pulmonary artery carries "venous blood" and blood flowing in the pulmonary vein is rich in oxygen. This is because they are carrying the blood to and from the lungs, respectively, to be oxygenated.

Diagram of blood vessel structures

Function

Blood vessels function to transport blood. In general, arteries and arterioles transport oxygenated blood from the lungs to the body and its organs, and veins and venules transport deoxygenated blood from the body to the lungs. Blood vessels also circulate blood throughout the circulatory system Oxygen (bound to hemoglobin in red blood cells) is the most critical nutrient carried by the blood. In all arteries apart from the pulmonary artery, hemoglobin is highly saturated (95–100%) with oxygen. In all veins apart from the pulmonary vein, the saturation of hemoglobin is about 75%. (The values are reversed in the pulmonary circulation.) In addition to carrying oxygen, blood also carries hormones, waste products and nutrients for cells of the body.

Blood vessels do not actively engage in the transport of blood (they have no appreciable peristalsis). Blood is propelled through arteries and arterioles through pressure generated by the heartbeat. Blood vessels also transport red blood cells which contain the oxygen necessary for daily activities. The amount of red blood cells present in your vessels has an effect on your health. Hematocrit tests can be performed to calculate the proportion of red blood cells in your blood. Higher proportions result in conditions such as dehydration or heart disease while lower proportions could lead to anemia and long-term blood loss.

Permeability of the endothelium is pivotal in the release of nutrients to the tissue. It is also increased in inflammation in response to histamine, prostaglandins and interleukins, which leads to most of the symptoms of inflammation (swelling, redness, warmth and pain).

Contraction

Constricted blood vessel.

Arteries—and veins to a degree—can regulate their inner diameter by contraction of the muscular layer. This changes the blood flow to downstream organs, and is determined by the autonomic nervous system. Vasodilation and vasoconstriction are also used antagonistically as methods of thermoregulation.

The size of blood vessels is different for each of them. It ranges from a diameter of about 25 millimeters for the aorta to only 8 micrometers in the capillaries. This comes out to about a 3000-fold range. Vasoconstriction is the constriction of blood vessels (narrowing, becoming smaller in cross-sectional area) by contracting the vascular smooth muscle in the vessel walls. It is regulated by vasoconstrictors (agents that cause vasoconstriction). These include paracrine factors (e.g. prostaglandins), a number of hormones (e.g. vasopressin and angiotensin) and neurotransmitters (e.g. epinephrine) from the nervous system.

Vasodilation is a similar process mediated by antagonistically acting mediators. The most prominent vasodilator is nitric oxide (termed endothelium-derived relaxing factor for this reason).

Flow

The circulatory system uses the channel of blood vessels to deliver blood to all parts of the body. This is a result of the left and right side of the heart working together to allow blood to flow continuously to the lungs and other parts of the body. Oxygen-poor blood enters the right side of the heart through two large veins. Oxygen-rich blood from the lungs enters through the pulmonary veins on the left side of the heart into the aorta and then reaches the rest of the body. The capillaries are responsible for allowing the blood to receive oxygen through tiny air sacs in the lungs. This is also the site where carbon dioxide exits the blood. This all occurs in the lungs where blood is oxygenated.

The blood pressure in blood vessels is traditionally expressed in millimetres of mercury (1 mmHg = 133 Pa). In the arterial system, this is usually around 120 mmHg systolic (high pressure wave due to contraction of the heart) and 80 mmHg diastolic (low pressure wave). In contrast, pressures in the venous system are constant and rarely exceed 10 mmHg.

Vascular resistance occurs where the vessels away from the heart oppose the flow of blood. Resistance is an accumulation of three different factors: blood viscosity, blood vessel length, and vessel radius.

Blood viscosity is the thickness of the blood and its resistance to flow as a result of the different components of the blood. Blood is 92% water by weight and the rest of blood is composed of protein, nutrients, electrolytes, wastes, and dissolved gases. Depending on the health of an individual, the blood viscosity can vary (i.e. anemia causing relatively lower concentrations of protein, high blood pressure an increase in dissolved salts or lipids, etc.).

Vessel length is the total length of the vessel measured as the distance away from the heart. As the total length of the vessel increases, the total resistance as a result of friction will increase.

Vessel radius also affects the total resistance as a result of contact with the vessel wall. As the radius of the wall gets smaller, the proportion of the blood making contact with the wall will increase. The greater amount of contact with the wall will increase the total resistance against the blood flow.

Disease

Blood vessels play a huge role in virtually every medical condition. Cancer, for example, cannot progress unless the tumor causes angiogenesis (formation of new blood vessels) to supply the malignant cells' metabolic demand. Atherosclerosis, the narrowing of the blood vessels due to the buildup of plaque, and the coronary artery disease that often follows can cause heart attacks or cardiac arrest and is the leading cause of death worldwide resulting in 8.9 million deaths or 16% of all deaths.

Blood vessel permeability is increased in inflammation. Damage, due to trauma or spontaneously, may lead to hemorrhage due to mechanical damage to the vessel endothelium. In contrast, occlusion of the blood vessel by atherosclerotic plaque, by an embolised blood clot or a foreign body leads to downstream ischemia (insufficient blood supply) and possibly infarction (necrosis due to lack of blood supply). Vessel occlusion tends to be a positive feedback system; an occluded vessel creates eddies in the normally laminar flow or plug flow blood currents. These eddies create abnormal fluid velocity gradients which push blood elements such as cholesterol or chylomicron bodies to the endothelium. These deposit onto the arterial walls which are already partially occluded and build upon the blockage.

The most common disease of the blood vessels is hypertension or high blood pressure. This is caused by an increase in the pressure of the blood flowing through the vessels. Hypertension can lead to more serious conditions such as heart failure and stroke. To prevent these diseases, the most common treatment option is medication as opposed to surgery. Aspirin helps prevent blood clots and can also help limit inflammation.

Vasculitis is inflammation of the vessel wall, due to autoimmune disease or infection.

Another Blood Vessel Disease is called Broken Blood Vessel. Broken blood vessels, also known as spider veins or telangiectasias, are small, damaged blood vessels that appear as red, purple, or blue lines on the skin's surface. They are most commonly found on the face, legs, and chest. These unsightly blemishes can be caused by various factors, and their appearance may cause concerns about both aesthetics and potential health issues.

Anti-psychiatry

From Wikipedia, the free encyclopedia https://en.wikipedia.org/wiki/Anti-psychiatry ...