| Cardiac cycle | |
|---|---|
MRI video of a teen's heart beating | |
| Organisms | Animalia |
| Biological system | Circulatory system |
| Health | Beneficial |
| Action | Involuntary |
| Method | Blood is allowed to enter relaxed ventricle chamber from vein through venous valve. Heart muscle contracts ventricle and blood is expelled through arterial valve to artery. |
| Outcome | Circulation of blood per minute (Humans) |
| Duration | 0.6–1 second (Humans) |
| *Animalia with the exception of Porifera, Cnidaria, Ctenophora, Platyhelminthes, Bryozoan, Amphioxus. | |


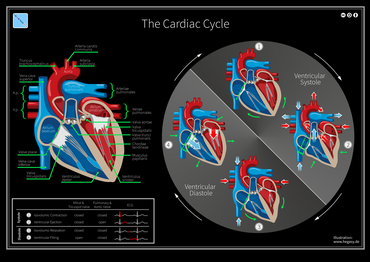
The cardiac cycle is the performance of the human heart from the beginning of one heartbeat to the beginning of the next. It consists of two periods: one during which the heart muscle relaxes and refills with blood, called diastole, following a period of robust contraction and pumping of blood, called systole. After emptying, the heart relaxes and expands to receive another influx of blood returning from the lungs and other systems of the body, before again contracting to pump blood to the lungs and those systems. A normally performing heart must be fully expanded before it can efficiently pump again. Assuming a healthy heart and a typical rate of 70 to 75 beats per minute, each cardiac cycle, or heartbeat, takes about 0.8 second to complete the cycle. There are two atrial and two ventricle chambers of the heart; they are paired as the left heart and the right heart—that is, the left atrium with the left ventricle, the right atrium with the right ventricle—and they work in concert to repeat the cardiac cycle continuously (see cycle diagram at right margin). At the start of the cycle, during ventricular diastole–early, the heart relaxes and expands while receiving blood into both ventricles through both atria; then, near the end of ventricular diastole–late, the two atria begin to contract (atrial systole), and each atrium pumps blood into the ventricle below it. During ventricular systole the ventricles are contracting and vigorously pulsing (or ejecting) two separated blood supplies from the heart—one to the lungs and one to all other body organs and systems—while the two atria are relaxed (atrial diastole). This precise coordination ensures that blood is efficiently collected and circulated throughout the body.
The mitral and tricuspid valves, also known as the atrioventricular, or AV valves, open during ventricular diastole to permit filling. Late in the filling period the atria begin to contract (atrial systole) forcing a final crop of blood into the ventricles under pressure—see cycle diagram. Then, prompted by electrical signals from the sinoatrial node, the ventricles start contracting (ventricular systole), and as back-pressure against them increases the AV valves are forced to close, which stops the blood volumes in the ventricles from flowing in or out; this is known as the isovolumic contraction stage.
Due to the contractions of the systole, pressures in the ventricles rise quickly, exceeding the pressures in the trunks of the aorta and the pulmonary arteries and causing the requisite valves (the aortic and pulmonary valves) to open—which results in separated blood volumes being ejected from the two ventricles. This is the ejection stage of the cardiac cycle; it is depicted (see circular diagram) as the ventricular systole–first phase followed by the ventricular systole–second phase. After ventricular pressures fall below their peak(s) and below those in the trunks of the aorta and pulmonary arteries, the aortic and pulmonary valves close again—see, at the right margin, Wiggers diagram, blue-line tracing.
Now follows the isovolumic relaxation, during which pressure within the ventricles begin to fall significantly, and thereafter the atria begin refilling as blood returns to flow into the right atrium (from the vena cavae) and into the left atrium (from the pulmonary veins). As the ventricles begin to relax, the mitral and tricuspid valves open again, and the completed cycle returns to ventricular diastole and a new "Start" of the cardiac cycle.
Throughout the cardiac cycle, blood pressure increases and decreases. The movements of cardiac muscle are coordinated by a series of electrical impulses produced by specialised pacemaker cells found within the sinoatrial node and the atrioventricular node. Cardiac muscle is composed of myocytes which initiate their internal contractions without applying to external nerves—with the exception of changes in the heart rate due to metabolic demand.
In an electrocardiogram, electrical systole initiates the atrial systole at the P wave deflection of a steady signal; and it starts contractions (systole).
The cardiac cycle and Wiggers diagram

The cardiac cycle involves four major stages of activity: 1) "Isovolumic relaxation", 2) Inflow, 3) "Isovolumic contraction", 4) "Ejection". (See Wiggers diagram, which presents the stages, label-wise, in 3,4,1,2 order, left-to-right.) Moving from the left along the Wiggers diagram shows the activities within four stages during a single cardiac cycle. (See the consecutive panels labeled, at bottom-right, "Diastole" then "Systole").
Stages 1 and 2 together—"Isovolumic relaxation" plus Inflow (equals "Rapid inflow", "Diastasis", and "Atrial systole")—comprise the ventricular "Diastole" period, including atrial systole, during which blood returning to the heart flows through the atria into the relaxed ventricles. Stages 3 and 4 together—"Isovolumic contraction" plus "Ejection"—are the ventricular "Systole" period, which is the simultaneous pumping of separate blood supplies from the two ventricles, one to the pulmonary artery and one to the aorta. Notably, near the end of the "Diastole", the atria begin contracting, then pumping blood into the ventricles; this pressurized delivery during ventricular relaxation (ventricular diastole) is called the atrial systole, aka atrial kick.
The time-wise increases and decreases of the heart's blood volume (see Wiggers diagram), are also instructive to follow. The red-line tracing of "Ventricular volume" provides an excellent track of the two periods and four stages of one cardiac cycle. Starting with the Diastole period: the low-volume plateau of "Isovolumic relaxation" stage, followed by a rapid rise and two slower rises, all components of the "Inflow stage"—increasing to the high-volume plateau of the "Isovolumic contraction" stage; (find the label at left side of diagram). Then, the Systole, including the high "Isovolumic contraction" stage to the rapid decrease in blood volume (i.e., the vertical drop of the red-line tracing) which signifies the emptying of the ventricles during the "Ejection" stage of the completed cycle—all equal to one heartbeat.
Stages
| Stage | AV valves* | Semilunar valves† | Status of ventricles and atria; and blood flow | ||
|---|---|---|---|---|---|
| 1 | Diastole | Isovolumic relaxation | Closed
|
Closed
|
Semilunar (pulmonary and aortic) valves close at end of ejection stage; blood flow stops. |
| 2a | Inflow: (Ventricular filling) | Open
|
Closed
|
Ventricles and atria together relax and expand; blood flows to the heart during ventricular and atrial diastole. | |
| 2b | Inflow: (Ventricular filling with Atrial systole#) | Open
|
Closed
|
Ventricles relaxed and expanded; atrial contraction (systole) forces blood under pressure into ventricles during ventricular diastole–late. | |
| 3 | Systole | Isovolumic contraction | Closed
|
Closed
|
AV valves close at end of ventricular diastole; blood flow stops; ventricles begin to contract. |
| 4 | Ejection: Ventricular ejection | Closed
|
Open
|
Ventricles contract (ventricular systole); blood flows from the heart—to the lungs and to rest of body during ventricular ejection. | |
Notes
Stages 1, 2a, and 2b together comprise the "Diastole" period; stages 3 and 4 together comprise the "Systole" period.
+ Based on Ganong
# Rapid-filling inflow produced by atrial systole during "ventricular diastole–late"
* Atrioventricular (AV) valves= tricuspid valve; mitral valve
† Semilunar valves= pulmonary valve; aortic valve

The closure of the aortic valve causes a rapid change in pressure in the aorta called the incisura. This short sharp change in pressure is rapidly attenuated down the arterial tree. The pulse wave form is also reflected from branches in the arterial tree and gives rise to a dicrotic notch in main arteries. The summation of the reflected pulse wave and the systolic wave may increase pulse pressure and help tissue perfusion. With increasing age, the aorta stiffens and can become less elastic which will reduce peak pulse in the periphery.
Physiology

The heart is a four-chambered organ consisting of right and left halves, called the right heart and the left heart. The upper two chambers, the left and right atria, are entry points into the heart for blood-flow returning from the circulatory system, while the two lower chambers, the left and right ventricles, perform the contractions that eject the blood from the heart to flow through the circulatory system. Circulation is split into pulmonary circulation—during which the right ventricle pumps oxygen-depleted blood to the lungs through the pulmonary trunk and arteries; or the systemic circulation—in which the left ventricle pumps/ejects newly oxygenated blood throughout the body via the aorta and all other arteries.
Heart electrical conduction system
In a healthy heart all activities and rests during each individual cardiac cycle, or heartbeat, are initiated and orchestrated by signals of the heart's electrical conduction system, which is the "wiring" of the heart that carries electrical impulses throughout the body of cardiomyocytes, the specialized muscle cells of the heart. These impulses ultimately stimulate heart muscle to contract and thereby to eject blood from the ventricles into the arteries and the cardiac circulatory system; and they provide a system of intricately timed and persistent signaling that controls the rhythmic beating of the heart muscle cells, especially the complex impulse-generation and muscle contractions in the atrial chambers. The rhythmic sequence (or sinus rhythm) of this signaling across the heart is coordinated by two groups of specialized cells, the sinoatrial (SA) node, which is situated in the upper wall of the right atrium, and the atrioventricular (AV) node located in the lower wall of the right heart between the atrium and ventricle. The sinoatrial node, often known as the cardiac pacemaker, is the point of origin for producing a wave of electrical impulses that stimulates atrial contraction by creating an action potential across myocardium cells.
Impulses of the wave are delayed upon reaching the AV node, which acts as a gate to slow and to coordinate the electrical current before it is conducted below the atria and through the circuits known as the bundle of His and the Purkinje fibers—all which stimulate contractions of both ventricles. The programmed delay at the AV node also provides time for blood volume to flow through the atria and fill the ventricular chambers—just before the return of the systole (contractions), ejecting the new blood volume and completing the cardiac cycle. (See Wiggers diagram: "Ventricular volume" tracing (red), at "Systole" panel.)
Diastole and systole in the cardiac cycle


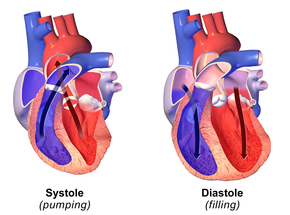
Cardiac diastole is the period of the cardiac cycle when, after contraction, the heart relaxes and expands while refilling with blood returning from the circulatory system. Both atrioventricular (AV) valves open to facilitate the 'unpressurized' flow of blood directly through the atria into both ventricles, where it is collected for the next contraction. This period is best viewed at the middle of the Wiggers diagram—see the panel labeled "Diastole". Here it shows pressure levels in both atria and ventricles as near-zero during most of the diastole. (See gray and light-blue tracings labeled "Atrial pressure" and "Ventricular pressure"—Wiggers diagram.) Here also may be seen the red-line tracing of "Ventricular volume", showing increase in blood volume from the low plateau of the "Isovolumic relaxation" stage to the maximum volume occurring in the "Atrial systole" sub-stage.
Atrial systole
Atrial systole is the contracting of cardiac muscle cells of both atria following electrical stimulation and conduction of electrical currents across the atrial chambers (see above, Physiology). While nominally a component of the heart's sequence of systolic contraction and ejection, atrial systole actually performs the vital role of completing the diastole, which is to finalize the filling of both ventricles with blood while they are relaxed and expanded for that purpose. Atrial systole overlaps the end of the diastole, occurring in the sub-period known as ventricular diastole–late (see cycle diagram). At this point, the atrial systole applies contraction pressure to 'topping-off' the blood volumes sent to both ventricles; this atrial kick closes the diastole immediately before the heart again begins contracting and ejecting blood from the ventricles (ventricular systole) to the aorta and arteries.
Atrial kick is absent or disrupted if there is loss of normal electrical conduction in the heart, such as caused by atrial fibrillation, atrial flutter, or heart block. Atrial kick may also be degraded by any deterioration in the condition of the heart, such as "stiff heart" found in patients with diastolic dysfunction.
Ventricular systole
Ventricular systole is the contractions, following electrical stimulations, of the ventricular syncytium of cardiac muscle cells in the left and right ventricles. Contractions in the right ventricle provide pulmonary circulation by pulsing oxygen-depleted blood through the pulmonary valve then through the pulmonary arteries to the lungs. Simultaneously, contractions of the left ventricular systole provide systemic circulation of oxygenated blood to all body systems by pumping blood through the aortic valve, the aorta, and all the arteries. (Blood pressure is routinely measured in the larger arteries off the left ventricle during the left ventricular systole).


![{\displaystyle p_{c}={\frac {({\sqrt[{3}]{2}}-1)^{7/3}}{3^{1/3}}}R^{1/3}{\frac {a^{2/3}}{b^{5/3}}},\quad T_{c}=3^{2/3}({\sqrt[{3}]{2}}-1)^{4/3}({\frac {a}{bR}})^{2/3},\qquad V_{m,c}={\frac {b}{{\sqrt[{3}]{2}}-1}},\qquad Z_{c}={\frac {1}{3}}}](https://wikimedia.org/api/rest_v1/media/math/render/svg/2049ffdf2acaa75fec73b555bb8da98d3e4f28b0)


![{\displaystyle b'={\sqrt[{3}]{2}}-1\approx 0.26}](https://wikimedia.org/api/rest_v1/media/math/render/svg/578b7130159a520fdd079b4a4857ef08fc6e898f)

![{\displaystyle p={\frac {RT}{V_{\text{m}}}}\left[1+{\frac {9{\frac {p}{p_{\text{c}}}}}{128{\frac {T}{T_{\text{c}}}}}}\left(1-{\frac {6}{\frac {T^{2}}{T_{\text{c}}^{2}}}}\right)\right]}](https://wikimedia.org/api/rest_v1/media/math/render/svg/104eeedf4bd470d77be66a443ce8dee79018befa)


![{\displaystyle pV_{\text{m}}=RT\left[1+{\frac {B(T)}{V_{\text{m}}}}+{\frac {C(T)}{V_{\text{m}}^{2}}}+{\frac {D(T)}{V_{\text{m}}^{3}}}+\ldots \right]}](https://wikimedia.org/api/rest_v1/media/math/render/svg/24872e14ac2166d1a8b69843092b4cd5466163c1)
![{\displaystyle pV_{\text{m}}=RT\left[1+B'(T)p+C'(T)p^{2}+D'(T)p^{3}\ldots \right]}](https://wikimedia.org/api/rest_v1/media/math/render/svg/4210d94e484090005b5c79e62c4d1697b14f79b2)


![{\displaystyle p=RTd+d^{2}\left(RT(B+bd)-\left(A+ad-a\alpha d^{4}\right)-{\frac {1}{T^{2}}}\left[C-cd\left(1+\gamma d^{2}\right)\exp \left(-\gamma d^{2}\right)\right]\right)}](https://wikimedia.org/api/rest_v1/media/math/render/svg/08d43caaf20d4f8946f7449bba37b3849305619e)

