Search This Blog

Sunday, October 22, 2023

Sound barrier

From Wikipedia, the free encyclopedia
https://en.wikipedia.org/wiki/Sound_barrier
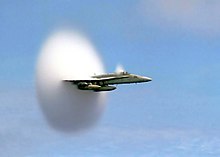
U.S. Navy F/A-18 transonic pushing into the sound barrier. The supersonic white cloud is formed by decreased air pressure and temperature around the tail of the aircraft (see Prandtl–Glauert singularity).
  1. Subsonic
  2. Mach 1
  3. Supersonic
  4. Shock wave

The sound barrier or sonic barrier is the large increase in aerodynamic drag and other undesirable effects experienced by an aircraft or other object when it approaches the speed of sound. When aircraft first approached the speed of sound, these effects were seen as constituting a barrier, making faster speeds very difficult or impossible. The term sound barrier is still sometimes used today to refer to aircraft approaching supersonic flight in this high drag regime. Flying faster than sound produces a sonic boom.

In dry air at 20 °C (68 °F), the speed of sound is 343 metres per second (about 767 mph, 1234 km/h or 1,125 ft/s). The term came into use during World War II when pilots of high-speed fighter aircraft experienced the effects of compressibility, a number of adverse aerodynamic effects that deterred further acceleration, seemingly impeding flight at speeds close to the speed of sound. These difficulties represented a barrier to flying at faster speeds. In 1947, American test pilot Chuck Yeager demonstrated that safe flight at the speed of sound was achievable in purpose-designed aircraft, thereby breaking the barrier. By the 1950s, new designs of fighter aircraft routinely reached the speed of sound, and faster.

History

Some common whips such as the bullwhip or stockwhip are able to move faster than sound: the tip of the whip exceeds this speed and causes a sharp crack—literally a sonic boom. Firearms made after the 19th century generally have a supersonic muzzle velocity.

The sound barrier may have been first breached by living beings about 150 million years ago. Some paleobiologists report that computer models of their biomechanical capabilities suggest that certain long-tailed dinosaurs such as Brontosaurus, Apatosaurus, and Diplodocus could flick their tails at supersonic speeds, creating a cracking sound. This finding is theoretical and disputed by others in the field. Meteorites in the Earth's upper atmosphere usually travel at higher than Earth's escape velocity, which is much faster than sound.

Early problems

The existence of the sound barrier was evident to aerodynamicists before any direct in aircraft evidence was available. In particular, the very simple theory of thin airfoils at supersonic speeds produced a curve that went to infinite drag at Mach 1, dropping with increasing speed. This could be seen in tests using projectiles fired from guns, a common method for checking the stability of various projective shapes. As the projectile slowed from its initial speed and began to approach the speed of sound, it would undergo a rapid increase in drag and slow much more rapidly. It was understood that the drag did not go infinite, or it would be impossible for the projectile to get above Mach 1 in the first place, but there was no better theory and data was matching theory to some degree. At the same time, ever-increasing wind tunnel speeds were showing a similar effect as one approached Mach 1 from below. In this case, however, there was no theoretical development that suggested why this might be. What was noticed was that the increase in drag was not smooth, it had a distinct "corner" where it began to suddenly rise. This speed was different for different wing planforms and cross sections, and became known as the "critical Mach".

According to British aerodynamicist W. F. Hilton, of Armstrong Whitworth Aircraft, the term itself was created accidentally. He was giving demonstrations at the annual show day at the National Physical Laboratory in 1935 where he demonstrated a chart of wind tunnel measurements comparing the drag of a wing to the velocity of the air. During these explanations he would state "See how the resistance of a wing shoots up like a barrier against higher speed, as we approach the speed of sound." The next day, the London newspapers were filled with statements about a "sound barrier." Whether or not this is the first use of the term is debatable, but by the 1940s use within the industry was already common.

By the late 1930s, one practical outcome of this was becoming clear. Although aircraft were still operating well below Mach 1, generally half that at best, their engines were rapidly pushing past 1,000 hp. At these power levels, the traditional two-bladed propellers were clearly showing rapid increases in drag. The tip speed of a propeller blade is a function of the rotational speed and the length of the blade. As the engine power increased, longer blades were needed to apply this power to the air while operating at the most efficient RPM of the engine. The velocity of the air is also a function of the forward speed of the aircraft. When the aircraft speed is high enough, the tips reach transonic speeds. Shock waves form at the blade tips and sap the shaft power driving the propeller. To maintain thrust, the engine power must replace this loss, and must also match the aircraft drag as it increases with speed. The required power is so great that the size and weight of the engine becomes prohibitive. This speed limitation led to research into jet engines, notably by Frank Whittle in England and Hans von Ohain in Germany. This also led to propellers with ever-increasing numbers of blades, three, four and then five were seen during the war. As the problem became better understood, it also led to "paddle bladed" propellers with increased chord, as seen (for example) on late-war models of the Republic P-47 Thunderbolt.

Nevertheless, propeller aircraft were able to approach their critical Mach number, different for each aircraft, in a dive. Doing so led to numerous crashes for a variety of reasons. Flying the Mitsubishi Zero, pilots sometimes flew at full power into terrain because the rapidly increasing forces acting on the control surfaces of their aircraft overpowered them. In this case, several attempts to fix it only made the problem worse. Likewise, the flexing caused by the low torsional stiffness of the Supermarine Spitfire's wings caused them, in turn, to counteract aileron control inputs, leading to a condition known as control reversal. This was solved in later models with changes to the wing. Worse still, a particularly dangerous interaction of the airflow between the wings and tail surfaces of diving Lockheed P-38 Lightnings made "pulling out" of dives difficult; in one 1941 test flight test pilot Ralph Virde was killed when the plane flew into the ground at high speed. The problem was later solved by the addition of a "dive flap" that upset the airflow under these circumstances. Flutter due to the formation of shock waves on curved surfaces was another major problem, which led most famously to the breakup of a de Havilland Swallow and death of its pilot Geoffrey de Havilland, Jr. on 27 September 1946. A similar problem is thought to have been the cause of the 1943 crash of the BI-1 rocket aircraft in the Soviet Union.

All of these effects, although unrelated in most ways, led to the concept of a "barrier" making it difficult for an aircraft to exceed the speed of sound. Erroneous news reports caused most people to envision the sound barrier as a physical "wall", which supersonic aircraft needed to "break" with a sharp needle nose on the front of the fuselage. Rocketry and artillery experts' products routinely exceeded Mach 1, but aircraft designers and aerodynamicists during and after World War II discussed Mach 0.7 as a limit dangerous to exceed.

Early claims

During WWII and immediately thereafter, a number of claims were made that the sound barrier had been broken in a dive. The majority of these purported events can be dismissed as instrumentation errors. The typical airspeed indicator (ASI) uses air pressure differences between two or more points on the aircraft, typically near the nose and at the side of the fuselage, to produce a speed figure. At high speed, the various compression effects that lead to the sound barrier also cause the ASI to go non-linear and produce inaccurately high or low readings, depending on the specifics of the installation. This effect became known as "Mach jump". Before the introduction of Mach meters, accurate measurements of supersonic speeds could only be made remotely, normally using ground-based instruments. Many claims of supersonic speeds were found to be far below this speed when measured in this fashion.

In 1942, Republic Aviation issued a press release stating that Lts. Harold E. Comstock and Roger Dyar had exceeded the speed of sound during test dives in a Republic P-47 Thunderbolt. It is widely agreed that this was due to inaccurate ASI readings. In similar tests, the North American P-51 Mustang demonstrated limits at Mach 0.85, with every flight over Mach 0.84 causing the aircraft to be damaged by vibration.
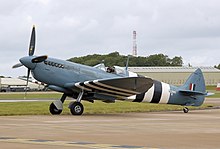
A Spitfire PR Mk XI (PL965) of the type used in the 1944 RAE Farnborough dive tests during which a highest Mach number of 0.92 was obtained

One of the highest recorded instrumented Mach numbers attained for a propeller aircraft is the Mach 0.891 for a Spitfire PR XI, flown during dive tests at the Royal Aircraft Establishment, Farnborough in April 1944. The Spitfire, a photo-reconnaissance variant, the Mark XI, fitted with an extended "rake type" multiple pitot system, was flown by Squadron Leader J. R. Tobin to this speed, corresponding to a corrected true airspeed (TAS) of 606 mph. In a subsequent flight, Squadron Leader Anthony Martindale achieved Mach 0.92, but it ended in a forced landing after over-revving damaged the engine.

Hans Guido Mutke claimed to have broken the sound barrier on 9 April 1945 in the Messerschmitt Me 262 jet aircraft. He states that his ASI pegged itself at 1,100 kilometres per hour (680 mph). Mutke reported not just transonic buffeting, but the resumption of normal control once a certain speed was exceeded, then a resumption of severe buffeting once the Me 262 slowed again. He also reported engine flame-out.

This claim is widely disputed, even by pilots in his unit. All of the effects he reported are known to occur on the Me 262 at much lower speeds, and the ASI reading is simply not reliable in the transonic. Further, a series of tests made by Karl Doetsch at the behest of Willy Messerschmitt found that the plane became uncontrollable above Mach 0.86, and at Mach 0.9 would nose over into a dive that could not be recovered from. Post-war tests by the RAF confirmed these results, with the slight modification that the maximum speed using new instruments was found to be Mach 0.84, rather than Mach 0.86.

In 1999, Mutke enlisted the help of Professor Otto Wagner of the Munich Technical University to run computational tests to determine whether the aircraft could break the sound barrier. These tests do not rule out the possibility, but are lacking accurate data on the coefficient of drag that would be needed to make accurate simulations. Wagner stated: "I don't want to exclude the possibility, but I can imagine he may also have been just below the speed of sound and felt the buffeting, but did not go above Mach-1."

One bit of evidence presented by Mutke is on page 13 of the "Me 262 A-1 Pilot's Handbook" issued by Headquarters Air Materiel Command, Wright Field, Dayton, Ohio as Report No. F-SU-1111-ND on January 10, 1946:

Speeds of 950 km/h (590 mph) are reported to have been attained in a shallow dive 20° to 30° from the horizontal. No vertical dives were made. At speeds of 950 to 1,000 km/h (590 to 620 mph) the air flow around the aircraft reaches the speed of sound, and it is reported that the control surfaces no longer affect the direction of flight. The results vary with different airplanes: some wing over and dive while others dive gradually. It is also reported that once the speed of sound is exceeded, this condition disappears and normal control is restored.

The comments about restoration of flight control and cessation of buffeting above Mach 1 are very significant in a 1946 document. However, it is not clear where these terms came from, as it does not appear the US pilots carried out such tests.

In his 1990 book Me-163, former Messerschmitt Me 163 "Komet" pilot Mano Ziegler claims that his friend, test pilot Heini Dittmar, broke the sound barrier while diving the rocket plane, and that several people on the ground heard the sonic booms. He claims that on 6 July 1944, Dittmar, flying Me 163B V18, bearing the Stammkennzeichen alphabetic code VA+SP, was measured traveling at a speed of 1,130 km/h (702 mph). However, no evidence of such a flight exists in any of the materials from that period, which were captured by Allied forces and extensively studied. Dittmar had been officially recorded at 1,004.5 km/h (623.8 mph) in level flight on 2 October 1941 in the prototype Me 163A V4. He reached this speed at less than full throttle, as he was concerned by the transonic buffeting. Dittmar himself does not make a claim that he broke the sound barrier on that flight and notes that the speed was recorded only on the AIS. He does, however, take credit for being the first pilot to "knock on the sound barrier".

There are a number of unmanned vehicles that flew at supersonic speeds during this period. In 1933, Soviet designers working on ramjet concepts fired phosphorus-powered engines out of artillery guns to get them to operational speeds. It is possible that this produced supersonic performance as high as Mach 2, but this was not due solely to the engine itself. In contrast, the German V-2 ballistic missile routinely broke the sound barrier in flight, for the first time on 3 October 1942. By September 1944, V-2s routinely achieved Mach 4 (1,200 m/s, or 3044 mph) during terminal descent.

Breaking the sound barrier

The prototype Miles M.52 turbojet powered aircraft, designed to achieve supersonic level flight

In 1942, the United Kingdom's Ministry of Aviation began a top-secret project with Miles Aircraft to develop the world's first aircraft capable of breaking the sound barrier. The project resulted in the development of the prototype Miles M.52 turbojet-powered aircraft, which was designed to reach 1,000 mph (417 m/s; 1,600 km/h) (over twice the existing speed record) in level flight, and to climb to an altitude of 36,000 ft (11 km) in 1 minute 30 seconds.

A huge number of advanced features were incorporated into the resulting M.52 design, many of which hint at a detailed knowledge of supersonic aerodynamics. In particular, the design featured a conical nose and sharp wing leading edges, as it was known that round-nosed projectiles could not be stabilised at supersonic speeds. The design used very thin wings of biconvex section proposed by Jakob Ackeret for low drag. The wing tips were "clipped" to keep them clear of the conical shock wave generated by the nose of the aircraft. The fuselage had the minimum cross-section allowable around the centrifugal engine with fuel tanks in a saddle over the top.

One of the Vickers models undergoing supersonic wind-tunnel testing at the Royal Aircraft Establishment (RAE) around 1946

Another critical addition was the use of a power-operated stabilator, also known as the all-moving tail or flying tail, a key to supersonic flight control, which contrasted with traditional hinged tailplanes (horizontal stabilizers) connected mechanically to the pilots control column. Conventional control surfaces became ineffective at the high subsonic speeds then being achieved by fighters in dives, due to the aerodynamic forces caused by the formation of shockwaves at the hinge and the rearward movement of the centre of pressure, which together could override the control forces that could be applied mechanically by the pilot, hindering recovery from the dive. A major impediment to early transonic flight was control reversal, the phenomenon which caused flight inputs (stick, rudder) to switch direction at high speed; it was the cause of many accidents and near-accidents. An all-flying tail is considered to be a minimum condition of enabling aircraft to break the transonic barrier safely, without losing pilot control. The Miles M.52 was the first instance of this solution, which has since been universally applied.

Initially, the aircraft was to use Frank Whittle's latest engine, the Power Jets W.2/700, which would only reach supersonic speed in a shallow dive. To develop a fully supersonic version of the aircraft, an innovation incorporated was a reheat jetpipe – also known as an afterburner. Extra fuel was to be burned in the tailpipe to avoid overheating the turbine blades, making use of unused oxygen in the exhaust. Finally, the design included another critical element – the use of a shock cone in the nose to slow the incoming air to the subsonic speeds needed by the engine.

Although the project was eventually cancelled, the research was used to construct an unmanned 30% scale model of the M.52 that went on to achieve a speed of Mach 1.38 in a successful, controlled transonic and supersonic level test flight in October 1948; this was a unique achievement at that time, which validated the aerodynamics of the M.52.

Meanwhile, test pilots achieved high velocities in the tailless, swept-wing de Havilland DH 108. One of them was Geoffrey de Havilland, Jr., who was killed on 27 September 1946 when his DH 108 broke up at about Mach 0.9. John Derry has been called "Britain's first supersonic pilot" because of a dive he made in a DH 108 on 6 September 1948.

The first aircraft to officially break the sound barrier

The British Air Ministry signed an agreement with the United States to exchange all its high-speed research, data and designs and Bell Aircraft company was given access to the drawings and research on the M.52, but the U.S. reneged on the agreement, and no data was forthcoming in return. Bell's supersonic design was still using a conventional tail, and they were battling the problem of control.

Chuck Yeager in front of the Bell X-1, the first aircraft to break the sound barrier in level flight

They utilized the information to initiate work on the Bell X-1. The final version of the Bell X-1 was very similar in design to the original Miles M.52 version. Also featuring the all-moving tail, the XS-1 was later known as the X-1. It was in the X-1 that Chuck Yeager was credited with being the first person to break the sound barrier in level flight on 14 October 1947, flying at an altitude of 45,000 ft (13.7 km). George Welch made a plausible but officially unverified claim to have broken the sound barrier on 1 October 1947, while flying an XP-86 Sabre. He also claimed to have repeated his supersonic flight on 14 October 1947, 30 minutes before Yeager broke the sound barrier in the Bell X-1. Although evidence from witnesses and instruments strongly imply that Welch achieved supersonic speed, the flights were not properly monitored and are not officially recognized. The XP-86 officially achieved supersonic speed on 26 April 1948.

On 14 October 1947, just under a month after the United States Air Force had been created as a separate service, the tests culminated in the first manned supersonic flight, piloted by Air Force Captain Charles "Chuck" Yeager in aircraft #46-062, which he had christened Glamorous Glennis. The rocket-powered aircraft was launched from the bomb bay of a specially modified B-29 and glided to a landing on a runway. XS-1 flight number 50 is the first one where the X-1 recorded supersonic flight, with a maximum speed of Mach 1.06 (361 m/s, 1,299 km/h, 807.2 mph).

As a result of the X-1's initial supersonic flight, the National Aeronautics Association voted its 1947 Collier Trophy to be shared by the three main participants in the program. Honored at the White House by President Harry S. Truman were Larry Bell for Bell Aircraft, Captain Yeager for piloting the flights, and John Stack for the NACA contributions.

Jackie Cochran was the first woman to break the sound barrier, which she did on 18 May 1953, piloting a plane borrowed from the Royal Canadian Air Force, with Yeager accompanying her.

On December 3, 1957, Margaret Chase Smith became the first woman in Congress to break the sound barrier, which she did as a passenger in an F-100 Super Sabre piloted by Air Force Major Clyde Good.

In the late 1950s, Allen Rowley, a British journalist, was able to fly in a Super Sabre at 1000 mph one of the few non-American civilians to exceed the speed of sound and one of the few civilians anywhere to make such a trip.

On 21 August 1961, a Douglas DC-8-43 (registration N9604Z) unofficially exceeded Mach 1 in a controlled dive during a test flight at Edwards Air Force Base, as observed and reported by the flight crew; the crew were William Magruder (pilot), Paul Patten (co-pilot), Joseph Tomich (flight engineer), and Richard H. Edwards (flight test engineer). This was the first supersonic flight by a civilian airliner, achieved before the Concorde or the Tu-144 flew.

The sound barrier understood

As the science of high-speed flight became more widely understood, a number of changes led to the eventual understanding that the "sound barrier" is easily penetrated, with the right conditions. Among these changes were the introduction of thin swept wings, the area rule, and engines of ever-increasing performance. By the 1950s, many combat aircraft could routinely break the sound barrier in level flight, although they often suffered from control problems when doing so, such as Mach tuck. Modern aircraft can transit the "barrier" without control problems.

By the late 1950s, the issue was so well understood that many companies started investing in the development of supersonic airliners, or SSTs, believing that to be the next "natural" step in airliner evolution. However, this has not yet happened. Although the Concorde and the Tupolev Tu-144 entered service in the 1970s, both were later retired without being replaced by similar designs. The last flight of a Concorde in service was in 2003.

Although Concorde and the Tu-144 were the first aircraft to carry commercial passengers at supersonic speeds, they were not the first or only commercial airliners to break the sound barrier. On 21 August 1961, a Douglas DC-8 broke the sound barrier at Mach 1.012, or 1,240 km/h (776.2 mph), while in a controlled dive through 41,088 feet (12,510 m). The purpose of the flight was to collect data on a new design of leading edge for the wing.

Breaking the sound barrier in a land vehicle

On 12 January 1948, a Northrop unmanned rocket sled became the first land vehicle to break the sound barrier. At a military test facility at Muroc Air Force Base (now Edwards AFB), California, it reached a peak speed of 1,019 mph (1,640 km/h) before jumping the rails.

On 15 October 1997, in a vehicle designed and built by a team led by Richard Noble, Royal Air Force pilot Andy Green became the first person to break the sound barrier in a land vehicle in compliance with Fédération Internationale de l'Automobile rules. The vehicle, called the ThrustSSC ("Super Sonic Car"), captured the record 50 years and one day after Yeager's first supersonic flight.

Breaking the sound barrier as a human projectile

Felix Baumgartner

In October 2012 Felix Baumgartner, with a team of scientists and sponsor Red Bull, attempted the highest sky-dive on record. The project would see Baumgartner attempt to jump 120,000 ft (36,580 m) from a helium balloon and become the first parachutist to break the sound barrier. The launch was scheduled for 9 October 2012, but was aborted due to adverse weather; subsequently the capsule was launched instead on 14 October. Baumgartner's feat also marked the 65th anniversary of U.S. test pilot Chuck Yeager's successful attempt to break the sound barrier in an aircraft.

Baumgartner landed in eastern New Mexico after jumping from a world record 128,100 feet (39,045 m), or 24.26 miles, and broke the sound barrier as he traveled at speeds up to 833.9 mph (1342 km/h, or Mach 1.26). In the press conference after his jump, it was announced that he was in freefall for 4 minutes 18 seconds, the second longest freefall after the 1960 jump of Joseph Kittinger for 4 minutes 36 seconds.

Alan Eustace

In October 2014, Alan Eustace, a senior vice president at Google, broke Baumgartner's record for highest sky-dive and also broke the sound barrier in the process. However, because Eustace's jump involved a drogue parachute, while Baumgartner's did not, their vertical speed and free-fall distance records remain in different categories.

Legacy

David Lean directed The Sound Barrier, a fictionalized retelling of the de Havilland DH 108 test flights.

Hypersonic speed

From Wikipedia, the free encyclopedia
https://en.wikipedia.org/wiki/Hypersonic_speed

CFD image of the NASA X-43A at Mach 7

In aerodynamics, a hypersonic speed is one that exceeds five times the speed of sound, often stated as starting at speeds of Mach 5 and above.

The precise Mach number at which a craft can be said to be flying at hypersonic speed varies, since individual physical changes in the airflow (like molecular dissociation and ionization) occur at different speeds; these effects collectively become important around Mach 5-10. The hypersonic regime can also be alternatively defined as speeds where specific heat capacity changes with the temperature of the flow as kinetic energy of the moving object is converted into heat.

Characteristics of flow

Simulation of hypersonic speed (Mach 5)

While the definition of hypersonic flow can be quite vague and is generally debatable (especially due to the absence of discontinuity between supersonic and hypersonic flows), a hypersonic flow may be characterized by certain physical phenomena that can no longer be analytically discounted as in supersonic flow. The peculiarities in hypersonic flows are as follows:

  1. Shock layer
  2. Aerodynamic heating
  3. Entropy layer
  4. Real gas effects
  5. Low density effects
  6. Independence of aerodynamic coefficients with Mach number.

Small shock stand-off distance

As a body's Mach number increases, the density behind a bow shock generated by the body also increases, which corresponds to a decrease in volume behind the shock due to conservation of mass. Consequently, the distance between the bow shock and the body decreases at higher Mach numbers.

Entropy layer

As Mach numbers increase, the entropy change across the shock also increases, which results in a strong entropy gradient and highly vortical flow that mixes with the boundary layer.

Viscous interaction

A portion of the large kinetic energy associated with flow at high Mach numbers transforms into internal energy in the fluid due to viscous effects. The increase in internal energy is realized as an increase in temperature. Since the pressure gradient normal to the flow within a boundary layer is approximately zero for low to moderate hypersonic Mach numbers, the increase of temperature through the boundary layer coincides with a decrease in density. This causes the bottom of the boundary layer to expand, so that the boundary layer over the body grows thicker and can often merge with the shock wave near the body leading edge.

High-temperature flow

High temperatures due to a manifestation of viscous dissipation cause non-equilibrium chemical flow properties such as vibrational excitation and dissociation and ionization of molecules resulting in convective and radiative heat-flux.

Classification of Mach regimes

Although "subsonic" and "supersonic" usually refer to speeds below and above the local speed of sound respectively, aerodynamicists often use these terms to refer to particular ranges of Mach values. This occurs because a "transonic regime" exists around M=1 where approximations of the Navier–Stokes equations used for subsonic design no longer apply, partly because the flow locally exceeds M=1 even when the freestream. Mach number is below this value.

The "supersonic regime" usually refers to the set of Mach numbers for which linearised theory may be used; for example, where the (air) flow is not chemically reacting and where heat transfer between air and vehicle may be reasonably neglected in calculations. Generally, NASA defines "high" hypersonic as any Mach number from 10 to 25, and re-entry speeds as anything greater than Mach 25. Among the spacecraft operating in these regimes are returning Soyuz and Dragon space capsules; the previously-operated Space Shuttle; various reusable spacecraft in development such as SpaceX Starship and Rocket Lab Electron; as well as (theoretical) spaceplanes.

In the following table, the "regimes" or "ranges of Mach values" are referenced instead of the usual meanings of "subsonic" and "supersonic".

Regime Mach No Speed General aircraft characteristics
Subsonic [0–0.8) <614 mph (988 km/h; 274 m/s) Most often propeller-driven and commercial turbofan aircraft with high aspect-ratio (slender) wings, and rounded features like the nose and leading edges.
Transonic [0.8–1.2) 614–921 mph (988–1,482 km/h; 274–412 m/s) Transonic aircraft nearly always have swept wings that delay drag-divergence, supercritical wings to delay the onset of wave drag, and often feature designs adhering to the principles of the Whitcomb area rule.
Supersonic [1.2–5) 921–3,836 mph (1,482–6,173 km/h; 412–1,715 m/s) Aircraft designed to fly at supersonic speeds show large differences in their aerodynamic design because of the radical differences in the behaviour of fluid flows above Mach 1. Sharp edges, thin airfoil-sections, and all-moving tailplane/canards are common. Modern combat aircraft must compromise in order to maintain low-speed handling. "True" supersonic designs include the F-104 Starfighter and BAC/Aérospatiale Concorde.
Hypersonic [5–10) 3,836–7,673 mph (6,173–12,348 km/h; 1,715–3,430 m/s) Cooled nickel or titanium skin; the design is highly integrated, instead of assembled from separate independently-designed components, due to the domination of interference effects, where small changes in any one component will cause large changes in air flow around all other components, which in turn affects their behavior. The result is that no one component can be designed without knowing how all other components will affect all of the air flows around the craft, and any changes to any one component may require a redesign of all other components simultaneously; small wings. See Boeing X-51 Waverider, BrahMos-II, X-41 Common Aero Vehicle, DF-ZF, Hypersonic Technology Demonstrator Vehicle, Hypersonic Air-breathing Weapon Concept (HAWC, pronounced Hawk), Shaurya missile.
High-Hypersonic [10–25) 7,673–19,180 mph (12,348–30,867 km/h; 3,430–8,574 m/s) Thermal control becomes a dominant design consideration. Structure must either be designed to operate hot, or be protected by special silicate tiles or similar. Chemically reacting flow can also cause corrosion of the vehicle's skin, with free-atomic oxygen featuring in very high-speed flows. Examples include the 53T6 (Mach 17), Hypersonic Technology Vehicle 2 (Mach 20), LGM-30 Minuteman (Mach 23), Agni-V (Mach 24), DF-41 (Mach 25), and Avangard (Mach 20-27). Hypersonic designs are often forced into blunt configurations because of the aerodynamic heating rising with a reduced radius of curvature.
Re-entry speeds >=25 >=19,180 mph (30,870 km/h; 8,570 m/s) Ablative or thermal soak heat shield; small or no wings; blunt shape. See reentry capsule.

Similarity parameters

The categorization of airflow relies on a number of similarity parameters, which allow the simplification of a nearly infinite number of test cases into groups of similarity. For transonic and compressible flow, the Mach and Reynolds numbers alone allow good categorization of many flow cases.

Hypersonic flows, however, require other similarity parameters. First, the analytic equations for the oblique shock angle become nearly independent of Mach number at high (~>10) Mach numbers. Second, the formation of strong shocks around aerodynamic bodies means that the freestream Reynolds number is less useful as an estimate of the behavior of the boundary layer over a body (although it is still important). Finally, the increased temperature of hypersonic flow mean that real gas effects become important. Research in hypersonics is therefore often called aerothermodynamics, rather than aerodynamics.

The introduction of real gas effects means that more variables are required to describe the full state of a gas. Whereas a stationary gas can be described by three variables (pressure, temperature, adiabatic index), and a moving gas by four (flow velocity), a hot gas in chemical equilibrium also requires state equations for the chemical components of the gas, and a gas in nonequilibrium solves those state equations using time as an extra variable. This means that for nonequilibrium flow, something between 10 and 100 variables may be required to describe the state of the gas at any given time. Additionally, rarefied hypersonic flows (usually defined as those with a Knudsen number above 0.1) do not follow the Navier–Stokes equations.

Hypersonic flows are typically categorized by their total energy, expressed as total enthalpy (MJ/kg), total pressure (kPa-MPa), stagnation pressure (kPa-MPa), stagnation temperature (K), or flow velocity (km/s).

Wallace D. Hayes developed a similarity parameter, similar to the Whitcomb area rule, which allowed similar configurations to be compared.

Regimes

Hypersonic flow can be approximately separated into a number of regimes. The selection of these regimes is rough, due to the blurring of the boundaries where a particular effect can be found.

Perfect gas

In this regime, the gas can be regarded as an ideal gas. Flow in this regime is still Mach number dependent. Simulations start to depend on the use of a constant-temperature wall, rather than the adiabatic wall typically used at lower speeds. The lower border of this region is around Mach 5, where ramjets become inefficient, and the upper border around Mach 10-12.

Two-temperature ideal gas

This is a subset of the perfect gas regime, where the gas can be considered chemically perfect, but the rotational and vibrational temperatures of the gas must be considered separately, leading to two temperature models. See particularly the modeling of supersonic nozzles, where vibrational freezing becomes important.

Dissociated gas

In this regime, diatomic or polyatomic gases (the gases found in most atmospheres) begin to dissociate as they come into contact with the bow shock generated by the body. Surface catalysis plays a role in the calculation of surface heating, meaning that the type of surface material also has an effect on the flow. The lower border of this regime is where any component of a gas mixture first begins to dissociate in the stagnation point of a flow (which for nitrogen is around 2000 K). At the upper border of this regime, the effects of ionization start to have an effect on the flow.

Ionized gas

In this regime the ionized electron population of the stagnated flow becomes significant, and the electrons must be modeled separately. Often the electron temperature is handled separately from the temperature of the remaining gas components. This region occurs for freestream flow velocities around 3-4 km/s. Gases in this region are modeled as non-radiating plasmas.

Radiation-dominated regime

Above around 12 km/s, the heat transfer to a vehicle changes from being conductively dominated to radiatively dominated. The modeling of gases in this regime is split into two classes:

  1. Optically thin: where the gas does not re-absorb radiation emitted from other parts of the gas
  2. Optically thick: where the radiation must be considered a separate source of energy.

The modeling of optically thick gases is extremely difficult, since, due to the calculation of the radiation at each point, the computation load theoretically expands exponentially as the number of points considered increases.

Solar-cell efficiency

From Wikipedia, the free encyclopedia
Reported timeline of research solar cell energy conversion efficiencies since 1976 (National Renewable Energy Laboratory)

Solar-cell efficiency refers to the portion of energy in the form of sunlight that can be converted via photovoltaics into electricity by the solar cell.

The efficiency of the solar cells used in a photovoltaic system, in combination with latitude and climate, determines the annual energy output of the system. For example, a solar panel with 20% efficiency and an area of 1 m2 will produce 200 kWh/yr at Standard Test Conditions if exposed to the Standard Test Condition solar irradiance value of 1000 W/m2 for 2.74 hours a day. Usually solar panels are exposed to sunlight for longer than this in a given day, but the solar irradiance is less than 1000 W/m2 for most of the day. A solar panel can produce more when the sun is high in the sky and will produce less in cloudy conditions or when the sun is low in the sky, usually the sun is lower in the sky in the winter.

Two location dependant factors that affect solar PV efficiency are the dispersion and intensity of solar radiation. These two variables can vary greatly between each country. The global regions that have high radiation levels throughout the year are the middle east, Northern Chile, Australia, China, and Southwestern USA. In a high-yield solar area like central Colorado, which receives annual insolation of 2000 kWh/m2/year, a panel can be expected to produce 400 kWh of energy per year. However, in Michigan, which receives only 1400 kWh/m2/year, annual energy yield will drop to 280 kWh for the same panel. At more northerly European latitudes, yields are significantly lower: 175 kWh annual energy yield in southern England under the same conditions.

Schematic of charge collection by solar cells. Light transmits through transparent conducting electrode creating electron hole pairs, which are collected by both the electrodes. The absorption and collection efficiencies of a solar cell depend on the design of transparent conductors and active layer thickness.

Several factors affect a cell's conversion efficiency, including its reflectance, thermodynamic efficiency, charge carrier separation efficiency, charge carrier collection efficiency and conduction efficiency values. Because these parameters can be difficult to measure directly, other parameters are measured instead, including quantum efficiency, open-circuit voltage (VOC) ratio, and § Fill factor. Reflectance losses are accounted for by the quantum efficiency value, as they affect "external quantum efficiency". Recombination losses are accounted for by the quantum efficiency, VOC ratio, and fill factor values. Resistive losses are predominantly accounted for by the fill factor value, but also contribute to the quantum efficiency and VOC ratio values.

As of 2022, the world record for solar cell efficiency is 47.1%, set in 2019 by multi-junction concentrator solar cells developed at National Renewable Energy Laboratory (NREL), Golden, Colorado, USA. This record was set in lab conditions, under extremely concentrated light. The record in real-world conditions is also held by NREL, who developed triple junction cells with a tested efficiency of 39.5%.

Factors affecting energy conversion efficiency

The factors affecting energy conversion efficiency were expounded in a landmark paper by William Shockley and Hans Queisser in 1961. See Shockley–Queisser limit for more detail.

Thermodynamic-efficiency limit and infinite-stack limit

The Shockley–Queisser limit for the efficiency of a single-junction solar cell under unconcentrated sunlight at 273 K. This calculated curve uses actual solar spectrum data, and therefore the curve is wiggly from IR absorption bands in the atmosphere. This efficiency limit of ~34% can be exceeded by multijunction solar cells.

If one has a source of heat at temperature Ts and cooler heat sink at temperature Tc, the maximum theoretically possible value for the ratio of work (or electric power) obtained to heat supplied is 1-Tc/Ts, given by a Carnot heat engine. If we take 6000 K for the temperature of the sun and 300 K for ambient conditions on earth, this comes to 95%. In 1981, Alexis de Vos and Herman Pauwels showed that this is achievable with a stack of an infinite number of cells with band gaps ranging from infinity (the first cells encountered by the incoming photons) to zero, with a voltage in each cell very close to the open-circuit voltage, equal to 95% of the band gap of that cell, and with 6000 K blackbody radiation coming from all directions. However, the 95% efficiency thereby achieved means that the electric power is 95% of the net amount of light absorbed – the stack emits radiation as it has non-zero temperature, and this radiation has to be subtracted from the incoming radiation when calculating the amount of heat being transferred and the efficiency. They also considered the more relevant problem of maximizing the power output for a stack being illuminated from all directions by 6000 K blackbody radiation. In this case, the voltages must be lowered to less than 95% of the band gap (the percentage is not constant over all the cells). The maximum theoretical efficiency calculated is 86.8% for a stack of an infinite number of cells, using the incoming concentrated sunlight radiation. When the incoming radiation comes only from an area of the sky the size of the sun, the efficiency limit drops to 68.7%.

Ultimate efficiency

Normal photovoltaic systems however have only one p–n junction and are therefore subject to a lower efficiency limit, called the "ultimate efficiency" by Shockley and Queisser. Photons with an energy below the band gap of the absorber material cannot generate an electron-hole pair, so their energy is not converted to useful output, and only generates heat if absorbed. For photons with an energy above the band gap energy, only a fraction of the energy above the band gap can be converted to useful output. When a photon of greater energy is absorbed, the excess energy above the band gap is converted to kinetic energy of the carrier combination. The excess kinetic energy is converted to heat through phonon interactions as the kinetic energy of the carriers slows to equilibrium velocity. Traditional single-junction cells with an optimal band gap for the solar spectrum have a maximum theoretical efficiency of 33.16%, the Shockley–Queisser limit .

Solar cells with multiple band gap absorber materials improve efficiency by dividing the solar spectrum into smaller bins where the thermodynamic efficiency limit is higher for each bin.

Quantum efficiency

As described above, when a photon is absorbed by a solar cell it can produce an electron-hole pair. One of the carriers may reach the p–n junction and contribute to the current produced by the solar cell; such a carrier is said to be collected. Or, the carriers recombine with no net contribution to cell current.

Quantum efficiency refers to the percentage of photons that are converted to electric current (i.e., collected carriers) when the cell is operated under short circuit conditions. There are two types of quantum that are usually referred to when talking about solar cells. The external quantum efficiency, that relates to the external measurable properties of the solar cell. The "external" quantum efficiency of a silicon solar cell includes the effect of optical losses such as transmission and reflection. In particular, some measures can be taken to reduce these losses. The reflection losses, which can account for up to 10% of the total incident energy, can be dramatically decreased using a technique called texturization, a light trapping method that modifies the average light path.

The second type is the internal quantum efficiency, this measurement of the internal quantum efficiency gives a deeper insight of the internal material parameters like the absorption coefficient or internal luminescence quantum efficiency. The internal quantum efficiency is mainly used when it comes to the understanding of the potential of a certain material rather than a device.

Quantum efficiency is most usefully expressed as a spectral measurement (that is, as a function of photon wavelength or energy). Since some wavelengths are absorbed more effectively than others, spectral measurements of quantum efficiency can yield valuable information about the quality of the semiconductor bulk and surfaces. However, the quantum efficiency alone is not the same as overall energy conversion efficiency, as it does not convey information about the fraction of power that is converted by the solar cell.

Maximum power point

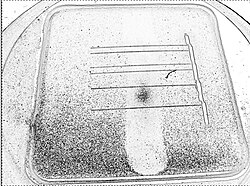
Dust often accumulates on the glass of solar modules - highlighted in this negative image as black dots - which reduces the amount of light admitted to the solar cells

A solar cell may operate over a wide range of voltages (V) and currents (I). By increasing the resistive load on an irradiated cell continuously from zero (a short circuit) to a very high value (an open circuit) one can determine the maximum power point, the point that maximizes V×I; that is, the load for which the cell can deliver maximum electrical power at that level of irradiation. (The output power is zero in both the short circuit and open circuit extremes).

The maximum power point of a solar cell is affected by its temperature. Knowing the technical data of certain solar cell, its power output at a certain temperature can be obtained by , where is the power generated at the standard testing condition; is the actual temperature of the solar cell.

A high quality, monocrystalline silicon solar cell, at 25 °C cell temperature, may produce 0.60 V open-circuit (VOC). The cell temperature in full sunlight, even with 25 °C air temperature, will probably be close to 45 °C, reducing the open-circuit voltage to 0.55 V per cell. The voltage drops modestly, with this type of cell, until the short-circuit current is approached (ISC). Maximum power (with 45 °C cell temperature) is typically produced with 75% to 80% of the open-circuit voltage (0.43 V in this case) and 90% of the short-circuit current. This output can be up to 70% of the VOC x ISC product. The short-circuit current (ISC) from a cell is nearly proportional to the illumination, while the open-circuit voltage (VOC) may drop only 10% with an 80% drop in illumination. Lower-quality cells have a more rapid drop in voltage with increasing current and could produce only 1/2 VOC at 1/2 ISC. The usable power output could thus drop from 70% of the VOC x ISC product to 50% or even as little as 25%. Vendors who rate their solar cell "power" only as VOC x ISC, without giving load curves, can be seriously distorting their actual performance.

The maximum power point of a photovoltaic varies with incident illumination. For example, accumulation of dust on photovoltaic panels reduces the maximum power point. Recently, new research to remove dust from solar panels has been developed by utilizing electrostatic cleaning systems. In such systems, an applied electrostatic field at the surface of the solar panels causes the dust particles to move in a "flip-flop" manner. Then, due to gravity and the fact that the solar panels are slightly slanted, the dust particles get pulled downward by gravity. These systems only require a small power consumption and enhance the performance of the solar cells, especially when installed in the desert, where dust accumulation contributes to decreasing the solar panel's performance. Also, for systems large enough to justify the extra expense, a maximum power point tracker tracks the instantaneous power by continually measuring the voltage and current (and hence, power transfer), and uses this information to dynamically adjust the load so the maximum power is always transferred, regardless of the variation in lighting.

Fill factor

Another defining term in the overall behaviour of a solar cell is the fill factor (FF). This factor is a measure of quality of a solar cell. This is the available power at the maximum power point (Pm) divided by the open circuit voltage (VOC) and the short circuit current (ISC):

The fill factor can be represented graphically by the IV sweep, where it is the ratio of the different rectangular areas.

The fill factor is directly affected by the values of the cell's series, shunt resistances and diodes losses. Increasing the shunt resistance (Rsh) and decreasing the series resistance (Rs) lead to a higher fill factor, thus resulting in greater efficiency, and bringing the cell's output power closer to its theoretical maximum.

Typical fill factors range from 50% to 82%. The fill factor for a normal silicon PV cell is 80%.

Comparison

Energy conversion efficiency is measured by dividing the electrical output by the incident light power. Factors influencing output include spectral distribution, spatial distribution of power, temperature, and resistive load. IEC standard 61215 is used to compare the performance of cells and is designed around standard (terrestrial, temperate) temperature and conditions (STC): irradiance of 1 kW/m2, a spectral distribution close to solar radiation through AM (airmass) of 1.5 and a cell temperature 25 °C. The resistive load is varied until the peak or maximum power point (MPP) is achieved. The power at this point is recorded as Watt-peak (Wp). The same standard is used for measuring the power and efficiency of PV modules.

Air mass affects output. In space, where there is no atmosphere, the spectrum of the sun is relatively unfiltered. However, on earth, air filters the incoming light, changing the solar spectrum. The filtering effect ranges from Air Mass 0 (AM0) in space, to approximately Air Mass 1.5 on Earth. Multiplying the spectral differences by the quantum efficiency of the solar cell in question yields the efficiency. Terrestrial efficiencies typically are greater than space efficiencies. For example, a silicon solar cell in space might have an efficiency of 14% at AM0, but 16% on earth at AM 1.5. Note, however, that the number of incident photons in space is considerably larger, so the solar cell might produce considerably more power in space, despite the lower efficiency as indicated by reduced percentage of the total incident energy captured.

Solar cell efficiencies vary from 6% for amorphous silicon-based solar cells to 44.0% with multiple-junction production cells and 44.4% with multiple dies assembled into a hybrid package. Solar cell energy conversion efficiencies for commercially available multicrystalline Si solar cells are around 14–19%. The highest efficiency cells have not always been the most economical – for example a 30% efficient multijunction cell based on exotic materials such as gallium arsenide or indium selenide produced at low volume might well cost one hundred times as much as an 8% efficient amorphous silicon cell in mass production, while delivering only about four times the output.

However, there is a way to "boost" solar power. By increasing the light intensity, typically photogenerated carriers are increased, increasing efficiency by up to 15%. These so-called "concentrator systems" have only begun to become cost-competitive as a result of the development of high efficiency GaAs cells. The increase in intensity is typically accomplished by using concentrating optics. A typical concentrator system may use a light intensity 6–400 times the sun, and increase the efficiency of a one sun GaAs cell from 31% at AM 1.5 to 35%.

A common method used to express economic costs is to calculate a price per delivered kilowatt-hour (kWh). The solar cell efficiency in combination with the available irradiation has a major influence on the costs, but generally speaking the overall system efficiency is important. Commercially available solar cells (as of 2006) reached system efficiencies between 5 and 19%.

Undoped crystalline silicon devices are approaching the theoretical limiting efficiency of 29.43%. In 2017, efficiency of 26.63% was achieved in an amorphous silicon/crystalline silicon heterojunction cell that place both positive and negative contacts on the back of the cell.

Energy payback

The energy payback time is defined as the recovery time required for generating the energy spent for manufacturing a modern photovoltaic module. In 2008, it was estimated to be from 1 to 4 years[27][28] depending on the module type and location. With a typical lifetime of 20 to 30 years, this means that modern solar cells would be net energy producers, i.e., they would generate more energy over their lifetime than the energy expended in producing them. Generally, thin-film technologies—despite having comparatively low conversion efficiencies—achieve significantly shorter energy payback times than conventional systems (often < 1 year).

A study published in 2013 which the existing literature found that energy payback time was between 0.75 and 3.5 years with thin film cells being at the lower end and multi-si-cells having a payback time of 1.5–2.6 years. A 2015 review assessed the energy payback time and EROI of solar photovoltaics. In this meta study, which uses an insolation of 1,700 kWh/m2/year and a system lifetime of 30 years, mean harmonized EROIs between 8.7 and 34.2 were found. Mean harmonized energy payback time varied from 1.0 to 4.1 years. Crystalline silicon devices achieve on average an energy payback period of 2 years.

Like any other technology, solar cell manufacture is dependent on the existence of a complex global industrial manufacturing system. This includes the fabrication systems typically accounted for in estimates of manufacturing energy; the contingent mining, refining and global transportation systems; and other energy intensive support systems including finance, information, and security systems. The difficulty in measuring such energy overhead confers some uncertainty on any estimate of payback times.

Technical methods of improving efficiency

Choosing optimum transparent conductor

The illuminated side of some types of solar cells, thin films, have a transparent conducting film to allow light to enter into the active material and to collect the generated charge carriers. Typically, films with high transmittance and high electrical conductance such as indium tin oxide, conducting polymers or conducting nanowire networks are used for the purpose. There is a trade-off between high transmittance and electrical conductance, thus optimum density of conducting nanowires or conducting network structure should be chosen for high efficiency.

Promoting light scattering

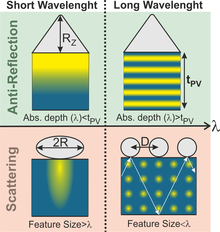
Diagram of the characteristic E-field enhancement profiles experienced in thin photovoltaic films (thickness t_PV) patterned with front features. Two simultaneous optical mechanisms can cause light-trapping: anti-reflection and scattering; and two main spectral regions can be distinguished for each mechanism, at short and long wavelengths, thus leading to the 4 types of absorption enhancement profiles illustrated here across the absorber region. The main geometrical parameter of the photonic structures influencing the absorption enhancement in each profile is indicated by the black arrows.

The inclusion of light-scattering effects in solar cells is a photonic strategy to increase the absorption for the lower-energy sunlight photons (chiefly in near-infrared range) for which the photovoltaic material presents reduced absorption coefficient. Such light-trapping scheme is accomplished by the deviation of the light rays from the incident direction, thereby increasing their path length in the cells' absorber. Conventional approaches used to implement light diffusion are based on textured rear/front surfaces, but many alternative optical designs have been demonstrated with promising results based in diffraction gratings, arrays of metal or dielectric nano/micro particles, wave-optical micro-structuring, among others. When applied in the devices' front these structures can act as geometric anti-reflective coatings, simultaneously reducing the reflection of out-going light.

For instance, lining the light-receiving surface of the cell with nano-sized metallic studs can substantially increase the cell efficiency. Light reflects off these studs at an oblique angle to the cell, increasing the length of the light path through the cell. This increases the number of photons absorbed by the cell and the amount of current generated. The main materials used for the nano-studs are silver, gold, and aluminium. Gold and silver are not very efficient, as they absorb much of the light in the visible spectrum, which contains most of the energy present in sunlight, reducing the amount of light reaching the cell. Aluminium absorbs only ultraviolet radiation, and reflects both visible and infra-red light, so energy loss is minimized. Aluminium can increase cell efficiency up to 22% (in lab conditions).

Anti-reflective coatings and textures

Anti-reflective coatings are engineered to reduce the sunlight reflected from the solar cells, therefore enhancing the light transmitted into the photovoltaic absorber. This can be accomplished by causing the destructive interference of the reflected light waves, such as with coatings based on the front (multi-)layer composition, and/or by geometric refractive-index matching caused by the surface topography, with many architectures inspired by nature. For example, the nipple-array, a hexagonal array of subwavelength conical nanostructures, can be seen at the surface of the moth's eyes. It was reported that utilizing this sort of surface architecture minimizes the reflection losses by 25%, converting the additional captured photon to a 12% increase in a solar cell's energy.

The use of front micro-structures, such as those achieved with texturizing or other photonic features, can also be used as a method to achieve anti-reflectiveness, in which the surface of a solar cell is altered so that the impinging light experiences a gradually increasing effective refractive-index when travelling from air towards the photovoltaic material. These surfaces can be created by etching or using lithography. Concomitantly, they promote light scattering effects which further enhance the absorption, particularly of the longer wavelength sunlight photons. Adding a flat back surface in addition to texturizing the front surface further helps to trap the light within the cell, thus providing a longer optical path.

Radiative cooling

An increase in solar cell temperature of approximately 1 °C causes an efficiency decrease of about 0.45%. To prevent this, a transparent silica crystal layer can be applied to solar panels. The silica layer acts as a thermal black body which emits heat as infrared radiation into space, cooling the cell up to 13 °C. Radiative cooling can thus extend the life of solar cells. Full-system integration of solar energy and radiative cooling is referred to as a combined SE–RC system, which have demonstrated higher energy gain per unit area when compared to non-integrated systems.

Rear surface passivation

Surface passivation is critical to solar cell efficiency. Many improvements have been made to the front side of mass-produced solar cells, but the aluminium back-surface is impeding efficiency improvements. The efficiency of many solar cells has benefitted by creating so-called passivated emitter and rear cells (PERCs). The chemical deposition of a rear-surface dielectric passivation layer stack that is also made of a thin silica or aluminium oxide film topped with a silicon nitride film helps to improve efficiency in silicon solar cells. This helped increase cell efficiency for commercial Cz-Si wafer material from just over 17% to over 21% by the mid-2010s, and the cell efficiency for quasi-mono-Si to a record 19.9%.

Concepts of the rear surface passivation for silicon solar cells has also been implemented for CIGS solar cells. The rear surface passivation shows the potential to improve the efficiency. Al2O3 and SiO2 have been used as the passivation materials. Nano-sized point contacts on Al2O3 layer and line contacts on SiO2 layer provide the electrical connection of CIGS absorber to the rear electrode Molybdenum. The point contacts on the Al2O3 layer are created by e-beam lithography and the line contacts on the SiO2 layer are created using photolithography. Also, the implementation of the passivation layers does not change the morphology of the CIGS layers.

Thin film materials

Although not constituting a direct strategy to improve efficiency, thin film materials show a lot of promise for solar cells in terms of low costs and adaptability to existing structures and frameworks in technology. Since the materials are so thin, they lack the optical absorption of bulk material solar cells. Attempts to correct this have been demonstrated, such as light-trapping schemes promoting light scattering. Also important is thin film surface recombination. Since this is the dominant recombination process of nanoscale thin-film solar cells, it is crucial to their efficiency. Adding a passivating thin layer of silicon dioxide could reduce recombination.

Tandem cells

Tandem solar cells combine two materials to increase efficiency. In 2022 a device was announced that combined multiple perovskite with multiple layers of silicon. Perovskites harvest blue light, while silicon picks up red and infrared wavelengths. The cell achieved 32.5% efficiency.

Entropy (information theory)

From Wikipedia, the free encyclopedia https://en.wikipedia.org/wiki/Entropy_(information_theory) In info...