Search This Blog

Sunday, February 18, 2024

Interdisciplinarity

From Wikipedia, the free encyclopedia
 
Interdisciplinarity or interdisciplinary studies involves the combination of multiple academic disciplines into one activity (e.g., a research project). It draws knowledge from several other fields like sociology, anthropology, psychology, economics, etc. It is about creating something by thinking across boundaries. It is related to an interdiscipline or an interdisciplinary field, which is an organizational unit that crosses traditional boundaries between academic disciplines or schools of thought, as new needs and professions emerge. Large engineering teams are usually interdisciplinary, as a power station or mobile phone or other project requires the melding of several specialties. However, the term "interdisciplinary" is sometimes confined to academic settings.

The term interdisciplinary is applied within education and training pedagogies to describe studies that use methods and insights of several established disciplines or traditional fields of study. Interdisciplinarity involves researchers, students, and teachers in the goals of connecting and integrating several academic schools of thought, professions, or technologies—along with their specific perspectives—in the pursuit of a common task. The epidemiology of HIV/AIDS or global warming requires understanding of diverse disciplines to solve complex problems. Interdisciplinary may be applied where the subject is felt to have been neglected or even misrepresented in the traditional disciplinary structure of research institutions, for example, women's studies or ethnic area studies. Interdisciplinarity can likewise be applied to complex subjects that can only be understood by combining the perspectives of two or more fields.

The adjective interdisciplinary is most often used in educational circles when researchers from two or more disciplines pool their approaches and modify them so that they are better suited to the problem at hand, including the case of the team-taught course where students are required to understand a given subject in terms of multiple traditional disciplines. For example, the subject of land use may appear differently when examined by different disciplines, for instance, biology, chemistry, economics, geography, and politics.

Development

Although "interdisciplinary" and "interdisciplinarity" are frequently viewed as twentieth century terms, the concept has historical antecedents, most notably Greek philosophy. Julie Thompson Klein attests that "the roots of the concepts lie in a number of ideas that resonate through modern discourse—the ideas of a unified science, general knowledge, synthesis and the integration of knowledge", while Giles Gunn says that Greek historians and dramatists took elements from other realms of knowledge (such as medicine or philosophy) to further understand their own material. The building of Roman roads required men who understood surveying, material science, logistics and several other disciplines. Any broadminded humanist project involves interdisciplinarity, and history shows a crowd of cases, as seventeenth-century Leibniz's task to create a system of universal justice, which required linguistics, economics, management, ethics, law philosophy, politics, and even sinology.

Interdisciplinary programs sometimes arise from a shared conviction that the traditional disciplines are unable or unwilling to address an important problem. For example, social science disciplines such as anthropology and sociology paid little attention to the social analysis of technology throughout most of the twentieth century. As a result, many social scientists with interests in technology have joined science, technology and society programs, which are typically staffed by scholars drawn from numerous disciplines. They may also arise from new research developments, such as nanotechnology, which cannot be addressed without combining the approaches of two or more disciplines. Examples include quantum information processing, an amalgamation of quantum physics and computer science, and bioinformatics, combining molecular biology with computer science. Sustainable development as a research area deals with problems requiring analysis and synthesis across economic, social and environmental spheres; often an integration of multiple social and natural science disciplines. Interdisciplinary research is also key to the study of health sciences, for example in studying optimal solutions to diseases. Some institutions of higher education offer accredited degree programs in Interdisciplinary Studies.

At another level, interdisciplinarity is seen as a remedy to the harmful effects of excessive specialization and isolation in information silos. On some views, however, interdisciplinarity is entirely indebted to those who specialize in one field of study—that is, without specialists, interdisciplinarians would have no information and no leading experts to consult. Others place the focus of interdisciplinarity on the need to transcend disciplines, viewing excessive specialization as problematic both epistemologically and politically. When interdisciplinary collaboration or research results in new solutions to problems, much information is given back to the various disciplines involved. Therefore, both disciplinarians and interdisciplinarians may be seen in complementary relation to one another.

Barriers

Because most participants in interdisciplinary ventures were trained in traditional disciplines, they must learn to appreciate differences of perspectives and methods. For example, a discipline that places more emphasis on quantitative rigor may produce practitioners who are more scientific in their training than others; in turn, colleagues in "softer" disciplines who may associate quantitative approaches with difficulty grasp the broader dimensions of a problem and lower rigor in theoretical and qualitative argumentation. An interdisciplinary program may not succeed if its members remain stuck in their disciplines (and in disciplinary attitudes). Those who lack experience in interdisciplinary collaborations may also not fully appreciate the intellectual contribution of colleagues from those discipline. From the disciplinary perspective, however, much interdisciplinary work may be seen as "soft", lacking in rigor, or ideologically motivated; these beliefs place barriers in the career paths of those who choose interdisciplinary work. For example, interdisciplinary grant applications are often refereed by peer reviewers drawn from established disciplines; interdisciplinary researchers may experience difficulty getting funding for their research. In addition, untenured researchers know that, when they seek promotion and tenure, it is likely that some of the evaluators will lack commitment to interdisciplinarity. They may fear that making a commitment to interdisciplinary research will increase the risk of being denied tenure.

Interdisciplinary programs may also fail if they are not given sufficient autonomy. For example, interdisciplinary faculty are usually recruited to a joint appointment, with responsibilities in both an interdisciplinary program (such as women's studies) and a traditional discipline (such as history). If the traditional discipline makes the tenure decisions, new interdisciplinary faculty will be hesitant to commit themselves fully to interdisciplinary work. Other barriers include the generally disciplinary orientation of most scholarly journals, leading to the perception, if not the fact, that interdisciplinary research is hard to publish. In addition, since traditional budgetary practices at most universities channel resources through the disciplines, it becomes difficult to account for a given scholar or teacher's salary and time. During periods of budgetary contraction, the natural tendency to serve the primary constituency (i.e., students majoring in the traditional discipline) makes resources scarce for teaching and research comparatively far from the center of the discipline as traditionally understood. For these same reasons, the introduction of new interdisciplinary programs is often resisted because it is perceived as a competition for diminishing funds.

Due to these and other barriers, interdisciplinary research areas are strongly motivated to become disciplines themselves. If they succeed, they can establish their own research funding programs and make their own tenure and promotion decisions. In so doing, they lower the risk of entry. Examples of former interdisciplinary research areas that have become disciplines, many of them named for their parent disciplines, include neuroscience, cybernetics, biochemistry and biomedical engineering. These new fields are occasionally referred to as "interdisciplines". On the other hand, even though interdisciplinary activities are now a focus of attention for institutions promoting learning and teaching, as well as organizational and social entities concerned with education, they are practically facing complex barriers, serious challenges and criticism. The most important obstacles and challenges faced by interdisciplinary activities in the past two decades can be divided into "professional", "organizational", and "cultural" obstacles.

Interdisciplinary studies and studies of interdisciplinarity

An initial distinction should be made between interdisciplinary studies, which can be found spread across the academy today, and the study of interdisciplinarity, which involves a much smaller group of researchers. The former is instantiated in thousands of research centers across the US and the world. The latter has one US organization, the Association for Interdisciplinary Studies (founded in 1979), two international organizations, the International Network of Inter- and Transdisciplinarity (founded in 2010) and the Philosophy of/as Interdisciplinarity Network (founded in 2009). The US's research institute devoted to the theory and practice of interdisciplinarity, the Center for the Study of Interdisciplinarity at the University of North Texas, was founded in 2008 but is closed as of 1 September 2014, the result of administrative decisions at the University of North Texas.

An interdisciplinary study is an academic program or process seeking to synthesize broad perspectives, knowledge, skills, interconnections, and epistemology in an educational setting. Interdisciplinary programs may be founded in order to facilitate the study of subjects which have some coherence, but which cannot be adequately understood from a single disciplinary perspective (for example, women's studies or medieval studies). More rarely, and at a more advanced level, interdisciplinarity may itself become the focus of study, in a critique of institutionalized disciplines' ways of segmenting knowledge.

In contrast, studies of interdisciplinarity raise to self-consciousness questions about how interdisciplinarity works, the nature and history of disciplinarity, and the future of knowledge in post-industrial society. Researchers at the Center for the Study of Interdisciplinarity have made the distinction between philosophy 'of' and 'as' interdisciplinarity, the former identifying a new, discrete area within philosophy that raises epistemological and metaphysical questions about the status of interdisciplinary thinking, with the latter pointing toward a philosophical practice that is sometimes called 'field philosophy'.

Perhaps the most common complaint regarding interdisciplinary programs, by supporters and detractors alike, is the lack of synthesis—that is, students are provided with multiple disciplinary perspectives but are not given effective guidance in resolving the conflicts and achieving a coherent view of the subject. Others have argued that the very idea of synthesis or integration of disciplines presupposes questionable politico-epistemic commitments. Critics of interdisciplinary programs feel that the ambition is simply unrealistic, given the knowledge and intellectual maturity of all but the exceptional undergraduate; some defenders concede the difficulty, but insist that cultivating interdisciplinarity as a habit of mind, even at that level, is both possible and essential to the education of informed and engaged citizens and leaders capable of analyzing, evaluating, and synthesizing information from multiple sources in order to render reasoned decisions.

While much has been written on the philosophy and promise of interdisciplinarity in academic programs and professional practice, social scientists are increasingly interrogating academic discourses on interdisciplinarity, as well as how interdisciplinarity actually works—and does not—in practice. Some have shown, for example, that some interdisciplinary enterprises that aim to serve society can produce deleterious outcomes for which no one can be held to account.

Politics of interdisciplinary studies

Since 1998, there has been an ascendancy in the value of interdisciplinary research and teaching and a growth in the number of bachelor's degrees awarded at U.S. universities classified as multi- or interdisciplinary studies. The number of interdisciplinary bachelor's degrees awarded annually rose from 7,000 in 1973 to 30,000 a year by 2005 according to data from the National Center of Educational Statistics (NECS). In addition, educational leaders from the Boyer Commission to Carnegie's President Vartan Gregorian to Alan I. Leshner, CEO of the American Association for the Advancement of Science have advocated for interdisciplinary rather than disciplinary approaches to problem-solving in the 21st century. This has been echoed by federal funding agencies, particularly the National Institutes of Health under the direction of Elias Zerhouni, who has advocated that grant proposals be framed more as interdisciplinary collaborative projects than single-researcher, single-discipline ones.

At the same time, many thriving longstanding bachelor's in interdisciplinary studies programs in existence for 30 or more years, have been closed down, in spite of healthy enrollment. Examples include Arizona International (formerly part of the University of Arizona), the School of Interdisciplinary Studies at Miami University, and the Department of Interdisciplinary Studies at Wayne State University; others such as the Department of Interdisciplinary Studies at Appalachian State University, and George Mason University's New Century College, have been cut back. Stuart Henry has seen this trend as part of the hegemony of the disciplines in their attempt to recolonize the experimental knowledge production of otherwise marginalized fields of inquiry. This is due to threat perceptions seemingly based on the ascendancy of interdisciplinary studies against traditional academia.

Examples

Historical examples

There are many examples of when a particular idea, almost on the same period, arises in different disciplines. One case is the shift from the approach of focusing on "specialized segments of attention" (adopting one particular perspective), to the idea of "instant sensory awareness of the whole", an attention to the "total field", a "sense of the whole pattern, of form and function as a unity", an "integral idea of structure and configuration". This has happened in painting (with cubism), physics, poetry, communication and educational theory. According to Marshall McLuhan, this paradigm shift was due to the passage from an era shaped by mechanization, which brought sequentiality, to the era shaped by the instant speed of electricity, which brought simultaneity.

Efforts to simplify and defend the concept

An article in the Social Science Journal attempts to provide a simple, common-sense, definition of interdisciplinarity, bypassing the difficulties of defining that concept and obviating the need for such related concepts as transdisciplinarity, pluridisciplinarity, and multidisciplinary:

To begin with, a discipline can be conveniently defined as any comparatively self-contained and isolated domain of human experience which possesses its own community of experts. Interdisciplinarity is best seen as bringing together distinctive components of two or more disciplines. In academic discourse, interdisciplinarity typically applies to four realms: knowledge, research, education, and theory. Interdisciplinary knowledge involves familiarity with components of two or more disciplines. Interdisciplinary research combines components of two or more disciplines in the search or creation of new knowledge, operations, or artistic expressions. Interdisciplinary education merges components of two or more disciplines in a single program of instruction. Interdisciplinary theory takes interdisciplinary knowledge, research, or education as its main objects of study.

In turn, interdisciplinary richness of any two instances of knowledge, research, or education can be ranked by weighing four variables: number of disciplines involved, the "distance" between them, the novelty of any particular combination, and their extent of integration.

Interdisciplinary knowledge and research are important because:

  1. "Creativity often requires interdisciplinary knowledge.
  2. Immigrants often make important contributions to their new field.
  3. Disciplinarians often commit errors which can be best detected by people familiar with two or more disciplines.
  4. Some worthwhile topics of research fall in the interstices among the traditional disciplines.
  5. Many intellectual, social, and practical problems require interdisciplinary approaches.
  6. Interdisciplinary knowledge and research serve to remind us of the unity-of-knowledge ideal.
  7. Interdisciplinarians enjoy greater flexibility in their research.
  8. More so than narrow disciplinarians, interdisciplinarians often treat themselves to the intellectual equivalent of traveling in new lands.
  9. Interdisciplinarians may help breach communication gaps in the modern academy, thereby helping to mobilize its enormous intellectual resources in the cause of greater social rationality and justice.
  10. By bridging fragmented disciplines, interdisciplinarians might play a role in the defense of academic freedom."

Quotations

"The modern mind divides, specializes, thinks in categories: the Greek instinct was the opposite, to take the widest view, to see things as an organic whole [...]. The Olympic games were designed to test the arete of the whole man, not a merely specialized skill [...]. The great event was the pentathlon, if you won this, you were a man. Needless to say, the Marathon race was never heard of until modern times: the Greeks would have regarded it as a monstrosity."

"Previously, men could be divided simply into the learned and the ignorant, those more or less the one, and those more or less the other. But your specialist cannot be brought in under either of these two categories. He is not learned, for he is formally ignorant of all that does not enter into his specialty; but neither is he ignorant, because he is 'a scientist,' and 'knows' very well his own tiny portion of the universe. We shall have to say that he is a learned ignoramus, which is a very serious matter, as it implies that he is a person who is ignorant, not in the fashion of the ignorant man, but with all the petulance of one who is learned in his own special line."

"It is the custom among those who are called 'practical' men to condemn any man capable of a wide survey as a visionary: no man is thought worthy of a voice in politics unless he ignores or does not know nine-tenths of the most important relevant facts."
Scientific visualization

From Wikipedia, the free encyclopedia
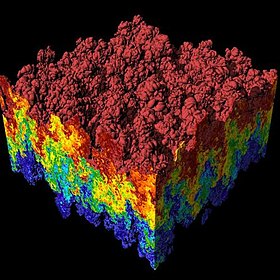
A scientific visualization of a simulation of a Rayleigh–Taylor instability caused by two mixing fluids.
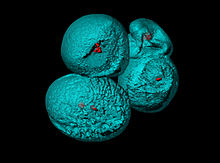
Surface rendering of Arabidopsis thaliana pollen grains with confocal microscope.

Scientific visualization (also spelled scientific visualisation) is an interdisciplinary branch of science concerned with the visualization of scientific phenomena. It is also considered a subset of computer graphics, a branch of computer science. The purpose of scientific visualization is to graphically illustrate scientific data to enable scientists to understand, illustrate, and glean insight from their data. Research into how people read and misread various types of visualizations is helping to determine what types and features of visualizations are most understandable and effective in conveying information.

History

Charles Minard's flow map of Napoleon's March.

One of the earliest examples of three-dimensional scientific visualisation was Maxwell's thermodynamic surface, sculpted in clay in 1874 by James Clerk Maxwell. This prefigured modern scientific visualization techniques that use computer graphics.

Notable early two-dimensional examples include the flow map of Napoleon's March on Moscow produced by Charles Joseph Minard in 1869; the "coxcombs" used by Florence Nightingale in 1857 as part of a campaign to improve sanitary conditions in the British army; and the dot map used by John Snow in 1855 to visualise the Broad Street cholera outbreak.

Data visualization methods

Criteria for classifications:

  • dimension of the data
  • method
    • textura based methods
    • geometry-based approaches such as arrow plots, streamlines, pathlines, timelines, streaklines, particle tracing, surface particles, stream arrows, stream tubes, stream balls, flow volumes and topological analysis

Two-dimensional data sets

Scientific visualization using computer graphics gained in popularity as graphics matured. Primary applications were scalar fields and vector fields from computer simulations and also measured data. The primary methods for visualizing two-dimensional (2D) scalar fields are color mapping and drawing contour lines. 2D vector fields are visualized using glyphs and streamlines or line integral convolution methods. 2D tensor fields are often resolved to a vector field by using one of the two eigenvectors to represent the tensor each point in the field and then visualized using vector field visualization methods.

Three-dimensional data sets

For 3D scalar fields the primary methods are volume rendering and isosurfaces. Methods for visualizing vector fields include glyphs (graphical icons) such as arrows, streamlines and streaklines, particle tracing, line integral convolution (LIC) and topological methods. Later, visualization techniques such as hyperstreamlines were developed to visualize 2D and 3D tensor fields.

Topics

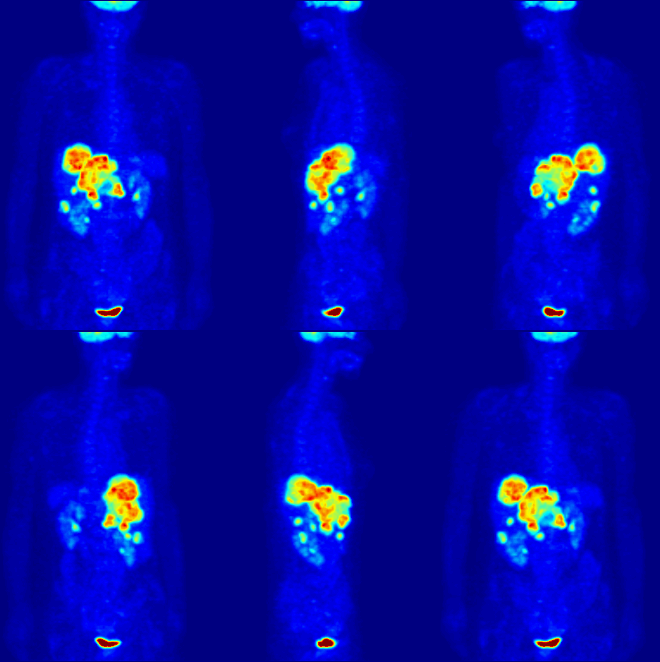
Maximum intensity projection (MIP) of a whole body PET scan.
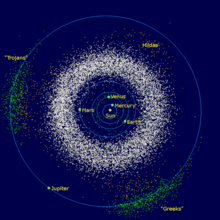
Solar System image of the main asteroid belt and the Trojan asteroids.
Scientific visualization of Fluid Flow: Surface waves in water
Chemical imaging of a simultaneous release of SF6 and NH3.
Topographic scan of a glass surface by an Atomic force microscope.

Computer animation

Computer animation is the art, technique, and science of creating moving images via the use of computers. It is becoming more common to be created by means of 3D computer graphics, though 2D computer graphics are still widely used for stylistic, low bandwidth, and faster real-time rendering needs. Sometimes the target of the animation is the computer itself, but sometimes the target is another medium, such as film. It is also referred to as CGI (Computer-generated imagery or computer-generated imaging), especially when used in films. Applications include medical animation, which is most commonly utilized as an instructional tool for medical professionals or their patients.

Computer simulation

Computer simulation is a computer program, or network of computers, that attempts to simulate an abstract model of a particular system. Computer simulations have become a useful part of mathematical modelling of many natural systems in physics, and computational physics, chemistry and biology; human systems in economics, psychology, and social science; and in the process of engineering and new technology, to gain insight into the operation of those systems, or to observe their behavior. The simultaneous visualization and simulation of a system is called visulation.

Computer simulations vary from computer programs that run a few minutes, to network-based groups of computers running for hours, to ongoing simulations that run for months. The scale of events being simulated by computer simulations has far exceeded anything possible (or perhaps even imaginable) using the traditional paper-and-pencil mathematical modeling: over 10 years ago, a desert-battle simulation, of one force invading another, involved the modeling of 66,239 tanks, trucks and other vehicles on simulated terrain around Kuwait, using multiple supercomputers in the DoD High Performance Computing Modernization Program.

Information visualization

Information visualization is the study of "the visual representation of large-scale collections of non-numerical information, such as files and lines of code in software systems, library and bibliographic databases, networks of relations on the internet, and so forth".

Information visualization focused on the creation of approaches for conveying abstract information in intuitive ways. Visual representations and interaction techniques take advantage of the human eye's broad bandwidth pathway into the mind to allow users to see, explore, and understand large amounts of information at once. The key difference between scientific visualization and information visualization is that information visualization is often applied to data that is not generated by scientific inquiry. Some examples are graphical representations of data for business, government, news and social media.

Interface technology and perception

Interface technology and perception shows how new interfaces and a better understanding of underlying perceptual issues create new opportunities for the scientific visualization community.

Surface rendering

Rendering is the process of generating an image from a model, by means of computer programs. The model is a description of three-dimensional objects in a strictly defined language or data structure. It would contain geometry, viewpoint, texture, lighting, and shading information. The image is a digital image or raster graphics image. The term may be by analogy with an "artist's rendering" of a scene. 'Rendering' is also used to describe the process of calculating effects in a video editing file to produce final video output. Important rendering techniques are:

Scanline rendering and rasterisation
A high-level representation of an image necessarily contains elements in a different domain from pixels. These elements are referred to as primitives. In a schematic drawing, for instance, line segments and curves might be primitives. In a graphical user interface, windows and buttons might be the primitives. In 3D rendering, triangles and polygons in space might be primitives.
Ray casting
Ray casting is primarily used for realtime simulations, such as those used in 3D computer games and cartoon animations, where detail is not important, or where it is more efficient to manually fake the details in order to obtain better performance in the computational stage. This is usually the case when a large number of frames need to be animated. The resulting surfaces have a characteristic 'flat' appearance when no additional tricks are used, as if objects in the scene were all painted with matte finish.
Radiosity
Radiosity, also known as Global Illumination, is a method that attempts to simulate the way in which directly illuminated surfaces act as indirect light sources that illuminate other surfaces. This produces more realistic shading and seems to better capture the 'ambience' of an indoor scene. A classic example is the way that shadows 'hug' the corners of rooms.
Ray tracing
Ray tracing is an extension of the same technique developed in scanline rendering and ray casting. Like those, it handles complicated objects well, and the objects may be described mathematically. Unlike scanline and casting, ray tracing is almost always a Monte Carlo technique, that is one based on averaging a number of randomly generated samples from a model.

Volume rendering

Volume rendering is a technique used to display a 2D projection of a 3D discretely sampled data set. A typical 3D data set is a group of 2D slice images acquired by a CT or MRI scanner. Usually these are acquired in a regular pattern (e.g., one slice every millimeter) and usually have a regular number of image pixels in a regular pattern. This is an example of a regular volumetric grid, with each volume element, or voxel represented by a single value that is obtained by sampling the immediate area surrounding the voxel.

Volume visualization

According to Rosenblum (1994) "volume visualization examines a set of techniques that allows viewing an object without mathematically representing the other surface. Initially used in medical imaging, volume visualization has become an essential technique for many sciences, portraying phenomena become an essential technique such as clouds, water flows, and molecular and biological structure. Many volume visualization algorithms are computationally expensive and demand large data storage. Advances in hardware and software are generalizing volume visualization as well as real time performances".

Developments of web-based technologies, and in-browser rendering have allowed of simple volumetric presentation of a cuboid with a changing frame of reference to show volume, mass and density data.

Applications

This section will give a series of examples how scientific visualization can be applied today.

In the natural sciences

Star formation: The featured plot is a Volume plot of the logarithm of gas/dust density in an Enzo star and galaxy simulation. Regions of high density are white while less dense regions are more blue and also more transparent.

Gravitational waves: Researchers used the Globus Toolkit to harness the power of multiple supercomputers to simulate the gravitational effects of black-hole collisions.

Massive Star Supernovae Explosions: In the image, three-Dimensional Radiation Hydrodynamics Calculations of Massive Star Supernovae Explosions The DJEHUTY stellar evolution code was used to calculate the explosion of SN 1987A model in three dimensions.

Molecular rendering: VisIt's general plotting capabilities were used to create the molecular rendering shown in the featured visualization. The original data was taken from the Protein Data Bank and turned into a VTK file before rendering.

In geography and ecology

Terrain visualization: VisIt can read several file formats common in the field of Geographic Information Systems (GIS), allowing one to plot raster data such as terrain data in visualizations. The featured image shows a plot of a DEM dataset containing mountainous areas near Dunsmuir, CA. Elevation lines are added to the plot to help delineate changes in elevation.

Tornado Simulation: This image was created from data generated by a tornado simulation calculated on NCSA's IBM p690 computing cluster. High-definition television animations of the storm produced at NCSA were included in an episode of the PBS television series NOVA called "Hunt for the Supertwister." The tornado is shown by spheres that are colored according to pressure; orange and blue tubes represent the rising and falling airflow around the tornado.

Climate visualization: This visualization depicts the carbon dioxide from various sources that are advected individually as tracers in the atmosphere model. Carbon dioxide from the ocean is shown as plumes during February 1900.

Atmospheric Anomaly in Times Square In the image the results from the SAMRAI simulation framework of an atmospheric anomaly in and around Times Square are visualized.

In mathematics

Scientific visualization of mathematical structures has been undertaken for purposes of building intuition and for aiding the forming of mental models.

Domain coloring of f(x) = (x2−1)(x−2−i)2/x2+2+2i

Higher-dimensional objects can be visualized in form of projections (views) in lower dimensions. In particular, 4-dimensional objects are visualized by means of projection in three dimensions. The lower-dimensional projections of higher-dimensional objects can be used for purposes of virtual object manipulation, allowing 3D objects to be manipulated by operations performed in 2D, and 4D objects by interactions performed in 3D.

In complex analysis, functions of the complex plane are inherently 4-dimensional, but there is no natural geometric projection into lower dimensional visual representations. Instead, colour vision is exploited to capture dimensional information using techniques such as domain coloring.

In the formal sciences

Computer mapping of topographical surfaces: Through computer mapping of topographical surfaces, mathematicians can test theories of how materials will change when stressed. The imaging is part of the work on the NSF-funded Electronic Visualization Laboratory at the University of Illinois at Chicago.

Curve plots: VisIt can plot curves from data read from files and it can be used to extract and plot curve data from higher-dimensional datasets using lineout operators or queries. The curves in the featured image correspond to elevation data along lines drawn on DEM data and were created with the feature lineout capability. Lineout allows you to interactively draw a line, which specifies a path for data extraction. The resulting data was then plotted as curves.

Image annotations: The featured plot shows Leaf Area Index (LAI), a measure of global vegetative matter, from a NetCDF dataset. The primary plot is the large plot at the bottom, which shows the LAI for the whole world. The plots on top are actually annotations that contain images generated earlier. Image annotations can be used to include material that enhances a visualization such as auxiliary plots, images of experimental data, project logos, etc.

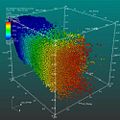
Scatter plot: VisIt's Scatter plot allows visualizing multivariate data of up to four dimensions. The Scatter plot takes multiple scalar variables and uses them for different axes in phase space. The different variables are combined to form coordinates in the phase space and they are displayed using glyphs and colored using another scalar variable.

In the applied sciences

Porsche 911 model (NASTRAN model): The featured plot contains a Mesh plot of a Porsche 911 model imported from a NASTRAN bulk data file. VisIt can read a limited subset of NASTRAN bulk data files, in general enough to import model geometry for visualization.

YF-17 aircraft Plot: The featured image displays plots of a CGNS dataset representing a YF-17 jet aircraft. The dataset consists of an unstructured grid with solution. The image was created by using a pseudocolor plot of the dataset's Mach variable, a Mesh plot of the grid, and Vector plot of a slice through the Velocity field.

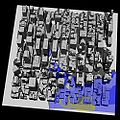
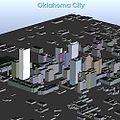
City rendering: An ESRI shapefile containing a polygonal description of the building footprints was read in and then the polygons were resampled onto a rectilinear grid, which was extruded into the featured cityscape.

Inbound traffic measured: This image is a visualization study of inbound traffic measured in billions of bytes on the NSFNET T1 backbone for the month of September 1991. The traffic volume range is depicted from purple (zero bytes) to white (100 billion bytes). It represents data collected by Merit Network, Inc.

Organizations

Important laboratories in the field are:

Conferences in this field, ranked by significance in scientific visualization research, are:

See further: Computer graphics organizations, Supercomputing facilities

Scientific modelling

From Wikipedia, the free encyclopedia
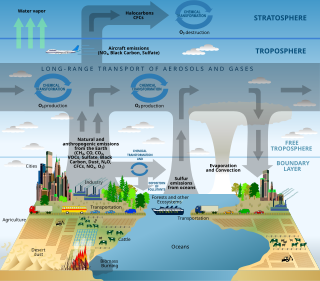
Example scientific modelling. A schematic of chemical and transport processes related to atmospheric composition.

Scientific modelling is an activity that produces models representing empirical objects, phenomena, and physical processes, to make a particular part or feature of the world easier to understand, define, quantify, visualize, or simulate. It requires selecting and identifying relevant aspects of a situation in the real world and then developing a model to replicate a system with those features. Different types of models may be used for different purposes, such as conceptual models to better understand, operational models to operationalize, mathematical models to quantify, computational models to simulate, and graphical models to visualize the subject.

Modelling is an essential and inseparable part of many scientific disciplines, each of which has its own ideas about specific types of modelling. The following was said by John von Neumann.

... the sciences do not try to explain, they hardly even try to interpret, they mainly make models. By a model is meant a mathematical construct which, with the addition of certain verbal interpretations, describes observed phenomena. The justification of such a mathematical construct is solely and precisely that it is expected to work—that is, correctly to describe phenomena from a reasonably wide area.

There is also an increasing attention to scientific modelling in fields such as science education, philosophy of science, systems theory, and knowledge visualization. There is a growing collection of methods, techniques and meta-theory about all kinds of specialized scientific modelling.

Overview

A scientific model seeks to represent empirical objects, phenomena, and physical processes in a logical and objective way. All models are in simulacra, that is, simplified reflections of reality that, despite being approximations, can be extremely useful. Building and disputing models is fundamental to the scientific enterprise. Complete and true representation may be impossible, but scientific debate often concerns which is the better model for a given task, e.g., which is the more accurate climate model for seasonal forecasting.

Attempts to formalize the principles of the empirical sciences use an interpretation to model reality, in the same way logicians axiomatize the principles of logic. The aim of these attempts is to construct a formal system that will not produce theoretical consequences that are contrary to what is found in reality. Predictions or other statements drawn from such a formal system mirror or map the real world only insofar as these scientific models are true.

For the scientist, a model is also a way in which the human thought processes can be amplified. For instance, models that are rendered in software allow scientists to leverage computational power to simulate, visualize, manipulate and gain intuition about the entity, phenomenon, or process being represented. Such computer models are in silico. Other types of scientific models are in vivo (living models, such as laboratory rats) and in vitro (in glassware, such as tissue culture).

Basics

Modelling as a substitute for direct measurement and experimentation

Models are typically used when it is either impossible or impractical to create experimental conditions in which scientists can directly measure outcomes. Direct measurement of outcomes under controlled conditions (see Scientific method) will always be more reliable than modeled estimates of outcomes.

Within modeling and simulation, a model is a task-driven, purposeful simplification and abstraction of a perception of reality, shaped by physical, legal, and cognitive constraints. It is task-driven because a model is captured with a certain question or task in mind. Simplifications leave all the known and observed entities and their relation out that are not important for the task. Abstraction aggregates information that is important but not needed in the same detail as the object of interest. Both activities, simplification, and abstraction, are done purposefully. However, they are done based on a perception of reality. This perception is already a model in itself, as it comes with a physical constraint. There are also constraints on what we are able to legally observe with our current tools and methods, and cognitive constraints that limit what we are able to explain with our current theories. This model comprises the concepts, their behavior, and their relations informal form and is often referred to as a conceptual model. In order to execute the model, it needs to be implemented as a computer simulation. This requires more choices, such as numerical approximations or the use of heuristics. Despite all these epistemological and computational constraints, simulation has been recognized as the third pillar of scientific methods: theory building, simulation, and experimentation.

Simulation

A simulation is a way to implement the model, often employed when the model is too complex for the analytical solution. A steady-state simulation provides information about the system at a specific instant in time (usually at equilibrium, if such a state exists). A dynamic simulation provides information over time. A simulation shows how a particular object or phenomenon will behave. Such a simulation can be useful for testing, analysis, or training in those cases where real-world systems or concepts can be represented by models.

Structure

Structure is a fundamental and sometimes intangible notion covering the recognition, observation, nature, and stability of patterns and relationships of entities. From a child's verbal description of a snowflake, to the detailed scientific analysis of the properties of magnetic fields, the concept of structure is an essential foundation of nearly every mode of inquiry and discovery in science, philosophy, and art.

Systems

A system is a set of interacting or interdependent entities, real or abstract, forming an integrated whole. In general, a system is a construct or collection of different elements that together can produce results not obtainable by the elements alone. The concept of an 'integrated whole' can also be stated in terms of a system embodying a set of relationships which are differentiated from relationships of the set to other elements, and form relationships between an element of the set and elements not a part of the relational regime. There are two types of system models: 1) discrete in which the variables change instantaneously at separate points in time and, 2) continuous where the state variables change continuously with respect to time.

Generating a model

Modelling is the process of generating a model as a conceptual representation of some phenomenon. Typically a model will deal with only some aspects of the phenomenon in question, and two models of the same phenomenon may be essentially different—that is to say, that the differences between them comprise more than just a simple renaming of components.

Such differences may be due to differing requirements of the model's end users, or to conceptual or aesthetic differences among the modelers and to contingent decisions made during the modelling process. Considerations that may influence the structure of a model might be the modeler's preference for a reduced ontology, preferences regarding statistical models versus deterministic models, discrete versus continuous time, etc. In any case, users of a model need to understand the assumptions made that are pertinent to its validity for a given use.

Building a model requires abstraction. Assumptions are used in modelling in order to specify the domain of application of the model. For example, the special theory of relativity assumes an inertial frame of reference. This assumption was contextualized and further explained by the general theory of relativity. A model makes accurate predictions when its assumptions are valid, and might well not make accurate predictions when its assumptions do not hold. Such assumptions are often the point with which older theories are succeeded by new ones (the general theory of relativity works in non-inertial reference frames as well).

Evaluating a model

A model is evaluated first and foremost by its consistency to empirical data; any model inconsistent with reproducible observations must be modified or rejected. One way to modify the model is by restricting the domain over which it is credited with having high validity. A case in point is Newtonian physics, which is highly useful except for the very small, the very fast, and the very massive phenomena of the universe. However, a fit to empirical data alone is not sufficient for a model to be accepted as valid. Factors important in evaluating a model include:

  • Ability to explain past observations
  • Ability to predict future observations
  • Cost of use, especially in combination with other models
  • Refutability, enabling estimation of the degree of confidence in the model
  • Simplicity, or even aesthetic appeal

People may attempt to quantify the evaluation of a model using a utility function.

Visualization

Visualization is any technique for creating images, diagrams, or animations to communicate a message. Visualization through visual imagery has been an effective way to communicate both abstract and concrete ideas since the dawn of man. Examples from history include cave paintings, Egyptian hieroglyphs, Greek geometry, and Leonardo da Vinci's revolutionary methods of technical drawing for engineering and scientific purposes.

Space mapping

Space mapping refers to a methodology that employs a "quasi-global" modelling formulation to link companion "coarse" (ideal or low-fidelity) with "fine" (practical or high-fidelity) models of different complexities. In engineering optimization, space mapping aligns (maps) a very fast coarse model with its related expensive-to-compute fine model so as to avoid direct expensive optimization of the fine model. The alignment process iteratively refines a "mapped" coarse model (surrogate model).

Types

Applications

Modelling and simulation

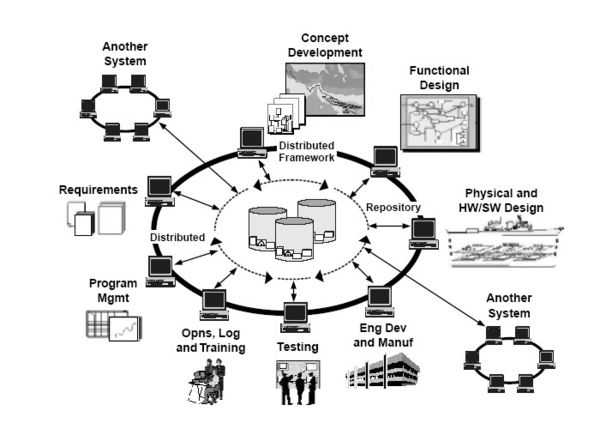
One application of scientific modelling is the field of modelling and simulation, generally referred to as "M&S". M&S has a spectrum of applications which range from concept development and analysis, through experimentation, measurement, and verification, to disposal analysis. Projects and programs may use hundreds of different simulations, simulators and model analysis tools.

Example of the integrated use of Modelling and Simulation in Defence life cycle management. The modelling and simulation in this image is represented in the center of the image with the three containers.

The figure shows how modelling and simulation is used as a central part of an integrated program in a defence capability development process.

Internal validity


From Wikipedia, the free encyclopedia
https://en.wikipedia.org/wiki/Internal_validity

Internal validity is the extent to which a piece of evidence supports a claim about cause and effect, within the context of a particular study. It is one of the most important properties of scientific studies and is an important concept in reasoning about evidence more generally. Internal validity is determined by how well a study can rule out alternative explanations for its findings (usually, sources of systematic error or 'bias'). It contrasts with external validity, the extent to which results can justify conclusions about other contexts (that is, the extent to which results can be generalized). Both internal and external validity can be described using qualitative or quantitative forms of causal notation.

Details

Inferences are said to possess internal validity if a causal relationship between two variables is properly demonstrated. A valid causal inference may be made when three criteria are satisfied:

  1. the "cause" precedes the "effect" in time (temporal precedence),
  2. the "cause" and the "effect" tend to occur together (covariation), and
  3. there are no plausible alternative explanations for the observed covariation (nonspuriousness).

In scientific experimental settings, researchers often change the state of one variable (the independent variable) to see what effect it has on a second variable (the dependent variable). For example, a researcher might manipulate the dosage of a particular drug between different groups of people to see what effect it has on health. In this example, the researcher wants to make a causal inference, namely, that different doses of the drug may be held responsible for observed changes or differences. When the researcher may confidently attribute the observed changes or differences in the dependent variable to the independent variable (that is, when the researcher observes an association between these variables and can rule out other explanations or rival hypotheses), then the causal inference is said to be internally valid.

In many cases, however, the size of effects found in the dependent variable may not just depend on

  • variations in the independent variable,
  • the power of the instruments and statistical procedures used to measure and detect the effects, and
  • the choice of statistical methods (see: Statistical conclusion validity).

Rather, a number of variables or circumstances uncontrolled for (or uncontrollable) may lead to additional or alternative explanations (a) for the effects found and/or (b) for the magnitude of the effects found. Internal validity, therefore, is more a matter of degree than of either-or, and that is exactly why research designs other than true experiments may also yield results with a high degree of internal validity.

In order to allow for inferences with a high degree of internal validity, precautions may be taken during the design of the study. As a rule of thumb, conclusions based on direct manipulation of the independent variable allow for greater internal validity than conclusions based on an association observed without manipulation.

When considering only Internal Validity, highly controlled true experimental designs (i.e. with random selection, random assignment to either the control or experimental groups, reliable instruments, reliable manipulation processes, and safeguards against confounding factors) may be the "gold standard" of scientific research. However, the very methods used to increase internal validity may also limit the generalizability or external validity of the findings. For example, studying the behavior of animals in a zoo may make it easier to draw valid causal inferences within that context, but these inferences may not generalize to the behavior of animals in the wild. In general, a typical experiment in a laboratory, studying a particular process, may leave out many variables that normally strongly affect that process in nature.

Example threats

To recall eight of these threats to internal validity, use the mnemonic acronym, THIS MESS, which stands for:

  • Testing,
  • History,
  • Instrument change,
  • Statistical regression toward the mean,
  • Maturation,
  • Experimental mortality,
  • Selection, and
  • Selection Interaction.

Ambiguous temporal precedence

When it is not known which variable changed first, it can be difficult to determine which variable is the cause and which is the effect.

Confounding

A major threat to the validity of causal inferences is confounding: Changes in the dependent variable may rather be attributed to variations in a third variable which is related to the manipulated variable. Where spurious relationships cannot be ruled out, rival hypotheses to the original causal inference may be developed.

Selection bias

Selection bias refers to the problem that, at pre-test, differences between groups exist that may interact with the independent variable and thus be 'responsible' for the observed outcome. Researchers and participants bring to the experiment a myriad of characteristics, some learned and others inherent. For example, sex, weight, hair, eye, and skin color, personality, mental capabilities, and physical abilities, but also attitudes like motivation or willingness to participate.

During the selection step of the research study, if an unequal number of test subjects have similar subject-related variables there is a threat to the internal validity. For example, a researcher created two test groups, the experimental and the control groups. The subjects in both groups are not alike with regard to the independent variable but similar in one or more of the subject-related variables.

Self-selection also has a negative effect on the interpretive power of the dependent variable. This occurs often in online surveys where individuals of specific demographics opt into the test at higher rates than other demographics.

History

Events outside of the study/experiment or between repeated measures of the dependent variable may affect participants' responses to experimental procedures. Often, these are large-scale events (natural disaster, political change, etc.) that affect participants' attitudes and behaviors such that it becomes impossible to determine whether any change on the dependent measures is due to the independent variable, or the historical event.

Maturation

Subjects change during the course of the experiment or even between measurements. For example, young children might mature and their ability to concentrate may change as they grow up. Both permanent changes, such as physical growth and temporary ones like fatigue, provide "natural" alternative explanations; thus, they may change the way a subject would react to the independent variable. So upon completion of the study, the researcher may not be able to determine if the cause of the discrepancy is due to time or the independent variable.

Repeated testing (also referred to as testing effects)

Repeatedly measuring the participants may lead to bias. Participants may remember the correct answers or may be conditioned to know that they are being tested. Repeatedly taking (the same or similar) intelligence tests usually leads to score gains, but instead of concluding that the underlying skills have changed for good, this threat to Internal Validity provides a good rival hypothesis.

Instrument change (instrumentality)

The instrument used during the testing process can change the experiment. This also refers to observers being more concentrated or primed, or having unconsciously changed the criteria they use to make judgments. This can also be an issue with self-report measures given at different times. In this case, the impact may be mitigated through the use of retrospective pretesting. If any instrumentation changes occur, the internal validity of the main conclusion is affected, as alternative explanations are readily available.

Regression toward the mean

This type of error occurs when subjects are selected on the basis of extreme scores (one far away from the mean) during a test. For example, when children with the worst reading scores are selected to participate in a reading course, improvements at the end of the course might be due to regression toward the mean and not the course's effectiveness. If the children had been tested again before the course started, they would likely have obtained better scores anyway. Likewise, extreme outliers on individual scores are more likely to be captured in one instance of testing but will likely evolve into a more normal distribution with repeated testing.

Mortality/differential attrition

This error occurs if inferences are made on the basis of only those participants that have participated from the start to the end. However, participants may have dropped out of the study before completion, and maybe even due to the study or programme or experiment itself. For example, the percentage of group members having quit smoking at post-test was found much higher in a group having received a quit-smoking training program than in the control group. However, in the experimental group only 60% have completed the program. If this attrition is systematically related to any feature of the study, the administration of the independent variable, the instrumentation, or if dropping out leads to relevant bias between groups, a whole class of alternative explanations is possible that account for the observed differences.

Selection-maturation interaction

This occurs when the subject-related variables, color of hair, skin color, etc., and the time-related variables, age, physical size, etc., interact. If a discrepancy between the two groups occurs between the testing, the discrepancy may be due to the age differences in the age categories.

Diffusion

If treatment effects spread from treatment groups to control groups, a lack of differences between experimental and control groups may be observed. This does not mean, however, that the independent variable has no effect or that there is no relationship between dependent and independent variable.

Compensatory rivalry/resentful demoralization

Behavior in the control groups may alter as a result of the study. For example, control group members may work extra hard to see that the expected superiority of the experimental group is not demonstrated. Again, this does not mean that the independent variable produced no effect or that there is no relationship between dependent and independent variable. Vice versa, changes in the dependent variable may only be affected due to a demoralized control group, working less hard or motivated, not due to the independent variable.

Experimenter bias

Experimenter bias occurs when the individuals who are conducting an experiment inadvertently affect the outcome by non-consciously behaving in different ways to members of control and experimental groups. It is possible to eliminate the possibility of experimenter bias through the use of double-blind study designs, in which the experimenter is not aware of the condition to which a participant belongs.

Mutual-internal-validity problem

Experiments that have high internal validity can produce phenomena and results that have no relevance in real life, resulting in the mutual-internal-validity problem. It arises when researchers use experimental results to develop theories and then use those theories to design theory-testing experiments. This mutual feedback between experiments and theories can lead to theories that explain only phenomena and results in artificial laboratory settings but not in real life.

Moon

From Wikipedia, the free encyclopedia https://en.wikipedia.org/wiki/Moon   Near side of the Moon , lunar ...