Search This Blog

Sunday, June 16, 2024

Genetic linkage

From Wikipedia, the free encyclopedia
https://en.wikipedia.org/wiki/Genetic_linkage

Genetic linkage is the tendency of DNA sequences that are close together on a chromosome to be inherited together during the meiosis phase of sexual reproduction. Two genetic markers that are physically near to each other are unlikely to be separated onto different chromatids during chromosomal crossover, and are therefore said to be more linked than markers that are far apart. In other words, the nearer two genes are on a chromosome, the lower the chance of recombination between them, and the more likely they are to be inherited together. Markers on different chromosomes are perfectly unlinked, although the penetrance of potentially deleterious alleles may be influenced by the presence of other alleles, and these other alleles may be located on other chromosomes than that on which a particular potentially deleterious allele is located.

Genetic linkage is the most prominent exception to Gregor Mendel's Law of Independent Assortment. The first experiment to demonstrate linkage was carried out in 1905. At the time, the reason why certain traits tend to be inherited together was unknown. Later work revealed that genes are physical structures related by physical distance.

The typical unit of genetic linkage is the centimorgan (cM). A distance of 1 cM between two markers means that the markers are separated to different chromosomes on average once per 100 meiotic product, thus once per 50 meioses.

Discovery

Gregor Mendel's Law of Independent Assortment states that every trait is inherited independently of every other trait. But shortly after Mendel's work was rediscovered, exceptions to this rule were found. In 1905, the British geneticists William Bateson, Edith Rebecca Saunders and Reginald Punnett cross-bred pea plants in experiments similar to Mendel's. They were interested in trait inheritance in the sweet pea and were studying two genes—the gene for flower colour (P, purple, and p, red) and the gene affecting the shape of pollen grains (L, long, and l, round). They crossed the pure lines PPLL and ppll and then self-crossed the resulting PpLl lines.

According to Mendelian genetics, the expected phenotypes would occur in a 9:3:3:1 ratio of PL:Pl:pL:pl. To their surprise, they observed an increased frequency of PL and pl and a decreased frequency of Pl and pL:

Bateson, Saunders, and Punnett experiment
Phenotype and genotype Observed Expected from 9:3:3:1 ratio
Purple, long (P_L_) 284 216
Purple, round (P_ll) 21 72
Red, long (ppL_) 21 72
Red, round (ppll) 55 24

Their experiment revealed linkage between the P and L alleles and the p and l alleles. The frequency of P occurring together with L and p occurring together with l is greater than that of the recombinant Pl and pL. The recombination frequency is more difficult to compute in an F2 cross than a backcross, but the lack of fit between observed and expected numbers of progeny in the above table indicate it is less than 50%. This indicated that two factors interacted in some way to create this difference by masking the appearance of the other two phenotypes. This led to the conclusion that some traits are related to each other because of their near proximity to each other on a chromosome.

The understanding of linkage was expanded by the work of Thomas Hunt Morgan. Morgan's observation that the amount of crossing over between linked genes differs led to the idea that crossover frequency might indicate the distance separating genes on the chromosome. The centimorgan, which expresses the frequency of crossing over, is named in his honour.

Linkage map
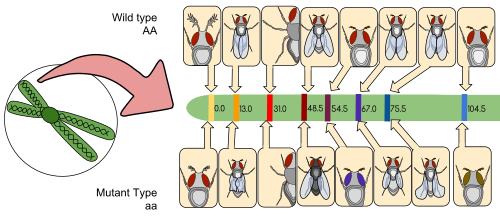
Thomas Hunt Morgan's Drosophila melanogaster genetic linkage map. This was the first successful gene mapping work and provides important evidence for the chromosome theory of inheritance. The map shows the relative positions of alleles on the second Drosophila chromosome. The distances between the genes (centimorgans) are equal to the percentages of chromosomal crossover events that occur between different alleles.

A linkage map (also known as a genetic map) is a table for a species or experimental population that shows the position of its known genes or genetic markers relative to each other in terms of recombination frequency, rather than a specific physical distance along each chromosome. Linkage maps were first developed by Alfred Sturtevant, a student of Thomas Hunt Morgan.

A linkage map is a map based on the frequencies of recombination between markers during crossover of homologous chromosomes. The greater the frequency of recombination (segregation) between two genetic markers, the further apart they are assumed to be. Conversely, the lower the frequency of recombination between the markers, the smaller the physical distance between them. Historically, the markers originally used were detectable phenotypes (enzyme production, eye colour) derived from coding DNA sequences; eventually, confirmed or assumed noncoding DNA sequences such as microsatellites or those generating restriction fragment length polymorphisms (RFLPs) have been used.

Linkage maps help researchers to locate other markers, such as other genes by testing for genetic linkage of the already known markers. In the early stages of developing a linkage map, the data are used to assemble linkage groups, a set of genes which are known to be linked. As knowledge advances, more markers can be added to a group, until the group covers an entire chromosome. For well-studied organisms the linkage groups correspond one-to-one with the chromosomes.

A linkage map is not a physical map (such as a radiation reduced hybrid map) or gene map.

Linkage analysis

Linkage analysis is a genetic method that searches for chromosomal segments that cosegregate with the ailment phenotype through families. It can be used to map genes for both binary and quantitative traits. Linkage analysis may be either parametric (if we know the relationship between phenotypic and genetic similarity) or non-parametric. Parametric linkage analysis is the traditional approach, whereby the probability that a gene important for a disease is linked to a genetic marker is studied through the LOD score, which assesses the probability that a given pedigree, where the disease and the marker are cosegregating, is due to the existence of linkage (with a given linkage value) or to chance. Non-parametric linkage analysis, in turn, studies the probability of an allele being identical by descent with itself.

Pedigree illustrating Parametric Linkage Analysis

Parametric linkage analysis

The LOD score (logarithm (base 10) of odds), developed by Newton Morton, is a statistical test often used for linkage analysis in human, animal, and plant populations. The LOD score compares the likelihood of obtaining the test data if the two loci are indeed linked, to the likelihood of observing the same data purely by chance. Positive LOD scores favour the presence of linkage, whereas negative LOD scores indicate that linkage is less likely. Computerised LOD score analysis is a simple way to analyse complex family pedigrees in order to determine the linkage between Mendelian traits (or between a trait and a marker, or two markers).

The method is described in greater detail by Strachan and Read. Briefly, it works as follows:

  1. Establish a pedigree
  2. Make a number of estimates of recombination frequency
  3. Calculate a LOD score for each estimate
  4. The estimate with the highest LOD score will be considered the best estimate

The LOD score is calculated as follows:

NR denotes the number of non-recombinant offspring, and R denotes the number of recombinant offspring. The reason 0.5 is used in the denominator is that any alleles that are completely unlinked (e.g. alleles on separate chromosomes) have a 50% chance of recombination, due to independent assortment. θ is the recombinant fraction, i.e. the fraction of births in which recombination has happened between the studied genetic marker and the putative gene associated with the disease. Thus, it is equal to R / (NR + R).

By convention, a LOD score greater than 3.0 is considered evidence for linkage, as it indicates 1000 to 1 odds that the linkage being observed did not occur by chance. On the other hand, a LOD score less than −2.0 is considered evidence to exclude linkage. Although it is very unlikely that a LOD score of 3 would be obtained from a single pedigree, the mathematical properties of the test allow data from a number of pedigrees to be combined by summing their LOD scores. A LOD score of 3 translates to a p-value of approximately 0.05, and no multiple testing correction (e.g. Bonferroni correction) is required.

Limitations

Linkage analysis has a number of methodological and theoretical limitations that can significantly increase the type-1 error rate and reduce the power to map human quantitative trait loci (QTL). While linkage analysis was successfully used to identify genetic variants that contribute to rare disorders such as Huntington disease, it did not perform that well when applied to more common disorders such as heart disease or different forms of cancer. An explanation for this is that the genetic mechanisms affecting common disorders are different from those causing some rare disorders.

Recombination frequency

Recombination frequency is a measure of genetic linkage and is used in the creation of a genetic linkage map. Recombination frequency (θ) is the frequency with which a single chromosomal crossover will take place between two genes during meiosis. A centimorgan (cM) is a unit that describes a recombination frequency of 1%. In this way we can measure the genetic distance between two loci, based upon their recombination frequency. This is a good estimate of the real distance. Double crossovers would turn into no recombination. In this case we cannot tell if crossovers took place. If the loci we're analysing are very close (less than 7 cM) a double crossover is very unlikely. When distances become higher, the likelihood of a double crossover increases. As the likelihood of a double crossover increases one could systematically underestimate the genetic distance between two loci, unless one used an appropriate mathematical model.

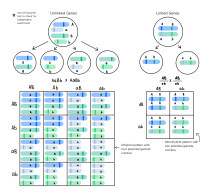
During meiosis, chromosomes assort randomly into gametes, such that the segregation of alleles of one gene is independent of alleles of another gene. This is stated in Mendel's Second Law and is known as the law of independent assortment. The law of independent assortment always holds true for genes that are located on different chromosomes, but for genes that are on the same chromosome, it does not always hold true.

As an example of independent assortment, consider the crossing of the pure-bred homozygote parental strain with genotype AABB with a different pure-bred strain with genotype aabb. A and a and B and b represent the alleles of genes A and B. Crossing these homozygous parental strains will result in F1 generation offspring that are double heterozygotes with genotype AaBb. The F1 offspring AaBb produces gametes that are AB, Ab, aB, and ab with equal frequencies (25%) because the alleles of gene A assort independently of the alleles for gene B during meiosis. Note that 2 of the 4 gametes (50%)—Ab and aB—were not present in the parental generation. These gametes represent recombinant gametes. Recombinant gametes are those gametes that differ from both of the haploid gametes that made up the original diploid cell. In this example, the recombination frequency is 50% since 2 of the 4 gametes were recombinant gametes.

The recombination frequency will be 50% when two genes are located on different chromosomes or when they are widely separated on the same chromosome. This is a consequence of independent assortment.

When two genes are close together on the same chromosome, they do not assort independently and are said to be linked. Whereas genes located on different chromosomes assort independently and have a recombination frequency of 50%, linked genes have a recombination frequency that is less than 50%.

As an example of linkage, consider the classic experiment by William Bateson and Reginald Punnett. They were interested in trait inheritance in the sweet pea and were studying two genes—the gene for flower colour (P, purple, and p, red) and the gene affecting the shape of pollen grains (L, long, and l, round). They crossed the pure lines PPLL and ppll and then self-crossed the resulting PpLl lines. According to Mendelian genetics, the expected phenotypes would occur in a 9:3:3:1 ratio of PL:Pl:pL:pl. To their surprise, they observed an increased frequency of PL and pl and a decreased frequency of Pl and pL (see table below).

Bateson and Punnett experiment
Phenotype and genotype Observed Expected from 9:3:3:1 ratio
Purple, long (P_L_) 284 216
Purple, round (P_ll) 21 72
Red, long (ppL_) 21 72
Red, round (ppll) 55 24
Unlinked Genes vs. Linked Genes

Their experiment revealed linkage between the P and L alleles and the p and l alleles. The frequency of P occurring together with L and with p occurring together with l is greater than that of the recombinant Pl and pL. The recombination frequency is more difficult to compute in an F2 cross than a backcross, but the lack of fit between observed and expected numbers of progeny in the above table indicate it is less than 50%.

The progeny in this case received two dominant alleles linked on one chromosome (referred to as coupling or cis arrangement). However, after crossover, some progeny could have received one parental chromosome with a dominant allele for one trait (e.g. Purple) linked to a recessive allele for a second trait (e.g. round) with the opposite being true for the other parental chromosome (e.g. red and Long). This is referred to as repulsion or a trans arrangement. The phenotype here would still be purple and long but a test cross of this individual with the recessive parent would produce progeny with much greater proportion of the two crossover phenotypes. While such a problem may not seem likely from this example, unfavourable repulsion linkages do appear when breeding for disease resistance in some crops.

The two possible arrangements, cis and trans, of alleles in a double heterozygote are referred to as gametic phases, and phasing is the process of determining which of the two is present in a given individual.

When two genes are located on the same chromosome, the chance of a crossover producing recombination between the genes is related to the distance between the two genes. Thus, the use of recombination frequencies has been used to develop linkage maps or genetic maps.

However, it is important to note that recombination frequency tends to underestimate the distance between two linked genes. This is because as the two genes are located farther apart, the chance of double or even number of crossovers between them also increases. Double or even number of crossovers between the two genes results in them being cosegregated to the same gamete, yielding a parental progeny instead of the expected recombinant progeny. As mentioned above, the Kosambi and Haldane transformations attempt to correct for multiple crossovers.

Linkage of genetic sites within a gene

In the early 1950s the prevailing view was that the genes in a chromosome are discrete entities, indivisible by genetic recombination and arranged like beads on a string. During 1955 to 1959, Benzer performed genetic recombination experiments using rII mutants of bacteriophage T4. He found that, on the basis of recombination tests, the sites of mutation could be mapped in a linear order. This result provided evidence for the key idea that the gene has a linear structure equivalent to a length of DNA with many sites that can independently mutate.

Edgar et al. performed mapping experiments with r mutants of bacteriophage T4 showing that recombination frequencies between rII mutants are not strictly additive. The recombination frequency from a cross of two rII mutants (a x d) is usually less than the sum of recombination frequencies for adjacent internal sub-intervals (a x b) + (b x c) + (c x d). Although not strictly additive, a systematic relationship was observed that likely reflects the underlying molecular mechanism of genetic recombination.

Variation of recombination frequency

While recombination of chromosomes is an essential process during meiosis, there is a large range of frequency of cross overs across organisms and within species. Sexually dimorphic rates of recombination are termed heterochiasmy, and are observed more often than a common rate between male and females. In mammals, females often have a higher rate of recombination compared to males. It is theorised that there are unique selections acting or meiotic drivers which influence the difference in rates. The difference in rates may also reflect the vastly different environments and conditions of meiosis in oogenesis and spermatogenesis.

Genes affecting recombination frequency

Mutations in genes that encode proteins involved in the processing of DNA often affect recombination frequency. In bacteriophage T4, mutations that reduce expression of the replicative DNA polymerase [gene product 43 (gp43)] increase recombination (decrease linkage) several fold. The increase in recombination may be due to replication errors by the defective DNA polymerase that are themselves recombination events such as template switches, i.e. copy choice recombination events. Recombination is also increased by mutations that reduce the expression of DNA ligase (gp30) and dCMP hydroxymethylase (gp42), two enzymes employed in DNA synthesis.

Recombination is reduced (linkage increased) by mutations in genes that encode proteins with nuclease functions (gp46 and gp47) and a DNA-binding protein (gp32) Mutation in the bacteriophage uvsX gene also substantially reduces recombination. The uvsX gene is analogous to the well studied recA gene of Escherichia coli that plays a central role in recombination.

Meiosis indicators

With very large pedigrees or with very dense genetic marker data, such as from whole-genome sequencing, it is possible to precisely locate recombinations. With this type of genetic analysis, a meiosis indicator is assigned to each position of the genome for each meiosis in a pedigree. The indicator indicates which copy of the parental chromosome contributes to the transmitted gamete at that position. For example, if the allele from the 'first' copy of the parental chromosome is transmitted, a '0' might be assigned to that meiosis. If the allele from the 'second' copy of the parental chromosome is transmitted, a '1' would be assigned to that meiosis. The two alleles in the parent came, one each, from two grandparents. These indicators are then used to determine identical-by-descent (IBD) states or inheritance states, which are in turn used to identify genes responsible for diseases.

Synthetic lethality

From Wikipedia, the free encyclopedia

Synthetic lethality is defined as a type of genetic interaction where the combination of two genetic events results in cell death or death of an organism. Although the foregoing explanation is wider than this, it is common when referring to synthetic lethality to mean the situation arising by virtue of a combination of deficiencies of two or more genes leading to cell death (whether by means of apoptosis or otherwise), whereas a deficiency of only one of these genes does not. In a synthetic lethal genetic screen, it is necessary to begin with a mutation that does not result in cell death, although the effect of that mutation could result in a differing phenotype (slow growth for example), and then systematically test other mutations at additional loci to determine which, in combination with the first mutation, causes cell death arising by way of deficiency or abolition of expression.

Synthetic lethality has utility for purposes of molecular targeted cancer therapy. The first example of a molecular targeted therapeutic agent, which exploited a synthetic lethal approach, arose by means of an inactivated tumor suppressor gene (BRCA1 and 2), a treatment which received FDA approval in 2016 (PARP inhibitor). A sub-case of synthetic lethality, where vulnerabilities are exposed by the deletion of passenger genes rather than tumor suppressor is the so-called "collateral lethality".

Background

Schematic of basic synthetic lethality. Simultaneous mutations in gene pair confer lethality while any other combination of mutations is viable.

The phenomenon of synthetic lethality was first described by Calvin Bridges in 1922, who noticed that some combinations of mutations in the model organism Drosophila melanogaster (the common fruit fly) confer lethality. Theodore Dobzhansky coined the term "synthetic lethality" in 1946 to describe the same type of genetic interaction in wildtype populations of Drosophila. If the combination of genetic events results in a non-lethal reduction in fitness, the interaction is called synthetic sickness. Although in classical genetics the term synthetic lethality refers to the interaction between two genetic perturbations, synthetic lethality can also apply to cases in which the combination of a mutation and the action of a chemical compound causes lethality, whereas the mutation or compound alone are non-lethal.

Synthetic lethality is a consequence of the tendency of organisms to maintain buffering schemes (i.e. backup plans) which engender phenotypic stability notwithstanding underlying genetic variations, environmental changes or other random events, such as mutations. This genetic robustness is the result of parallel redundant pathways and "capacitor" proteins that camouflage the effects of mutations so that important cellular processes do not depend on any individual component. Synthetic lethality can help identify these buffering relationships, and what type of disease or malfunction that may occur when these relationships break down, through the identification of gene interactions that function in either the same biochemical process or pathways that appear to be unrelated.

High-throughput screens

High-throughput synthetic lethal screens may help illuminate questions about how cellular processes work without previous knowledge of gene function or interaction. Screening strategy must take into account the organism used for screening, the mode of genetic perturbation, and whether the screen is forward or reverse. Many of the first synthetic lethal screens were performed in Saccharomyces cerevisiae. Budding yeast has many experimental advantages in screens, including a small genome, fast doubling time, both haploid and diploid states, and ease of genetic manipulation. Gene ablation can be performed using a PCR-based strategy and complete libraries of knockout collections for all annotated yeast genes are publicly available. Synthetic genetic array (SGA), synthetic lethality by microarray (SLAM), and genetic interaction mapping (GIM) are three high-throughput methods for analyzing synthetic lethality in yeast. A genome scale genetic interaction map was created by SGA analysis in S. cerevisiae that comprises about 75% of all yeast genes.

Collateral lethality

Collateral lethality is a sub-case of synthetic lethality in personalized cancer therapy, where vulnerabilities are exposed by the deletion of passenger genes rather than tumor suppressor genes, which are deleted by virtue of chromosomal proximity to major deleted tumor suppressor loci.

DDR deficiencies

DNA mismatch repair deficiency

Mutations in genes employed in DNA mismatch repair (MMR) cause a high mutation rate. In tumors, such frequent subsequent mutations often generate "non-self" immunogenic antigens. A human Phase II clinical trial, with 41 patients, evaluated one synthetic lethal approach for tumors with or without MMR defects. In the case of sporadic tumors evaluated, the majority would be deficient in MMR due to epigenetic repression of an MMR gene (see DNA mismatch repair). The product of gene PD-1 ordinarily represses cytotoxic immune responses. Inhibition of this gene allows a greater immune response. In this Phase II clinical trial with 47 patients, when cancer patients with a defect in MMR in their tumors were exposed to an inhibitor of PD-1, 67% - 78% of patients experienced immune-related progression-free survival. In contrast, for patients without defective MMR, addition of PD-1 inhibitor generated only 11% of patients with immune-related progression-free survival. Thus inhibition of PD-1 is primarily synthetically lethal with MMR defects.

Werner syndrome gene deficiency

The analysis of 630 human primary tumors in 11 tissues shows that WRN promoter hypermethylation (with loss of expression of WRN protein) is a common event in tumorigenesis. The WRN gene promoter is hypermethylated in about 38% of colorectal cancers and non-small-cell lung carcinomas and in about 20% or so of stomach cancers, prostate cancers, breast cancers, non-Hodgkin lymphomas and chondrosarcomas, plus at significant levels in the other cancers evaluated. The WRN helicase protein is important in homologous recombinational DNA repair and also has roles in non-homologous end joining DNA repair and base excision DNA repair.

Topoisomerase inhibitors are frequently used as chemotherapy for different cancers, though they cause bone marrow suppression, are cardiotoxic and have variable effectiveness. A 2006 retrospective study, with long clinical follow-up, was made of colon cancer patients treated with the topoisomerase inhibitor irinotecan. In this study, 45 patients had hypermethylated WRN gene promoters and 43 patients had unmethylated WRN gene promoters. Irinitecan was more strongly beneficial for patients with hypermethylated WRN promoters (39.4 months survival) than for those with unmethylated WRN promoters (20.7 months survival). Thus, a topoisomerase inhibitor appeared to be synthetically lethal with deficient expression of WRN. Further evaluations have also indicated synthetic lethality of deficient expression of WRN and topoisomerase inhibitors.

Clinical and preclinical PARP1 inhibitor synthetic lethality

As reviewed by Murata et al., five different PARP1 inhibitors are now undergoing Phase I, II and III clinical trials, to determine if particular PARP1 inhibitors are synthetically lethal in a large variety of cancers, including those in the prostate, pancreas, non-small-cell lung tumors, lymphoma, multiple myeloma, and Ewing sarcoma. In addition, in preclinical studies using cells in culture or within mice, PARP1 inhibitors are being tested for synthetic lethality against epigenetic and mutational deficiencies in about 20 DNA repair defects beyond BRCA1/2 deficiencies. These include deficiencies in PALB2, FANCD2, RAD51, ATM, MRE11, p53, XRCC1 and LSD1.

Preclinical ARID1A synthetic lethality

ARID1A, a chromatin modifier, is required for non-homologous end joining, a major pathway that repairs double-strand breaks in DNA, and also has transcription regulatory roles. ARID1A mutations are one of the 12 most common carcinogenic mutations. Mutation or epigenetically decreased expression of ARID1A has been found in 17 types of cancer. Pre-clinical studies in cells and in mice show that synthetic lethality for deficient ARID1A expression occurs by either inhibition of the methyltransferase activity of EZH2, by inhibition of the DNA repair kinase ATR, or by exposure to the kinase inhibitor dasatinib.

Preclinical RAD52 synthetic lethality

There are two pathways for homologous recombinational repair of double-strand breaks. The major pathway depends on BRCA1, PALB2 and BRCA2 while an alternative pathway depends on RAD52. Pre-clinical studies, involving epigenetically reduced or mutated BRCA-deficient cells (in culture or injected into mice), show that inhibition of RAD52 is synthetically lethal with BRCA-deficiency.

Side effects

Although treatments using synthetic lethality can stop or slow progression of cancers and prolong survival, each of the synthetic lethal treatments has some adverse side effects. For example, more than 20% of patients treated with an inhibitor of PD-1 encounter fatigue, rash, pruritus, cough, diarrhea, decreased appetite, constipation or arthralgia. Thus, it is important to determine which DDR deficiency is present, so that only an effective synthetic lethal treatment can be applied, and not unnecessarily subject patients to adverse side effects without a direct benefit.

Epistasis

From Wikipedia, the free encyclopedia
https://en.wikipedia.org/wiki/Epistasis
An example of epistasis is the interaction between hair colour and baldness. A gene for total baldness would be epistatic to one for blond hair or red hair. The hair-colour genes are hypostatic to the baldness gene. The baldness phenotype supersedes genes for hair colour, and so the effects are non-additive.
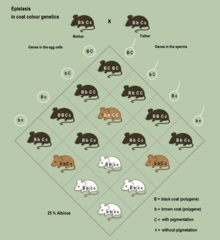
Example of epistasis in coat colour genetics: If no pigments can be produced the other coat colour genes have no effect on the phenotype, no matter if they are dominant or if the individual is homozygous. Here the genotype "c c" for no pigmentation is epistatic over the other genes.

Epistasis is a phenomenon in genetics in which the effect of a gene mutation is dependent on the presence or absence of mutations in one or more other genes, respectively termed modifier genes. In other words, the effect of the mutation is dependent on the genetic background in which it appears. Epistatic mutations therefore have different effects on their own than when they occur together. Originally, the term epistasis specifically meant that the effect of a gene variant is masked by that of different gene.

The concept of epistasis originated in genetics in 1907 but is now used in biochemistry, computational biology and evolutionary biology. The phenomenon arises due to interactions, either between genes (such as mutations also being needed in regulators of gene expression) or within them (multiple mutations being needed before the gene loses function), leading to non-linear effects. Epistasis has a great influence on the shape of evolutionary landscapes, which leads to profound consequences for evolution and for the evolvability of phenotypic traits.

History

Understanding of epistasis has changed considerably through the history of genetics and so too has the use of the term. The term was first used by William Bateson and his collaborators Florence Durham and Muriel Wheldale Onslow. In early models of natural selection devised in the early 20th century, each gene was considered to make its own characteristic contribution to fitness, against an average background of other genes. Some introductory courses still teach population genetics this way. Because of the way that the science of population genetics was developed, evolutionary geneticists have tended to think of epistasis as the exception. However, in general, the expression of any one allele depends in a complicated way on many other alleles.

In classical genetics, if genes A and B are mutated, and each mutation by itself produces a unique phenotype but the two mutations together show the same phenotype as the gene A mutation, then gene A is epistatic and gene B is hypostatic. For example, the gene for total baldness is epistatic to the gene for brown hair. In this sense, epistasis can be contrasted with genetic dominance, which is an interaction between alleles at the same gene locus. As the study of genetics developed, and with the advent of molecular biology, epistasis started to be studied in relation to quantitative trait loci (QTL) and polygenic inheritance.

The effects of genes are now commonly quantifiable by assaying the magnitude of a phenotype (e.g. height, pigmentation or growth rate) or by biochemically assaying protein activity (e.g. binding or catalysis). Increasingly sophisticated computational and evolutionary biology models aim to describe the effects of epistasis on a genome-wide scale and the consequences of this for evolution. Since identification of epistatic pairs is challenging both computationally and statistically, some studies try to prioritize epistatic pairs.

Classification

Quantitative trait values after two mutations either alone (Ab and aB) or in combination (AB). Bars contained in the grey box indicate the combined trait value under different circumstances of epistasis. Upper panel indicates epistasis between beneficial mutations (blue). Lower panel indicates epistasis between deleterious mutations (red).
Since, on average, mutations are deleterious, random mutations to an organism cause a decline in fitness. If all mutations are additive, fitness will fall proportionally to mutation number (black line). When deleterious mutations display negative (synergistic) epistasis, they are more deleterious in combination than individually and so fitness falls with the number of mutations at an increasing rate (upper, red line). When mutations display positive (antagonistic) epistasis, effects of mutations are less severe in combination than individually and so fitness falls at a decreasing rate (lower, blue line).

Terminology about epistasis can vary between scientific fields. Geneticists often refer to wild type and mutant alleles where the mutation is implicitly deleterious and may talk in terms of genetic enhancement, synthetic lethality and genetic suppressors. Conversely, a biochemist may more frequently focus on beneficial mutations and so explicitly state the effect of a mutation and use terms such as reciprocal sign epistasis and compensatory mutation. Additionally, there are differences when looking at epistasis within a single gene (biochemistry) and epistasis within a haploid or diploid genome (genetics). In general, epistasis is used to denote the departure from 'independence' of the effects of different genetic loci. Confusion often arises due to the varied interpretation of 'independence' among different branches of biology. The classifications below attempt to cover the various terms and how they relate to one another.

Additivity

Two mutations are considered to be purely additive if the effect of the double mutation is the sum of the effects of the single mutations. This occurs when genes do not interact with each other, for example by acting through different metabolic pathways. Simply, additive traits were studied early on in the history of genetics, however they are relatively rare, with most genes exhibiting at least some level of epistatic interaction.

Magnitude epistasis

When the double mutation has a fitter phenotype than expected from the effects of the two single mutations, it is referred to as positive epistasis. Positive epistasis between beneficial mutations generates greater improvements in function than expected. Positive epistasis between deleterious mutations protects against the negative effects to cause a less severe fitness drop.

Conversely, when two mutations together lead to a less fit phenotype than expected from their effects when alone, it is called negative epistasis. Negative epistasis between beneficial mutations causes smaller than expected fitness improvements, whereas negative epistasis between deleterious mutations causes greater-than-additive fitness drops.

Independently, when the effect on fitness of two mutations is more radical than expected from their effects when alone, it is referred to as synergistic epistasis. The opposite situation, when the fitness difference of the double mutant from the wild type is smaller than expected from the effects of the two single mutations, it is called antagonistic epistasis. Therefore, for deleterious mutations, negative epistasis is also synergistic, while positive epistasis is antagonistic; conversely, for advantageous mutations, positive epistasis is synergistic, while negative epistasis is antagonistic.

The term genetic enhancement is sometimes used when a double (deleterious) mutant has a more severe phenotype than the additive effects of the single mutants. Strong positive epistasis is sometimes referred to by creationists as irreducible complexity (although most examples are misidentified).

Sign epistasis

Sign epistasis occurs when one mutation has the opposite effect when in the presence of another mutation. This occurs when a mutation that is deleterious on its own can enhance the effect of a particular beneficial mutation. For example, a large and complex brain is a waste of energy without a range of sense organs, but sense organs are made more useful by a large and complex brain that can better process the information. If a fitness landscape has no sign epistasis then it is called smooth.

At its most extreme, reciprocal sign epistasis occurs when two deleterious genes are beneficial when together. For example, producing a toxin alone can kill a bacterium, and producing a toxin exporter alone can waste energy, but producing both can improve fitness by killing competing organisms. If a fitness landscape has sign epistasis but no reciprocal sign epistasis then it is called semismooth.

Reciprocal sign epistasis also leads to genetic suppression whereby two deleterious mutations are less harmful together than either one on its own, i.e. one compensates for the other. A clear example of genetic suppression was the demonstration that in the assembly of bacteriophage T4 two deleterious mutations, each causing a deficiency in the level of a different morphogenetic protein, could interact positively. If a mutation causes a reduction in a particular structural component, this can bring about an imbalance in morphogenesis and loss of viable virus progeny, but production of viable progeny can be restored by a second (suppressor) mutation in another morphogenetic component that restores the balance of protein components.

The term genetic suppression can also apply to sign epistasis where the double mutant has a phenotype intermediate between those of the single mutants, in which case the more severe single mutant phenotype is suppressed by the other mutation or genetic condition. For example, in a diploid organism, a hypomorphic (or partial loss-of-function) mutant phenotype can be suppressed by knocking out one copy of a gene that acts oppositely in the same pathway. In this case, the second gene is described as a "dominant suppressor" of the hypomorphic mutant; "dominant" because the effect is seen when one wild-type copy of the suppressor gene is present (i.e. even in a heterozygote). For most genes, the phenotype of the heterozygous suppressor mutation by itself would be wild type (because most genes are not haplo-insufficient), so that the double mutant (suppressed) phenotype is intermediate between those of the single mutants.

In non reciprocal sign epistasis, fitness of the mutant lies in the middle of that of the extreme effects seen in reciprocal sign epistasis.

When two mutations are viable alone but lethal in combination, it is called Synthetic lethality or unlinked non-complementation.

Haploid organisms

In a haploid organism with genotypes (at two loci) ab, Ab, aB or AB, we can think of different forms of epistasis as affecting the magnitude of a phenotype upon mutation individually (Ab and aB) or in combination (AB).

Interaction type ab Ab aB AB
No epistasis (additive)  0 1 1 2 AB = Ab + aB + ab 
Positive (synergistic) epistasis 0 1 1 3 AB > Ab + aB + ab 
Negative (antagonistic) epistasis 0 1 1 1 AB < Ab + aB + ab 
Sign epistasis 0 1 -1 2 AB has opposite sign to Ab or aB
Reciprocal sign epistasis 0 -1 -1 2 AB has opposite sign to Ab and aB

Diploid organisms

Epistasis in diploid organisms is further complicated by the presence of two copies of each gene. Epistasis can occur between loci, but additionally, interactions can occur between the two copies of each locus in heterozygotes. For a two locus, two allele system, there are eight independent types of gene interaction.

Additive A locus Additive B locus Dominance A locus Dominance B locus

aa aA AA

aa aA AA

aa aA AA

aa aA AA
bb 1 0 –1
bb 1 1 1
bb –1 1 –1
bb –1 –1 –1
bB 1 0 –1
bB 0 0 0
bB –1 1 –1
bB 1 1 1
BB 1 0 –1
BB –1 –1 –1
BB –1 1 –1
BB –1 –1 –1


Additive by Additive Epistasis Additive by Dominance Epistasis Dominance by Additive Epistasis Dominance by Dominance Epistasis

aa aA AA

aa aA AA

aa aA AA

aa aA AA
bb 1 0 –1
bb 1 0 –1
bb 1 –1 1
bb –1 1 –1
bB 0 0 0
bB –1 0 1
bB 0 0 0
bB 1 –1 1
BB –1 0 1
BB 1 0 –1
BB –1 1 –1
BB –1 1 –1

Genetic and molecular causes

Additivity

This can be the case when multiple genes act in parallel to achieve the same effect. For example, when an organism is in need of phosphorus, multiple enzymes that break down different phosphorylated components from the environment may act additively to increase the amount of phosphorus available to the organism. However, there inevitably comes a point where phosphorus is no longer the limiting factor for growth and reproduction and so further improvements in phosphorus metabolism have smaller or no effect (negative epistasis). Some sets of mutations within genes have also been specifically found to be additive. It is now considered that strict additivity is the exception, rather than the rule, since most genes interact with hundreds or thousands of other genes.

Epistasis between genes

Epistasis within the genomes of organisms occurs due to interactions between the genes within the genome. This interaction may be direct if the genes encode proteins that, for example, are separate components of a multi-component protein (such as the ribosome), inhibit each other's activity, or if the protein encoded by one gene modifies the other (such as by phosphorylation). Alternatively the interaction may be indirect, where the genes encode components of a metabolic pathway or network, developmental pathway, signalling pathway or transcription factor network. For example, the gene encoding the enzyme that synthesizes penicillin is of no use to a fungus without the enzymes that synthesize the necessary precursors in the metabolic pathway.

Epistasis within genes

Just as mutations in two separate genes can be non-additive if those genes interact, mutations in two codons within a gene can be non-additive. In genetics this is sometimes called intragenic suppression when one deleterious mutation can be compensated for by a second mutation within that gene. Analysis of bacteriophage T4 mutants that were altered in the rIIB cistron (gene) revealed that certain pairwise combinations of mutations could mutually suppress each other; that is the double mutants had a more nearly wild-type phenotype than either mutant alone. The linear map order of the mutants was established using genetic recombination data, From these sources of information, the triplet nature of the genetic code was logically deduced for the first time in 1961, and other key features of the code were also inferred.

Also intragenic suppression can occur when the amino acids within a protein interact. Due to the complexity of protein folding and activity, additive mutations are rare.

Proteins are held in their tertiary structure by a distributed, internal network of cooperative interactions (hydrophobic, polar and covalent). Epistatic interactions occur whenever one mutation alters the local environment of another residue (either by directly contacting it, or by inducing changes in the protein structure). For example, in a disulphide bridge, a single cysteine has no effect on protein stability until a second is present at the correct location at which point the two cysteines form a chemical bond which enhances the stability of the protein. This would be observed as positive epistasis where the double-cysteine variant had a much higher stability than either of the single-cysteine variants. Conversely, when deleterious mutations are introduced, proteins often exhibit mutational robustness whereby as stabilising interactions are destroyed the protein still functions until it reaches some stability threshold at which point further destabilising mutations have large, detrimental effects as the protein can no longer fold. This leads to negative epistasis whereby mutations that have little effect alone have a large, deleterious effect together.

In enzymes, the protein structure orients a few, key amino acids into precise geometries to form an active site to perform chemistry. Since these active site networks frequently require the cooperation of multiple components, mutating any one of these components massively compromises activity, and so mutating a second component has a relatively minor effect on the already inactivated enzyme. For example, removing any member of the catalytic triad of many enzymes will reduce activity to levels low enough that the organism is no longer viable.

Heterozygotic epistasis

Diploid organisms contain two copies of each gene. If these are different (heterozygous / heteroallelic), the two different copies of the allele may interact with each other to cause epistasis. This is sometimes called allelic complementation, or interallelic complementation. It may be caused by several mechanisms, for example transvection, where an enhancer from one allele acts in trans to activate transcription from the promoter of the second allele. Alternately, trans-splicing of two non-functional RNA molecules may produce a single, functional RNA.

Similarly, at the protein level, proteins that function as dimers may form a heterodimer composed of one protein from each alternate gene and may display different properties to the homodimer of one or both variants. Two bacteriophage T4 mutants defective at different locations in the same gene can undergo allelic complementation during a mixed infection. That is, each mutant alone upon infection cannot produce viable progeny, but upon mixed infection with two complementing mutants, viable phage are formed. Intragenic complementation was demonstrated for several genes that encode structural proteins of the bacteriophage indicating that such proteins function as dimers or even higher order multimers.

Evolutionary consequences

Fitness landscapes and evolvability

The top row indicates interactions between two genes that show either (a) additive effects, (b) positive epistasis or (c) reciprocal sign epistasis. Below are fitness landscapes which display greater and greater levels of global epistasis between large numbers of genes. Purely additive interactions lead to a single smooth peak (d); as increasing numbers of genes exhibit epistasis, the landscape becomes more rugged (e), and when all genes interact epistatically the landscape becomes so rugged that mutations have seemingly random effects (f).

In evolutionary genetics, the sign of epistasis is usually more significant than the magnitude of epistasis. This is because magnitude epistasis (positive and negative) simply affects how beneficial mutations are together, however sign epistasis affects whether mutation combinations are beneficial or deleterious.

A fitness landscape is a representation of the fitness where all genotypes are arranged in 2D space and the fitness of each genotype is represented by height on a surface. It is frequently used as a visual metaphor for understanding evolution as the process of moving uphill from one genotype to the next, nearby, fitter genotype.

If all mutations are additive, they can be acquired in any order and still give a continuous uphill trajectory. The landscape is perfectly smooth, with only one peak (global maximum) and all sequences can evolve uphill to it by the accumulation of beneficial mutations in any order. Conversely, if mutations interact with one another by epistasis, the fitness landscape becomes rugged as the effect of a mutation depends on the genetic background of other mutations. At its most extreme, interactions are so complex that the fitness is 'uncorrelated' with gene sequence and the topology of the landscape is random. This is referred to as a rugged fitness landscape and has profound implications for the evolutionary optimisation of organisms. If mutations are deleterious in one combination but beneficial in another, the fittest genotypes can only be accessed by accumulating mutations in one specific order. This makes it more likely that organisms will get stuck at local maxima in the fitness landscape having acquired mutations in the 'wrong' order. For example, a variant of TEM1 β-lactamase with 5 mutations is able to cleave cefotaxime (a third generation antibiotic). However, of the 120 possible pathways to this 5-mutant variant, only 7% are accessible to evolution as the remainder passed through fitness valleys where the combination of mutations reduces activity. In contrast, changes in environment (and therefore the shape of the fitness landscape) have been shown to provide escape from local maxima. In this example, selection in changing antibiotic environments resulted in a "gateway mutation" which epistatically interacted in a positive manner with other mutations along an evolutionary pathway, effectively crossing a fitness valley. This gateway mutation alleviated the negative epistatic interactions of other individually beneficial mutations, allowing them to better function in concert. Complex environments or selections may therefore bypass local maxima found in models assuming simple positive selection.

High epistasis is usually considered a constraining factor on evolution, and improvements in a highly epistatic trait are considered to have lower evolvability. This is because, in any given genetic background, very few mutations will be beneficial, even though many mutations may need to occur to eventually improve the trait. The lack of a smooth landscape makes it harder for evolution to access fitness peaks. In highly rugged landscapes, fitness valleys block access to some genes, and even if ridges exist that allow access, these may be rare or prohibitively long. Moreover, adaptation can move proteins into more precarious or rugged regions of the fitness landscape. These shifting "fitness territories" may act to decelerate evolution and could represent tradeoffs for adaptive traits.

The frustration of adaptive evolution by rugged fitness landscapes was recognized as a potential force for the evolution of evolvability. Michael Conrad in 1972 was the first to propose a mechanism for the evolution of evolvability by noting that a mutation which smoothed the fitness landscape at other loci could facilitate the production of advantageous mutations and hitchhike along with them. Rupert Riedl in 1975 proposed that new genes which produced the same phenotypic effects with a single mutation as other loci with reciprocal sign epistasis would be a new means to attain a phenotype otherwise too unlikely to occur by mutation.

Rugged, epistatic fitness landscapes also affect the trajectories of evolution. When a mutation has a large number of epistatic effects, each accumulated mutation drastically changes the set of available beneficial mutations. Therefore, the evolutionary trajectory followed depends highly on which early mutations were accepted. Thus, repeats of evolution from the same starting point tend to diverge to different local maxima rather than converge on a single global maximum as they would in a smooth, additive landscape.

Evolution of sex

Negative epistasis and sex are thought to be intimately correlated. Experimentally, this idea has been tested in using digital simulations of asexual and sexual populations. Over time, sexual populations move towards more negative epistasis, or the lowering of fitness by two interacting alleles. It is thought that negative epistasis allows individuals carrying the interacting deleterious mutations to be removed from the populations efficiently. This removes those alleles from the population, resulting in an overall more fit population. This hypothesis was proposed by Alexey Kondrashov, and is sometimes known as the deterministic mutation hypothesis and has also been tested using artificial gene networks.

However, the evidence for this hypothesis has not always been straightforward and the model proposed by Kondrashov has been criticized for assuming mutation parameters far from real world observations. In addition, in those tests which used artificial gene networks, negative epistasis is only found in more densely connected networks, whereas empirical evidence indicates that natural gene networks are sparsely connected, and theory shows that selection for robustness will favor more sparsely connected and minimally complex networks.

Methods and model systems

Regression analysis

Quantitative genetics focuses on genetic variance due to genetic interactions. Any two locus interactions at a particular gene frequency can be decomposed into eight independent genetic effects using a weighted regression. In this regression, the observed two locus genetic effects are treated as dependent variables and the "pure" genetic effects are used as the independent variables. Because the regression is weighted, the partitioning among the variance components will change as a function of gene frequency. By analogy it is possible to expand this system to three or more loci, or to cytonuclear interactions

Double mutant cycles

When assaying epistasis within a gene, site-directed mutagenesis can be used to generate the different genes, and their protein products can be assayed (e.g. for stability or catalytic activity). This is sometimes called a double mutant cycle and involves producing and assaying the wild type protein, the two single mutants and the double mutant. Epistasis is measured as the difference between the effects of the mutations together versus the sum of their individual effects. This can be expressed as a free energy of interaction. The same methodology can be used to investigate the interactions between larger sets of mutations but all combinations have to be produced and assayed. For example, there are 120 different combinations of 5 mutations, some or all of which may show epistasis...

Computational prediction

Numerous computational methods have been developed for the detection and characterization of epistasis. Many of these rely on machine learning to detect non-additive effects that might be missed by statistical approaches such as linear regression. For example, multifactor dimensionality reduction (MDR) was designed specifically for nonparametric and model-free detection of combinations of genetic variants that are predictive of a phenotype such as disease status in human populations. Several of these approaches have been broadly reviewed in the literature. Even more recently, methods that utilize insights from theoretical computer science (the Hadamard transform and compressed sensing) or maximum-likelihood inference were shown to distinguish epistatic effects from overall non-linearity in genotype–phenotype map structure, while others used patient survival analysis to identify non-linearity.

Waiting for Godot

From Wikipedia, the free encyclopedia https://en.wikipedia.org/wiki/Waiting_for_Godot   ...