Search This Blog

Friday, November 15, 2024

Geophysics

From Wikipedia, the free encyclopedia
https://en.wikipedia.org/wiki/Geophysics
false color image
Age of the sea floor. Much of the dating information comes from magnetic anomalies.
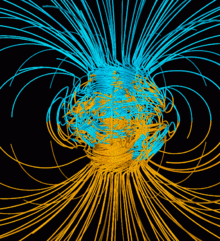
Computer simulation of the Earth's magnetic field in a period of normal polarity between reversals

Geophysics (/ˌˈfɪzɪks/) is a subject of natural science concerned with the physical processes and physical properties of the Earth and its surrounding space environment, and the use of quantitative methods for their analysis. Geophysicists, who usually study geophysics, physics, or one of the Earth sciences at the graduate level, complete investigations across a wide range of scientific disciplines. The term geophysics classically refers to solid earth applications: Earth's shape; its gravitational, magnetic fields, and electromagnetic fields ; its internal structure and composition; its dynamics and their surface expression in plate tectonics, the generation of magmas, volcanism and rock formation. However, modern geophysics organizations and pure scientists use a broader definition that includes the water cycle including snow and ice; fluid dynamics of the oceans and the atmosphere; electricity and magnetism in the ionosphere and magnetosphere and solar-terrestrial physics; and analogous problems associated with the Moon and other planets.

Although geophysics was only recognized as a separate discipline in the 19th century, its origins date back to ancient times. The first magnetic compasses were made from lodestones, while more modern magnetic compasses played an important role in the history of navigation. The first seismic instrument was built in 132 AD. Isaac Newton applied his theory of mechanics to the tides and the precession of the equinox; and instruments were developed to measure the Earth's shape, density and gravity field, as well as the components of the water cycle. In the 20th century, geophysical methods were developed for remote exploration of the solid Earth and the ocean, and geophysics played an essential role in the development of the theory of plate tectonics.

Geophysics is applied to societal needs, such as mineral resources, mitigation of natural hazards and environmental protection. In exploration geophysics, geophysical survey data are used to analyze potential petroleum reservoirs and mineral deposits, locate groundwater, find archaeological relics, determine the thickness of glaciers and soils, and assess sites for environmental remediation.

Physical phenomena

Geophysics is a highly interdisciplinary subject, and geophysicists contribute to every area of the Earth sciences, while some geophysicists conduct research in the planetary sciences. To provide a more clear idea on what constitutes geophysics, this section describes phenomena that are studied in physics and how they relate to the Earth and its surroundings. Geophysicists also investigate the physical processes and properties of the Earth, its fluid layers, and magnetic field along with the near-Earth environment in the Solar System, which includes other planetary bodies.

Gravity

Image of globe combining color with topography.
A map of deviations in gravity from a perfectly smooth, idealized Earth

The gravitational pull of the Moon and Sun gives rise to two high tides and two low tides every lunar day, or every 24 hours and 50 minutes. Therefore, there is a gap of 12 hours and 25 minutes between every high tide and between every low tide.

Gravitational forces make rocks press down on deeper rocks, increasing their density as the depth increases. Measurements of gravitational acceleration and gravitational potential at the Earth's surface and above it can be used to look for mineral deposits (see gravity anomaly and gravimetry). The surface gravitational field provides information on the dynamics of tectonic plates. The geopotential surface called the geoid is one definition of the shape of the Earth. The geoid would be the global mean sea level if the oceans were in equilibrium and could be extended through the continents (such as with very narrow canals).

Heat flow

Pseudocolor image in vertical profile.
A model of thermal convection in the Earth's mantle. The thin red columns are mantle plumes.

The Earth is cooling, and the resulting heat flow generates the Earth's magnetic field through the geodynamo and plate tectonics through mantle convection. The main sources of heat are: primordial heat due to Earth's cooling and radioactivity in the planets upper crust. There is also some contributions from phase transitions. Heat is mostly carried to the surface by thermal convection, although there are two thermal boundary layers – the core–mantle boundary and the lithosphere – in which heat is transported by conduction. Some heat is carried up from the bottom of the mantle by mantle plumes. The heat flow at the Earth's surface is about 4.2 × 10¹³ W, and it is a potential source of geothermal energy.

Vibrations

Deformed blocks with grids on surface.
Illustration of the deformations of a block by body waves and surface waves (see seismic wave)

Seismic waves are vibrations that travel through the Earth's interior or along its surface. The entire Earth can also oscillate in forms that are called normal modes or free oscillations of the Earth. Ground motions from waves or normal modes are measured using seismographs. If the waves come from a localized source such as an earthquake or explosion, measurements at more than one location can be used to locate the source. The locations of earthquakes provide information on plate tectonics and mantle convection.

Recording of seismic waves from controlled sources provides information on the region that the waves travel through. If the density or composition of the rock changes, waves are reflected. Reflections recorded using Reflection Seismology can provide a wealth of information on the structure of the earth up to several kilometers deep and are used to increase our understanding of the geology as well as to explore for oil and gas. Changes in the travel direction, called refraction, can be used to infer the deep structure of the Earth.

Earthquakes pose a risk to humans. Understanding their mechanisms, which depend on the type of earthquake (e.g., intraplate or deep focus), can lead to better estimates of earthquake risk and improvements in earthquake engineering.

Electricity

Although we mainly notice electricity during thunderstorms, there is always a downward electric field near the surface that averages 120 volts per meter. Relative to the solid Earth, the ionization of the planet's atmosphere is a result of the galactic cosmic rays penetrating it, which leaves it with a net positive charge. A current of about 1800 amperes flows in the global circuit. It flows downward from the ionosphere over most of the Earth and back upwards through thunderstorms. The flow is manifested by lightning below the clouds and sprites above.

A variety of electric methods are used in geophysical survey. Some measure spontaneous potential, a potential that arises in the ground because of human-made or natural disturbances. Telluric currents flow in Earth and the oceans. They have two causes: electromagnetic induction by the time-varying, external-origin geomagnetic field and motion of conducting bodies (such as seawater) across the Earth's permanent magnetic field. The distribution of telluric current density can be used to detect variations in electrical resistivity of underground structures. Geophysicists can also provide the electric current themselves (see induced polarization and electrical resistivity tomography).

Electromagnetic waves

Electromagnetic waves occur in the ionosphere and magnetosphere as well as in Earth's outer core. Dawn chorus is believed to be caused by high-energy electrons that get caught in the Van Allen radiation belt. Whistlers are produced by lightning strikes. Hiss may be generated by both. Electromagnetic waves may also be generated by earthquakes (see seismo-electromagnetics).

In the highly conductive liquid iron of the outer core, magnetic fields are generated by electric currents through electromagnetic induction. Alfvén waves are magnetohydrodynamic waves in the magnetosphere or the Earth's core. In the core, they probably have little observable effect on the Earth's magnetic field, but slower waves such as magnetic Rossby waves may be one source of geomagnetic secular variation.

Electromagnetic methods that are used for geophysical survey include transient electromagnetics, magnetotellurics, surface nuclear magnetic resonance and electromagnetic seabed logging.

Magnetism

The Earth's magnetic field protects the Earth from the deadly solar wind and has long been used for navigation. It originates in the fluid motions of the outer core. The magnetic field in the upper atmosphere gives rise to the auroras.

Diagram with field lines, axes and magnet lines.
Earth's dipole axis (pink line) is tilted away from the rotational axis (blue line).

The Earth's field is roughly like a tilted dipole, but it changes over time (a phenomenon called geomagnetic secular variation). Mostly the geomagnetic pole stays near the geographic pole, but at random intervals averaging 440,000 to a million years or so, the polarity of the Earth's field reverses. These geomagnetic reversals, analyzed within a Geomagnetic Polarity Time Scale, contain 184 polarity intervals in the last 83 million years, with change in frequency over time, with the most recent brief complete reversal of the Laschamp event occurring 41,000 years ago during the last glacial period. Geologists observed geomagnetic reversal recorded in volcanic rocks, through magnetostratigraphy correlation (see natural remanent magnetization) and their signature can be seen as parallel linear magnetic anomaly stripes on the seafloor. These stripes provide quantitative information on seafloor spreading, a part of plate tectonics. They are the basis of magnetostratigraphy, which correlates magnetic reversals with other stratigraphies to construct geologic time scales. In addition, the magnetization in rocks can be used to measure the motion of continents.

Radioactivity
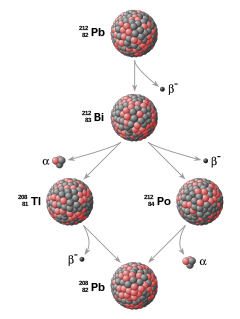
Diagram with compound balls representing nuclei and arrows.
Example of a radioactive decay chain (see Radiometric dating)

Radioactive decay accounts for about 80% of the Earth's internal heat, powering the geodynamo and plate tectonics. The main heat-producing isotopes are potassium-40, uranium-238, uranium-235, and thorium-232. Radioactive elements are used for radiometric dating, the primary method for establishing an absolute time scale in geochronology.

Unstable isotopes decay at predictable rates, and the decay rates of different isotopes cover several orders of magnitude, so radioactive decay can be used to accurately date both recent events and events in past geologic eras. Radiometric mapping using ground and airborne gamma spectrometry can be used to map the concentration and distribution of radioisotopes near the Earth's surface, which is useful for mapping lithology and alteration.

Fluid dynamics

Fluid motions occur in the magnetosphere, atmosphere, ocean, mantle and core. Even the mantle, though it has an enormous viscosity, flows like a fluid over long time intervals. This flow is reflected in phenomena such as isostasy, post-glacial rebound and mantle plumes. The mantle flow drives plate tectonics and the flow in the Earth's core drives the geodynamo.

Geophysical fluid dynamics is a primary tool in physical oceanography and meteorology. The rotation of the Earth has profound effects on the Earth's fluid dynamics, often due to the Coriolis effect. In the atmosphere, it gives rise to large-scale patterns like Rossby waves and determines the basic circulation patterns of storms. In the ocean, they drive large-scale circulation patterns as well as Kelvin waves and Ekman spirals at the ocean surface. In the Earth's core, the circulation of the molten iron is structured by Taylor columns.

Waves and other phenomena in the magnetosphere can be modeled using magnetohydrodynamics.

Mineral physics

The physical properties of minerals must be understood to infer the composition of the Earth's interior from seismology, the geothermal gradient and other sources of information. Mineral physicists study the elastic properties of minerals; their high-pressure phase diagrams, melting points and equations of state at high pressure; and the rheological properties of rocks, or their ability to flow. Deformation of rocks by creep make flow possible, although over short times the rocks are brittle. The viscosity of rocks is affected by temperature and pressure, and in turn, determines the rates at which tectonic plates move.

Water is a very complex substance and its unique properties are essential for life. Its physical properties shape the hydrosphere and are an essential part of the water cycle and climate. Its thermodynamic properties determine evaporation and the thermal gradient in the atmosphere. The many types of precipitation involve a complex mixture of processes such as coalescence, supercooling and supersaturation. Some precipitated water becomes groundwater, and groundwater flow includes phenomena such as percolation, while the conductivity of water makes electrical and electromagnetic methods useful for tracking groundwater flow. Physical properties of water such as salinity have a large effect on its motion in the oceans.

The many phases of ice form the cryosphere and come in forms like ice sheets, glaciers, sea ice, freshwater ice, snow, and frozen ground (or permafrost).

Regions of the Earth

Size and form of the Earth

Contrary to popular belief, the earth is not entirely spherical but instead generally exhibits an ellipsoid shape- which is a result of the centrifugal forces the planet generates due to its constant motion. These forces cause the planets diameter to bulge towards the Equator and results in the ellipsoid shape. Earth's shape is constantly changing, and different factors including glacial isostatic rebound (large ice sheets melting causing the Earth's crust to the rebound due to the release of the pressure), geological features such as mountains or ocean trenches, tectonic plate dynamics, and natural disasters can further distort the planet's shape.

Structure of the interior

Diagram with concentric shells and curved paths.
Seismic velocities and boundaries in the interior of the Earth sampled by seismic waves

Evidence from seismology, heat flow at the surface, and mineral physics is combined with the Earth's mass and moment of inertia to infer models of the Earth's interior – its composition, density, temperature, pressure. For example, the Earth's mean specific gravity (5.515) is far higher than the typical specific gravity of rocks at the surface (2.7–3.3), implying that the deeper material is denser. This is also implied by its low moment of inertia ( 0.33 M R2, compared to 0.4 M R2 for a sphere of constant density). However, some of the density increase is compression under the enormous pressures inside the Earth. The effect of pressure can be calculated using the Adams–Williamson equation. The conclusion is that pressure alone cannot account for the increase in density. Instead, we know that the Earth's core is composed of an alloy of iron and other minerals.

Reconstructions of seismic waves in the deep interior of the Earth show that there are no S-waves in the outer core. This indicates that the outer core is liquid, because liquids cannot support shear. The outer core is liquid, and the motion of this highly conductive fluid generates the Earth's field. Earth's inner core, however, is solid because of the enormous pressure.

Reconstruction of seismic reflections in the deep interior indicates some major discontinuities in seismic velocities that demarcate the major zones of the Earth: inner core, outer core, mantle, lithosphere and crust. The mantle itself is divided into the upper mantle, transition zone, lower mantle and D′′ layer. Between the crust and the mantle is the Mohorovičić discontinuity.

The seismic model of the Earth does not by itself determine the composition of the layers. For a complete model of the Earth, mineral physics is needed to interpret seismic velocities in terms of composition. The mineral properties are temperature-dependent, so the geotherm must also be determined. This requires physical theory for thermal conduction and convection and the heat contribution of radioactive elements. The main model for the radial structure of the interior of the Earth is the preliminary reference Earth model (PREM). Some parts of this model have been updated by recent findings in mineral physics (see post-perovskite) and supplemented by seismic tomography. The mantle is mainly composed of silicates, and the boundaries between layers of the mantle are consistent with phase transitions.

The mantle acts as a solid for seismic waves, but under high pressures and temperatures, it deforms so that over millions of years it acts like a liquid. This makes plate tectonics possible.

Magnetosphere

Diagram with colored surfaces and lines.
Schematic of Earth's magnetosphere. The solar wind flows from left to right.

If a planet's magnetic field is strong enough, its interaction with the solar wind forms a magnetosphere. Early space probes mapped out the gross dimensions of the Earth's magnetic field, which extends about 10 Earth radii towards the Sun. The solar wind, a stream of charged particles, streams out and around the terrestrial magnetic field, and continues behind the magnetic tail, hundreds of Earth radii downstream. Inside the magnetosphere, there are relatively dense regions of solar wind particles called the Van Allen radiation belts.

Methods

Geodesy

Geophysical measurements are generally at a particular time and place. Accurate measurements of position, along with earth deformation and gravity, are the province of geodesy. While geodesy and geophysics are separate fields, the two are so closely connected that many scientific organizations such as the American Geophysical Union, the Canadian Geophysical Union and the International Union of Geodesy and Geophysics encompass both.

Absolute positions are most frequently determined using the global positioning system (GPS). A three-dimensional position is calculated using messages from four or more visible satellites and referred to the 1980 Geodetic Reference System. An alternative, optical astronomy, combines astronomical coordinates and the local gravity vector to get geodetic coordinates. This method only provides the position in two coordinates and is more difficult to use than GPS. However, it is useful for measuring motions of the Earth such as nutation and Chandler wobble. Relative positions of two or more points can be determined using very-long-baseline interferometry.

Gravity measurements became part of geodesy because they were needed to related measurements at the surface of the Earth to the reference coordinate system. Gravity measurements on land can be made using gravimeters deployed either on the surface or in helicopter flyovers. Since the 1960s, the Earth's gravity field has been measured by analyzing the motion of satellites. Sea level can also be measured by satellites using radar altimetry, contributing to a more accurate geoid. In 2002, NASA launched the Gravity Recovery and Climate Experiment (GRACE), wherein two twin satellites map variations in Earth's gravity field by making measurements of the distance between the two satellites using GPS and a microwave ranging system. Gravity variations detected by GRACE include those caused by changes in ocean currents; runoff and ground water depletion; melting ice sheets and glaciers.

Satellites and space probes

Satellites in space have made it possible to collect data from not only the visible light region, but in other areas of the electromagnetic spectrum. The planets can be characterized by their force fields: gravity and their magnetic fields, which are studied through geophysics and space physics.

Measuring the changes in acceleration experienced by spacecraft as they orbit has allowed fine details of the gravity fields of the planets to be mapped. For example, in the 1970s, the gravity field disturbances above lunar maria were measured through lunar orbiters, which led to the discovery of concentrations of mass, mascons, beneath the Imbrium, Serenitatis, Crisium, Nectaris and Humorum basins.

Global positioning systems (GPS) and geographical information systems (GIS)

Since geophysics is concerned with the shape of the Earth, and by extension the mapping of features around and in the planet, geophysical measurements include high accuracy GPS measurements. These measurements are processed to increase their accuracy through differential GPS processing. Once the geophysical measurements have been processed and inverted, the interpreted results are plotted using GIS. Programs such as ArcGIS and Geosoft were built to meet these needs and include many geophysical functions that are built-in, such as upward continuation, and the calculation of the measurement derivative such as the first-vertical derivative. Many geophysics companies have designed in-house geophysics programs that pre-date ArcGIS and GeoSoft in order to meet the visualization requirements of a geophysical dataset.

Remote sensing

Exploration geophysics is a branch of applied geophysics that involves the development and utilization of different seismic or electromagnetic methods which the aim of investigating different energy, mineral and water resources. This is done through the uses of various remote sensing platforms such as; satellites, aircraft, boats, drones, borehole sensing equipment and seismic receivers. These equipment are often used in conjunction with different geophysical methods such as magnetic, gravimetry, electromagnetic, radiometric, barometry methods in order to gather the data. The remote sensing platforms used in exploration geophysics are not perfect and need adjustments done on them in order to accurately account for the effects that the platform itself may have on the collected data. For example, when gathering aeromagnetic data (aircraft gathered magnetic data) using a conventional fixed-wing aircraft- the platform has to be adjusted to account for the electromagnetic currents that it may generate as it passes through Earth's magnetic field. There are also corrections related to changes in measured potential field intensity as the Earth rotates, as the Earth orbits the Sun, and as the moon orbits the Earth.

Signal processing

Geophysical measurements are often recorded as time-series with GPS location. Signal processing involves the correction of time-series data for unwanted noise or errors introduced by the measurement platform, such as aircraft vibrations in gravity data. It also involves the reduction of sources of noise, such as diurnal corrections in magnetic data. In seismic data, electromagnetic data, and gravity data, processing continues after error corrections to include computational geophysics which result in the final interpretation of the geophysical data into a geological interpretation of the geophysical measurements

History

Geophysics emerged as a separate discipline only in the 19th century, from the intersection of physical geography, geology, astronomy, meteorology, and physics. The first known use of the word geophysics was in German ("Geophysik") by Julius Fröbel in 1834. However, many geophysical phenomena – such as the Earth's magnetic field and earthquakes – have been investigated since the ancient era.

Ancient and classical eras

Picture of ornate urn-like device with spouts in the shape of dragons
Replica of Zhang Heng's seismoscope, possibly the first contribution to seismology

The magnetic compass existed in China back as far as the fourth century BC. It was used as much for feng shui as for navigation on land. It was not until good steel needles could be forged that compasses were used for navigation at sea; before that, they could not retain their magnetism long enough to be useful. The first mention of a compass in Europe was in 1190 AD.

In circa 240 BC, Eratosthenes of Cyrene deduced that the Earth was round and measured the circumference of Earth with great precision. He developed a system of latitude and longitude.

Perhaps the earliest contribution to seismology was the invention of a seismoscope by the prolific inventor Zhang Heng in 132 AD. This instrument was designed to drop a bronze ball from the mouth of a dragon into the mouth of a toad. By looking at which of eight toads had the ball, one could determine the direction of the earthquake. It was 1571 years before the first design for a seismoscope was published in Europe, by Jean de la Hautefeuille. It was never built.

Beginnings of modern science

The 17th century had major milestones that marked the beginning of modern science. In 1600, William Gilbert release a publication titled De Magnete (1600) where he conducted series of experiments on both natural magnets (called 'loadstones') and artificially magnetized iron. His experiments lead to observations involving a small compass needle (versorium) which replicated magnetic behaviours when subjected to a spherical magnet, along with it experiencing 'magnetic dips' when it was pivoted on a horizontal axis. HIs findings led to the deduction that compasses point north due to the Earth itself being a giant magnet.

In 1687 Isaac Newton published his work titled Principia which was pivotal in the development of modern scientific fields such as astronomy and physics. In it, Newton both laid the foundations for classical mechanics and gravitation, as well as explained different geophysical phenomena such as the precession of the equinox (the orbit of whole star patterns along an ecliptic axis. Newton's theory of gravity had gained so much success, that it resulted in changing the main objective of physics in that era to unravel natures fundamental forces, and their characterizations in laws.

The first seismometer, an instrument capable of keeping a continuous record of seismic activity, was built by James Forbes in 1844.
Chronic solvent-induced encephalopathy

Chronic solvent-induced encephalopathy (CSE) is a condition induced by long-term exposure to organic solvents, often—but not always—in the workplace, that lead to a wide variety of persisting sensorimotor polyneuropathies and neurobehavioral deficits even after solvent exposure has been removed. This syndrome can also be referred to as psycho-organic syndrome, organic solvent syndrome, chronic painter's syndrome, occupational solvent encephalopathy, solvent intoxication, toxic solvent syndrome, painters disease, chronic toxic encephalopathy, or neurasthenic syndrome. The multiple names of solvent-induced syndromes combined with inconsistency in research methods makes referencing this disease difficult and its catalog of symptoms vague.

Symptoms and signs

Two characteristic symptoms of CSE are deterioration of memory (particularly short-term memory), and attention impairments. There are, however, numerous other symptoms that accompany to varying degrees. Variability in the research methods studying CSE makes characterizing these symptoms difficult, and some may be questionable regarding whether they are actual symptoms of solvent-induced syndromes, simply because of how infrequently they appear. Characterizing of CSE symptoms is more difficult because CSE is currently poorly defined, and the mechanism behind it is not understood yet.

Neurological

Reported neurological symptoms include difficulty sleeping, decrease in intellectual capacity, dizziness, altered visual perceptive abilities, affected psychomotor skills, forgetfulness, and disorientation. The mechanism behind these symptoms beyond solvent molecules crossing the blood–brain barrier is currently unknown. Neurological signs include impaired vibratory sensation at extremities and an inability to maintain steady motion, a possible effect from psychomotor damage in the brain. Other symptoms that have been seen include fatigue, decreased strength, and unusual gait. One study found that there was a correlation between decreased red blood cell count and level of solvent exposure, but not enough data has been found to support any blood tests to screen for CSE.

Sensory alterations

A 1988 study indicated that some solvent-exposed workers developed loss of smell or damage to color vision; however this may or may not have been actually caused by exposure to organic solvents. There is other evidence for subtle impairment of color vision (especially impairment of Tritan color or "blue-yellow" color discernment), synergistic exacerbation of hearing loss, and loss of the sense of smell (anosmia).

Psychological

Psychological symptoms of CSE that have been reported include mood swings, increased irritability, depression, a lack of initiative, uncontrollable and intense displays of emotion such as spontaneous laughing or crying, and a severe lack of interest in sex. Some psychological symptoms are believed to be linked to frustration with other symptoms, neurological, or pathophysiological symptoms of CSE. A case study of a painter diagnosed with CSE reported that the patient frequently felt defensive, irritable, and depressed because of his memory deficiencies.

Causes

Organic solvents that cause CSE are characterized as volatile, blood soluble, lipophilic compounds that are typically liquids at normal temperature. These can be compounds or mixtures used to extract, dissolve, or suspend non-water-soluble materials such as fats, oils, lipids, cellulose derivatives, waxes, plastics, and polymers. These solvents are often used industrially in the production of paints, glues, coatings, degreasing agents, dyes, polymers, pharmaceuticals, and printing inks. Some common organic solvents known to cause CSE include formaldehyde, acetates, and alcohols.

Exposure to solvents can occur by inhalation, ingestion, or direct absorption through the skin. Of the three, inhalation is the most common form of exposure, with the solvent able to rapidly pass through lung membranes and then into fatty tissue or cell membranes. Once in the bloodstream, organic solvents easily cross the blood–brain barrier, due to their lipophilic properties. However, the sequence of effects that these solvents have on the brain is not yet fully understood.

Diagnosis

Due to its non-specific nature, diagnosing CSE requires a multidisciplinary "Solvent Team" typically consisting of a neurologist, occupational physician, occupational hygienist, neuropsychologist, and sometimes a psychiatrist or toxicologist. Together, the team of specialists assess the patient's history of exposure, symptoms, and course of symptom development relative to the amount and duration of exposure, presence of neurological signs, and any existing neuropsychological impairment.

Furthermore, CSE must be diagnosed "by exclusion". This means that all other possible causes of the patient's symptoms must first be ruled out beforehand. Because screening and assessing for CSE is a complex and time-consuming procedure requiring several specialists of multiple fields, few cases of CSE are formally diagnosed in the medical field. This may, in part, be a reason for the syndrome's lack of widespread recognition. The solvents responsible for neurological effects dissipate quickly after an exposure, leaving only indirect evidence of their presence, in the form of temporary or permanent impairments.

Brain imaging techniques which have been explored in research have shown little promise as alternative methods to diagnose CSE. Neuroradiology and functional imaging have shown mild cortical atrophy, and effects in dopamine-mediated frontostriatal circuits in some cases. Examinations of regional cerebral blood flow in some imaging techniques have also shown some cerebrovascular abnormalities in patients with CSE, but the data were not different enough from healthy patients to be considered significant. The most promising brain imaging technique being studied currently is functional magnetic resonance imaging (fMRI) but as of now, no specific brain imaging techniques are available to reliably diagnose CSE.

Classification

Introduced by a working group from the World Health Organization (WHO) in 1985, WHO diagnostic criteria states that CSE can occur in three stages, organic affective syndrome (type I), mild chronic toxic encephalopathy (type II), and severe chronic toxic encephalopathy (type III). Shortly after, a workshop in Raleigh-Durham, NC (United States) released a second diagnostic criterion which recognizes four stages as symptoms only (type 1), sustained personality or mood swings (type 2A), impairment of intellectual function (type 2B), and dementia (type 3). Though not identical, the WHO and Raleigh criteria are relatively comparable. WHO type I and Raleigh types 1 and 2A are believed to encompass the same stages of CSE, and WHO type II and Raleigh type 2B both involve deficiencies in memory and attention. No other international classifications for CSE have been proposed, and neither the WHO nor Raleigh criteria have been uniformly accepted for epidemiological studies.

Treatment

Like diagnosis, treating CSE is difficult because it is vaguely defined and data on the mechanism of CSE effects on neural tissue are lacking. There is no existing treatment that is effective at completely recovering any neurological or physical function lost due to CSE. This is believed to be because of the limited regeneration capabilities in the central nervous system. Furthermore, existing symptoms of CSE can potentially worsen with age. Some symptoms of CSE, such as depression and sleep issues, can be treated separately, and therapy is available to help patients adjust to any untreatable disabilities. Current management for CSE involves treating accompanying psychopathology, symptoms, and preventing further deterioration.

History

Cases of CSE have been studied predominantly in northern Europe, though documented cases have been found in other countries such as the United States, France, and China. The first documented evidence for CSE was in the early 1960s from a paper published by Helena Hanninen, a Finnish neuropsychologist. Her paper described a case of workers who developed carbon disulfide intoxication at a rubber manufacturing company and coined the term "psycho-organic syndrome". Studies of solvent effects on intellectual functioning, memory, and concentration were carried out in the Nordic countries, with Denmark spearheading the research. Growing awareness of the syndrome in the Nordic countries occurred in the 1970s.

To reduce cases of CSE in the workforce, a diagnostic criterion for CSE appeared on information notices in occupational disease records in the European Commission. Following, from 1998 to 2004, was a health surveillance program for CSE cases among construction painters in the Netherlands. By 2000, a ban was put into action against using solvent-based paints indoors, which resulted in a considerable reduction of solvent exposure to painters. As a result, the number of CSE cases dropped substantially after 2002. In 2005–2007, no new CSE cases were diagnosed among construction painters in the Netherlands, and no occupational CSE has been encountered in workers under thirty years of age in Finland since 1995.

Though movements to reduce CSE have been successful, CSE still poses an issue to many workers that are at occupational risk. Statistics published in 2012 by Nicole Cherry et al. claim that at least 20% of employees in Finland still encounter organic solvents at the workplace, and 10% of them experience some form of disadvantage from the exposure. In Norway, 11% of the male population of workers and 7% of female workers are still exposed to solvents daily and as of 2006, the country has the highest rate of diagnosed CSE in Europe. Furthermore, due to the complexity of screening for CSE, there is still a high likelihood of a population of undiagnosed cases.

Occupations that have been found to have higher risk of causing CSE are painter, printer, industrial cleaner, and paint or glue manufacturer. Of them, painters have been found to have the highest recorded incidence of CSE. Spray painters in particular have higher exposure intensities than other painters. Studies of instances of CSE have specifically been carried out in naval dockyards, mineral fiber manufacturing companies, and rayon viscose plants.

Giant oil and gas fields

From Wikipedia, the free encyclopedia
https://en.wikipedia.org/wiki/Giant_oil_and_gas_fields

The world's 932 giant oil and gas fields are considered those with 500 million barrels (79,000,000 m3) of ultimately recoverable oil or gas equivalent. Geoscientists believe these giants account for 40 percent of the world's petroleum reserves. They are clustered in 27 regions of the world, with the largest clusters in the Persian Gulf and Western Siberian basin. The past three decades reflect declines in discoveries of giant fields. The years 2000–11 reflect an upturn in discoveries and appears on track to be the third best decade for discovery of giant oil and gas fields in the 150-year history of modern oil and gas exploration.

Recent work in tracking giant oil and gas fields follows the earlier efforts of the late exploration geologist Michel T. Halbouty, who tracked trends in giant discoveries from the 1960s to 2004.

Tectonic settings

Geophysicists and exploration geologists who look for oil and gas fields classify the subsurface characteristics, or tectonic setting, of geological structures that contain hydrocarbons. Any one oil and gas field may reflect influences from multiple geological periods and events, but geoscientists often attempt to characterize a field based on the dominant geological event that influenced the structure's ability to trap and contain oil and gas in recoverable quantities.

A majority of the world's giant oil and gas fields exist in two characteristic tectonic settings—passive margin and rift environments. Passive margins are found along the edges of major ocean basins, such as the Atlantic coast of Brazil where oil and gas has been located in large quantities in the Campos basin. Rifts are oceanic ridges formed when tectonic plates separate and a new crust is created. The North Sea is an example of a rift setting associated with prodigious hydrocarbon reserves. Geoscientists theorize that both zones are especially conducive to forming giant oil and gas fields when they are distant from active tectonic areas. Stability appears to be conducive to trapping and retaining hydrocarbons under the subsurface.

Four other common tectonic settings, including collisional margins, strike-slip margins, and subduction margins, are associated with the formation of giant oil and gas fields, though not to the dominant extent of passive margin and rift settings.

Recent and future giants

Based on the locations of past giants, Mann et al. predicted new discoveries of giant oil and gas fields would mainly be made in passive margin and rift environments, especially in deepwater basins. They also predicted that existing areas that have produced giant fields would be likely targets for new discoveries of "elephants", as the fields are sometimes known in the oil and gas industry.

Data from 2000–07 reflect the accuracy of their predictions. The 79 new giant oil and gas fields discovered from 2000–07 tended to be located in similar tectonic settings as the previously documented giants from 1868–2000, with 36 percent along passive margins, 30 percent in rift zones or overlying sags (structures associated with rifts), and 20 percent in collisional zones.

Despite a recent uptick in the number of giant oil and gas fields, discovery of giants appears to have peaked in the 1960s and 1970s. Looking to the future, geoscientists foresee a continuation of the recent trend of discovering more giant gas fields than oil fields. Two major continental regions—Antarctica and the Arctic—remain largely unexplored. Beyond them, however, trends suggest that remaining giant fields will be discovered in "in-fill" areas where past giants have been clustered and in frontier, or new, areas that correspond to the predominant tectonic settings of past giants.

Giant field production properties and behaviour

Comprehensive analysis of the production from the majority of the world's giant oil fields has shown their enormous importance for global oil production. For instance, the 20 largest oil fields in the world alone account for roughly 25% of the total oil production.

Further analysis shows that giant oil fields typically reach their maximum production before 50% of the ultimate recoverable volume has been extracted. A strong correlation between depletion and the rate of decline was also found in that study, indicating that much new technology has only been able to temporarily decrease depletion at the expense of rapid future decline. This is exactly the case in the Cantarell Field.

North Sea oil

From Wikipedia, the free encyclopedia
North Sea Oil and Gas Fields
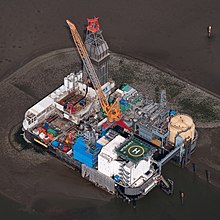
An oil platform in Mittelplate, Wadden Sea

North Sea oil is a mixture of hydrocarbons, comprising liquid petroleum and natural gas, produced from petroleum reservoirs beneath the North Sea.

In the petroleum industry, the term "North Sea" often includes areas such as the Norwegian Sea and the area known as "West of Shetland", "the Atlantic Frontier" or "the Atlantic Margin" that is not geographically part of the North Sea.

Brent crude is still used today as a standard benchmark for pricing oil, although the contract now refers to a blend of oils from fields in the northern North Sea.

From the 1960s to 2014 it was reported that 42 billion barrels of oil equivalent (BOE) had been extracted from the North Sea since when production began. As there is still an estimated 24 billion BOE potentially remaining in the reservoir (equivalent to about 35 years worth of production), the North Sea will remain as an important petroleum reservoir for years to come. However, this is the upper end of a range of estimates provided by Sir Ian Wood (commissioned by the UK government to carry out a review of the oil industry in the United Kingdom); the lower end was 12 billion barrels. Wood, upset with how his figures were being used, said the most likely amount to be found would be between 15 billion and 16 billion barrels.

History

1851–1963

Commercial extraction of oil on the shores of the North Sea dates back to 1851, when James Young retorted oil from torbanite (boghead coal, or oil shale) mined in the Midland Valley of Scotland. Across the sea in Germany, oil was found in the Wietze field near Hanover in 1859, leading to the discovery of seventy more fields, mostly in Lower Cretaceous and Jurassic reservoirs, producing a combined total of around 1340 m³ (8,400 barrels) per day.

Gas was found by chance in a water well near Hamburg in 1910, leading to minor gas discoveries in Zechstein dolomites elsewhere in Germany. In England, BP discovered gas in similar reservoirs in the Eskdale anticline in 1938, and in 1939 they found commercial oil in Carboniferous rocks at Eakring in Nottinghamshire. Discoveries elsewhere in the East Midlands lifted production to 400 m³ (2,500 barrels) per day, and a second wave of exploration from 1953 to 1961 found the Gainsborough field and ten smaller fields.

The Netherlands' first oil shows were seen in a drilling demonstration at De Mient during the 1938 World Petroleum Congress at The Hague. Subsequent exploration led to the 1943 discovery by Exploratie Nederland, part of the Royal Dutch/Shell company Bataafsche Petroleum Maatschappij, of oil under the Dutch village of Schoonebeek, near the German border. NAM found the Netherlands' first gas in Zechstein carbonates at Coevorden in 1948. 1952 saw the first exploration well in the province of Groningen, Haren-1, which was the first to penetrate the Lower Permian Rotliegendes sandstone that is the main reservoir for the gas fields of the southern North Sea, although in Haren-1 it contained only water. The Ten Boer well failed to reach target depth for technical reasons, but was completed as a minor gas producer from the Zechstein carbonates. The Slochteren-1 well found gas in the Rotliegendes in 1959, although the full extent of what became known as the Groningen gas field was not appreciated until 1963—it is currently estimated at ≈96×1012 cu ft (2,700 km3) recoverable gas reserves. Smaller discoveries to the west of Groningen followed.

1964–present

The UK Continental Shelf Act came into force in May 1964. Seismic exploration and the first well followed later that year. It and a second well on the Mid North Sea High were dry, as the Rotliegendes was absent, but BP's Sea Gem rig struck gas in the West Sole Field in September 1965. The celebrations were short-lived since the Sea Gem sank, with the loss of 13 lives, after part of the rig collapsed as it was moved away from the discovery well. The Viking Gas Field was discovered in December 1965 with the Conoco/National Coal Board well 49/17-1, finding the gas-bearing Permian Rotliegend Sandstone at a depth of 2,756 m subsea. Helicopters were first used to transport workers. Larger gas finds followed in 1966 – Leman Bank, Indefatigable and Hewett – but by 1968 companies had lost interest in further exploration of the British sector, a result of a ban on gas exports and low prices offered by the only buyer, British Gas. West Sole came onstream in May 1967. Licensing regulations for Dutch waters were not finalised until 1967.

The situation was transformed in December 1969, when Phillips Petroleum discovered oil in Chalk of Danian age at Ekofisk, in Norwegian waters in the central North Sea. The same month, Amoco discovered the Montrose Field about 217 km (135 mi) east of Aberdeen. The original objective of the well had been to drill for gas to test the idea that the southern North Sea gas province extended to the north. Amoco were astonished when the well discovered oil. BP had been awarded several licences in the area in the second licensing round late in 1965, but had been reluctant to work on them. The discovery of Ekofisk prompted them to drill what turned out to be a dry hole in May 1970, followed by the discovery of the giant Forties Oil Field in October 1970. The following year, Shell Expro discovered the giant Brent oilfield in the northern North Sea east of Shetland in Scotland and the Petronord Group discovered the Frigg gas field. The Piper oilfield was discovered in 1973 and the Statfjord Field and the Ninian Field in 1974, with the Ninian reservoir consisting of Middle Jurassic sandstones at a depth of 3000 m subsea in a "westward tilted horst block".

Offshore production, like that of the North Sea, became more economical after the 1973 oil crisis caused the world oil price to quadruple, followed by the 1979 oil crisis, which caused another tripling in the oil price. Oil production started from the Argyll & Duncan Oilfields (now the Ardmore) in June 1975 followed by Forties Oil Field in November of that year. The inner Moray Firth Beatrice Field, a Jurassic sandstone/shale reservoir 1829 m deep in a "fault-bounded anticlinal trap", was discovered in 1976 with well 11/30-1, drilled by the Mesa Petroleum Group (named after T. Boone Pickens' wife Bea, "the only oil field in the North Sea named for a woman") in 49 m of water.

A 'Statfjord' gravity-based structure under construction in Norway. Almost all of the structure was submerged.

Volatile weather conditions in Europe's North Sea have made drilling particularly hazardous, claiming many lives (see Oil platform). The conditions also make extraction a costly process; by the 1980s, costs for developing new methods and technologies to make the process both efficient and safe far exceeded NASA's budget to land a man on the moon. The exploration of the North Sea has continually pushed the edges of the technology of exploitation (in terms of what can be produced) and later the technologies of discovery and evaluation (2-D seismic, followed by 3-D and 4-D seismic; sub-salt seismic; immersive display and analysis suites and supercomputing to handle the flood of computation required).

The Gullfaks oil field was discovered in 1978. The Snorre Field was discovered in 1979, producing from the Triassic Lunde Formation and the Triassic-Jurassic Statfjord Formation, both fluvial sandstones in a mudstone matrix. The Oseberg oil field and Troll gas field were also discovered in 1979. The Miller oilfield was discovered in 1983. The Alba Field produces from sandstones in the middle Eocene Alba Formation at 1860 m subsea and was discovered in 1984 in UKCS Block 16/26. The Smørbukk Field was discovered in 1984 in 250–300 m of water that produces from Lower to Middle Jurassic sandstone formations within a fault block. The Snøhvit Gas Field and the Draugen oil field were discovered in 1984. The Heidrun oil field was discovered in 1985.

The largest UK field discovered in the past twenty-five years is Buzzard, also located off Scotland, found in June 2001 with producible reserves of almost 64×106 m³ (400m bbl) and an average output of 28,600 m3 to 30,200 m3 (180,000–220,000 bbl) per day.

The largest field found in the past five years on the Norwegian part of the North Sea is the Johan Sverdrup oil field, which was discovered in 2010. It is one of the largest discoveries made in the Norwegian Continental Shelf. Total reserves of the field are estimated at 1.7 to 3.3 billion barrels of gross recoverable oil, and Johan Sverdrup is expected to produce 120,000 to 200,000 barrels of oil per day. Production started on 5 October 2019.

As of January 2015, the North Sea was the world's most active offshore drilling region, with 173 active rigs drilling. By May 2016, the North Sea oil and gas industry was financially stressed by the reduced oil prices, and called for government support.

The distances, number of workplaces, and fierce weather in the 750,000 square kilometre (290,000 square mile) North Sea area require the world's largest fleet of heavy instrument flight rules (IFR) helicopters, some specifically developed for the North Sea. They carry about two million passengers per year from sixteen onshore bases, of which Aberdeen Airport is the world's busiest, with 500,000 passengers per year.

Licensing

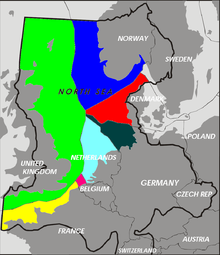
The Exclusive Economic Zones in the North Sea

Following the 1958 Convention on the Continental Shelf and after some disputes on the rights to natural resource exploitation the national limits of the exclusive economic zones were ratified. Five countries are involved in oil production in the North Sea. All operate a tax and royalty licensing regime. The respective sectors are divided by median lines agreed in the late 1960s:

  • Norway – Oljedirektoratet (the Norwegian Petroleum Directorate grants licences. The NCS is also divided into quads of 1 degree by 1 degree. Norwegian licence blocks are larger than British blocks, being 15 minutes of latitude by 20 minutes of longitude (12 blocks in a quad). Like in Britain, there are numerous part blocks formed by re-licensing relinquished areas.
  • United Kingdom – Exploration and production licences are regulated by the Oil and Gas Authority following the 2014 Wood Review on maximising UKCS (United Kingdom Continental Shelf) oil and gas recovery. Licences were formerly granted by the Department of Energy and Climate Change (DECC – formerly the Department of Trade and Industry). The UKCS is divided into quadrants of 1 degree latitude and one degree longitude. Each quadrant is divided into 30 blocks measuring 10 minutes of latitude and 12 minutes of longitude. Some blocks are divided further into part blocks where some areas are relinquished by previous licensees. For example, block 13/24a is located in quad 13 and is the 24th block and is the 'a' part block. The UK government has traditionally issued licences via periodic (now annual) licensing rounds. Blocks are awarded on the basis of the work programme bid by the participants. The UK government has actively solicited new entrants to the UKCS via "promote" licensing rounds with less demanding terms and the fallow acreage initiative, where non-active licences have to be relinquished.
  • Denmark – Energistyrelsen (the Danish Energy Agency) administers the Danish sector. The Danes also divide their sector of the North Sea into 1 degree by 1 degree quadrants. Their blocks, however, are 10 minutes latitude by 15 minutes longitude. Part blocks exist where partial relinquishment has taken place.
  • Germany – Germany and the Netherlands share a quadrant and block grid—quadrants are given letters rather than numbers. The blocks are 10 minutes latitude by 20 minutes longitude.
  • Netherlands – The Dutch sector is located in the Southern Gas Basin and shares a grid pattern with Germany.

Reserves and production

The Norwegian and British sectors hold most of the large oil reserves. It is estimated that the Norwegian sector alone contains 54% of the sea's oil reserves and 45% of its gas reserves. More than half of the North Sea oil reserves have been extracted, according to official sources in both Norway and the UK. For Norway, Oljedirektoratet gives a figure of 4,601 million cubic metres of oil (corresponding to 29 billion barrels) for the Norwegian North Sea alone (excluding smaller reserves in Norwegian Sea and Barents Sea) of which 2,778 million cubic metres (60%) has already been produced prior to January 2007. UK sources give a range of estimates of reserves, but even using the most optimistic "maximum" estimate of ultimate recovery, 76% had been recovered as of the end of 2010. Note the UK figure includes fields which are not in the North Sea (onshore, West of Shetland).

United Kingdom Continental Shelf production was 137 million tonnes of oil and 105 billion m³ of gas in 1999. (1 tonne of crude oil converts to 7.5 barrels). The Danish explorations of Cenozoic stratigraphy, undertaken in the 1990s, showed petroleum-rich reserves in the northern Danish sector, especially the Central Graben area. The Dutch area of the North Sea followed through with onshore and offshore gas exploration, and well creation. Exact figures are debatable, because methods of estimating reserves vary and it is often difficult to forecast future discoveries.

Peaking and decline

Official production data from 1995 to 2020 is published by the UK government. Table 3.10 lists annual production, import and exports over that period. When it peaked in 1999, production of North Sea oil was 128 million tonnes per year, approx, 950,000 m³ (6 million barrels) per day, having risen by ~ 5% from the early 1990s. However, by 2010 this had halved to under 60 million tonnes/year, and continued declining further, and between 2015 and 2020 has hovered between 40 and 50 million tonnes/year, at around 35% of the 1999 peak. From 2005 the UK became a net importer of crude oil, and as production declined, the amount imported has slowly risen to ~ 20 million tonnes per year by 2020.

Similar historical data is available for gas. Natural gas production peaked at nearly 10 trillion cubic feet (280×109 m³) in 2001 representing some 1.2GWhr of energy; by 2018 UK production had declined to 1.4 trillion cubic feet, (41×109 m³). Over a similar period energy from gas imports have risen by a factor of approximately 10, from 60GWh in 2001 to just over 500GWh in 2019.

UK oil production has seen two peaks, in the mid-1980s and the late 1990s, with a decline to around 300×103 m³ (1.9 million barrels) per day in the early 1990s. Monthly oil production peaked at 13.5×10⁶ m³ (84.9 million barrels) in January 1985 although the highest annual production was seen in 1999, with offshore oil production in that year of 407×106 m³ (398 million barrels) and had declined to 231×106 m³ (220 million barrels) in 2007. This was the largest decrease of any oil-exporting nation in the world, and has led to Britain becoming a net importer of crude for the first time in decades, as recognized by the energy policy of the United Kingdom. Norwegian crude oil production as of 2013 is 1.4 mbpd. This is a more than 50% decline since the peak in 2001 of 3.2 mbpd.

Geology

The geological disposition of the UK's oil and gas fields is outlined in the following table.

North Sea oil and gas fields – Geology
Geological Era Geological Epoch Age, million years Fields
Tertiary Pliocene 2–5
Miocene 5–23
Oligocene 23–34
Eocene 34–56 Frigg, Gannet, Alba
Palaeocene 56–66 Arbroath, Balmoral, Everest, Forties, Heimdal, Maureen, Montrose, Nelson
Mesozoic Cretaceous 66–145 Lower: Britannia, Scapa
Jurassic 145–201 Upper: Moray Firth fields, Brae, Buzzard, Claymore, Fulmar, Magnus, Piper, Scott, Tiffany

Kittiwake, Gannet

Middle: Brent, Bruce, Eider, Heather, Hutton, Ninian, Tern

Lower to Middle: Beatrice

Triassic 201–252 Upper: Beryl

Dotty, Douglas, Esmond, Hamilton, J-Block, Morecambe Bay

Lower: Hewett

Palaeozoic Permian 252–299 Upper Permian (Zechstein): Argyll, Auk

Lower Permian (Rotliegend): Camelot, Indefatigable, Leman, Viking, West Sole

Carboniferous 299–359 Caister, Murdoch
Devonian 359–419 Buchan
Silurian 419–444
Ordovician 444–485
Cambrian 485–541

Carbon dioxide sequestration

In the North Sea, Norway's Equinor natural-gas platform Sleipner strips carbon dioxide out of the natural gas with amine solvents and disposes of this carbon dioxide by geological sequestration ("carbon sequestration") while keeping up gas production pressure. Sleipner reduces emissions of carbon dioxide by approximately one million tonnes a year; that is about 19000th of global emissions. The cost of geological sequestration is minor relative to the overall running costs.

Operator (computer programming)

From Wikipedia, the free encyclopedia https://en.wikipedia.org/wiki/Operator_(computer_programmin...