Search This Blog

Friday, September 29, 2023

Alcoholic cardiomyopathy

From Wikipedia, the free encyclopedia
 
Alcoholic cardiomyopathy
SpecialtyCardiology 

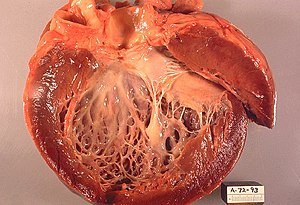
Alcoholic cardiomyopathy (ACM) is a disease in which the long-term consumption of alcohol leads to heart failure. ACM is a type of dilated cardiomyopathy. The heart is unable to pump blood efficiently, leading to heart failure. It can affect other parts of the body if the heart failure is severe. It is most common in males between the ages of 35 and 50.

Etiology

The causal relationship between alcohol consumption and cardiomyopathy and heart failure is unclear. Per the American Heart Association (AHA), alcohol is one of the leading causes of dilated cardiomyopathy. However, multiple longitudinal studies have shown a paradoxical lowering of dilated cardiomyopathy with modest-to-moderate alcohol consumption.

ACM is a type of heart disease that occurs due to chronic alcohol consumption. The etiology of ACM is multifactorial, with a combination of genetic, environmental, and lifestyle factors playing a role. The direct toxic effects of alcohol on the heart muscle cells (cardiomyocytes) are considered the primary cause of ACM. Chronic alcohol consumption leads to the accumulation of toxic metabolites, such as acetaldehyde and reactive oxygen species, in the heart muscle cells. These toxic substances can cause oxidative stress, inflammation, and damage to the cardiomyocytes, leading to the development of ACM.

Additionally, chronic alcohol consumption can lead to deficiencies in essential vitamins and minerals, such as thiamine, magnesium, and selenium, which are important for the proper functioning of the heart. Thiamine deficiency, in particular, is common in people with alcohol use disorder and can lead to a condition known as beriberi, which can damage the heart muscle. Furthermore, chronic alcohol consumption can also lead to other cardiovascular risk factors, such as high blood pressure, high cholesterol levels, and obesity, which can contribute to the development of ACM. Overall, the etiology of ACM is complex and involves various factors that can damage the heart muscle over time.

Signs and symptoms

Signs and symptoms of alcoholic cardiomyopathy are indistinguishable from those seen in other forms of cardiomyopathy. These symptoms can include the following:

  • Ankle, feet, and leg swelling (edema)
    • This occurs because of a phenomenon known as third spacing. Third spacing occurs because the heart is unable to pump the blood throughout the body, and thus the fluid pools up in your veins. The fluid then eventually leaves your veins and enters the interstitial space, causing swelling. Doctors will sometimes test for pitting edema by pressing their fingers against the swelling to see if any "pitting" occurs.  
  • Overall swelling
  • Loss of appetite
  • Shortness of breath (dyspnea), especially with activity
  • Breathing difficulty while lying down
    • This medical term for this symptoms is orthopnea, it occurs because fluid builds up in the posterior portion of both lungs, making it difficult to breathe.
  • Fatigue, weakness, faintness
  • Decreased alertness or concentration
  • Cough containing mucus, or pink, frothy material
  • Decreased urine output (oliguria)
  • Need to urinate at night (nocturia)
  • Heart palpitations (irregular heart beat)
  • Rapid pulse (tachycardia)

The signs and symptoms of alcoholic cardiomyopathy (ACM) can vary depending on the severity of the condition. In the early stages, people with ACM may not experience any symptoms. However, as the condition progresses, they may experience symptoms such as fatigue, shortness of breath, palpitations, and swelling of the legs and ankles. They may also experience chest pain, dizziness, and fainting. In some cases, ACM can cause arrhythmias or irregular heartbeats, which can be life-threatening. In advanced cases, people with ACM may develop severe heart failure, which can cause symptoms such as severe shortness of breath, wheezing, and coughing. If left untreated, ACM can lead to life-threatening complications such as heart failure, arrhythmias, and sudden cardiac death. Therefore, it is important to seek medical attention if any of these symptoms are experienced, especially if there is a history of chronic alcohol consumption.

Pathophysiology

Alcohol-induced cardiac toxicity (AiCT) is characterized as either acute or chronic. It is believed that consumption of large amounts of alcohol leads to cardiac inflammation, which can be detected by finding large amounts of troponin in the serum. Chronic consumption of alcohol (defined as greater than 80 g per day for at least 5 years) can lead to multi-organ failure, including myocardial dysfunction. The exact pathophysiologic mechanism by which chronic consumption of alcohol causes DCM is not well understood, however it's believed that genetic mutation, and mitochondrial damage due to oxidative stress injury may play a role.

Diagnosis

Abnormal heart sounds, murmurs, ECG abnormalities, and enlarged heart on chest x-ray may lead to the diagnosis. Echocardiogram abnormalities and cardiac catheterization or angiogram to rule out coronary artery blockages, along with a history of alcohol abuse can confirm the diagnosis. It's important to note that part of diagnosing Chronic ACM is noting the absence of coronary artery disease. It's also worth noting that the diagnosis of ACM is largely a diagnosis of exclusion.

The diagnosis of alcoholic cardiomyopathy is typically made based on a combination of the patient's medical history, physical examination, and diagnostic tests. Firstly, the doctor will ask the patient about their alcohol consumption habits, as well as any symptoms they may have experienced, such as shortness of breath or swelling in the legs. They may also perform a physical examination to check for signs of heart failure, such as an enlarged heart or fluid buildup in the lungs.

In addition to the patient's medical history and physical exam, the diagnosis of alcoholic cardiomyopathy is often confirmed with various diagnostic tests. One of the most common tests is an echocardiogram, which uses ultrasound waves to create images of the heart and can detect abnormalities in the heart's structure and function. Other tests may include an electrocardiogram (ECG) to measure the heart's electrical activity, and blood tests to check for elevated levels of certain enzymes that may indicate heart damage. If the diagnosis is confirmed, treatment typically involves stopping alcohol consumption and managing heart failure symptoms through medications, lifestyle changes, and in severe cases, heart transplantation.
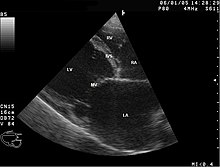
Labeled chambers

Prognosis

The prognosis is influenced by several factors, including the amount of alcohol and the time period over which it has been consumed, the presence or absence of dysrhythmias such as atrial fibrillation, and the width of the QRS complex. Some indications of poor prognosis include the following: patients with QRS > 120, patients who continue to consume alcohol for prolonged periods. Consumption of alcohol is directly related to the amount of alcohol consumed and length of consumption. Indicators of good prognosis include the following: successfully quitting the consumption of alcohol (associated with decreased hospital admissions), and patient compliance with beta blockers. Mortality is between 40–80% 10 years post-diagnosis.

The prognosis of alcoholic cardiomyopathy (ACM) varies depending on the severity of the condition, the extent of heart muscle damage, and the response to treatment. Without treatment, ACM can progress to severe heart failure, arrhythmias, and sudden cardiac death. However, with proper treatment, including cessation of alcohol consumption and management of heart failure symptoms, the prognosis can improve significantly.

Research has shown that the mortality rate for people with ACM is higher than that of the general population, with a five-year survival rate of around 50%. However, studies have also shown that people who stop drinking alcohol have a significantly better prognosis than those who continue to drink. In addition, people who receive early treatment for ACM, including medication and lifestyle modifications, have a better chance of improving their heart function and overall health.

The prognosis of ACM can also depend on the presence of other comorbidities such as diabetes, hypertension, and obesity. These conditions can exacerbate the effects of ACM on the heart and increase the risk of complications. Therefore, it is important to manage these comorbidities to improve the overall prognosis of ACM.

Complications

  • Heart failure
  • Cachexia
  • Arrhythmias
  • Cardioembolism
  • Death

There are several complications that can arise as a result of alcoholic cardiomyopathy. For instance, individuals with this condition may be at a higher risk of developing blood clots, which can lead to heart attacks, strokes, or other serious cardiovascular events. Additionally, the weakened heart muscle may not be able to effectively pump blood to the lungs, leading to the accumulation of fluid in the lungs, a condition known as pulmonary edema.

Another potential complication of alcoholic cardiomyopathy is the development of arrhythmias, or abnormal heart rhythms. These irregular heart rhythms can range from mild to severe and may cause symptoms such as palpitations, lightheadedness, or even loss of consciousness. In some cases, arrhythmias can lead to sudden cardiac arrest, a life-threatening condition in which the heart suddenly stops.

Treatment

Treatment for alcoholic cardiomyopathy involves lifestyle changes, including complete abstinence from alcohol use, a low sodium diet, and fluid restriction, as well as medications. Medications may include ACE inhibitors, beta blockers, and diuretics which are commonly used in other forms of cardiomyopathy to reduce the strain on the heart. Persons with congestive heart failure may be considered for surgical insertion of an ICD or a pacemaker which can improve heart function. In cases where the heart failure is irreversible and worsening, heart transplant may be considered. Treatment will possibly prevent the heart from further deterioration, and the cardiomyopathy is largely reversible if complete abstinence from alcohol is maintained.

Unfortunately, for patients that require heart transplants, cardiomyopathy due to alcoholism has the lowest post-heart transplant survival out of all causes of cardiomyopathy. Per one study that compared 224 alcoholic cardiomyopathy patients to over 60,000 non-alcoholic cardiomyopathy patients, survival post heart transplant was less at 1 year, 5 years, 10 years, and 12 years.

Interestingly, in patients that are defined as "heavy drinkers" (defined as consuming >30g of alcohol/day) decreased alcohol consumption to moderate levels has been shown to be an effective treatment; in fact  A retrospective cohort study analyzed data collected from over 3.8 million patients, and categorized patients as either abstinent drinkers, mild drinkers, moderate drinkers, and heavy drinkers. Despite having such a large sample size, the association between alcohol intake and cardiomyopathy remains unclear. The study found that patients that were either mild or moderate drinkers were the least likely to develop HF as compared to patients that were abstinent. The study also found that patients that increased their alcohol consumption from light to moderate and/or from moderate to heavy were at increased risk for heart failure. Although one might think that patients that were completely abstinent from alcohol would have would be least likely of being diagnosed with heart failure, it's actually patients categorized as either light or moderate drinkers had the lowest risk for developing HF.
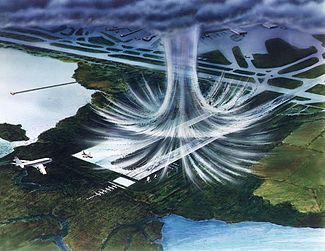
Downburst

From Wikipedia, the free encyclopedia
https://en.wikipedia.org/wiki/Downburst
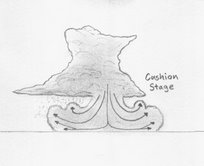
Illustration of a microburst. The air moves in a downward motion until the surface. It then spreads outward in all directions. The wind regime in a microburst is opposite to that of a tornado.

In meteorology, a downburst is a strong downward and outward gushing wind system that emanates from a point source above and blows radially, that is, in straight lines in all directions from the area of impact at surface level. Capable of producing damaging winds, it may sometimes be confused with a tornado, where high-velocity winds circle a central area, and air moves inward and upward. These usually last for seconds to minutes. Downbursts are particularly strong downdrafts within thunderstorms (or deep, moist convection as sometimes downbursts emanate from cumulonimbus or even cumulus congestus clouds that are not producing lightning).

Downbursts are most often created by an area of significantly precipitation-cooled air that, after reaching the surface (subsiding), spreads out in all directions producing strong winds. Dry downbursts are associated with thunderstorms that exhibit very little rain, while wet downbursts are created by thunderstorms with significant amounts of precipitation. Microbursts and macrobursts are downbursts at very small and larger scales, respectively. A rare variety of dry downburst, the heat burst, is created by vertical currents on the backside of old outflow boundaries and squall lines where rainfall is lacking. Heat bursts generate significantly higher temperatures due to the lack of rain-cooled air in their formation and compressional heating during descent. Downbursts create vertical wind shear, which is dangerous to aviation, especially during landing (or takeoff). Several fatal and historic crashes in past decades are attributed to the phenomenon and flight crew training goes to great lengths on how to properly recognize and recover from a downburst/wind shear event; wind shear recovery, among other adverse weather events, are standard topics across the world in flight simulator training that flight crews receive and must successfully complete. Detection and nowcasting technology was also implemented in much of the world and particularly around major airports, which in many cases actually have wind shear detection equipment on the field. This detection equipment helps air traffic controllers and pilots make decisions on the safety and feasibility of operating on or in the vicinity of the airport during storms. 

Definition

Downburst damages in a straight line

A downburst is created by a column of sinking air that after hitting the surface spreads out in all directions and is capable of producing damaging straight-line winds of over 240 km/h (150 mph), often producing damage similar to, but distinguishable from, that caused by tornadoes. Downburst damage radiates from a central point as the descending column spreads out when hitting the surface, whereas tornado damage tends towards convergent damage consistent with rotating winds. To differentiate between tornado damage and damage from a downburst, the term straight-line winds is applied to damage from microbursts.

Downbursts in air that is precipitation free or contains virga are known as dry downbursts; those accompanied with precipitation are known as wet downbursts. These generally are formed by precipitation-cooled air rushing to the surface, but they perhaps also could be powered by strong winds aloft being deflected toward the surface by dynamical processes in a thunderstorm (see rear flank downdraft). Most downbursts are less than 4 km (2.5 mi) in extent: these are called microbursts. Downbursts larger than 4 km (2.5 mi) in extent are sometimes called macrobursts. Downbursts can occur over large areas. In the extreme case, a series of continuing downbursts results in a derecho, which covers huge areas of more than 320 km (200 mi) wide and over 1,600 km (1,000 mi) long, persisting for 12 hours or more, and which is associated with some of the most intense straight-line winds.

The term microburst was defined by mesoscale meteorology expert Ted Fujita as affecting an area 4 km (2.5 mi) in diameter or less, distinguishing them as a type of downburst and apart from common wind shear which can encompass greater areas. Fujita also coined the term macroburst for downbursts larger than 4 km (2.5 mi).

Dry microbursts

Dry microburst schematic

When rain falls below the cloud base or is mixed with dry air, it begins to evaporate and this evaporation process cools the air. The denser cool air descends and accelerates as it approaches the surface. When the cool air approaches the surface, it spreads out in all directions. High winds spread out in this type of pattern showing little or no curvature are known as straight-line winds.

Dry microbursts are typically produced by high based thunderstorms that contain little to no surface rainfall. They occur in environments characterized by a thermodynamic profile exhibiting an inverted-V at thermal and moisture profile, as viewed on a Skew-T log-P thermodynamic diagram. Wakimoto (1985) developed a conceptual model (over the High Plains of the United States) of a dry microburst environment that comprised three important variables: mid-level moisture, cloud base in the mid troposphere, and low surface relative humidity. These conditions evaporate the moisture from the air as it falls, cooling the air and making it fall faster because it is more dense.

Wet microbursts

A wet microburst

Wet microbursts are downbursts accompanied by significant precipitation at the surface. These downbursts rely more on the drag of precipitation for downward acceleration of parcels as well as the negative buoyancy which tend to drive "dry" microbursts. As a result, higher mixing ratios are necessary for these downbursts to form (hence the name "wet" microbursts). Melting of ice, particularly hail, appears to play an important role in downburst formation (Wakimoto and Bringi, 1988), especially in the lowest 1 km (0.6 mi) above surface level (Proctor, 1989). These factors, among others, make forecasting wet microbursts difficult.

Characteristic Dry Microburst Wet Microburst
Location of highest probability within the United States Midwest / West Southeast
Precipitation Little or none Moderate or heavy
Cloud bases As high as 500 hPa (mb) As high as 850 hPa (mb)
Features below cloud base Virga Precipitation shaft
Primary catalyst Evaporative cooling Precipitation loading and evaporative cooling
Environment below cloud base Deep dry layer/low relative humidity/dry adiabatic lapse rate Shallow dry layer/high relative humidity/moist adiabatic lapse rate

Straight-line winds

Straight-line winds (also known as plough winds, thundergusts and hurricanes of the prairie) are very strong winds that can produce damage, demonstrating a lack of the rotational damage pattern associated with tornadoes. Straight-line winds are common with the gust front of a thunderstorm or originate with a downburst from a thunderstorm. These events can cause considerable damage, even in the absence of a tornado. The winds can gust to 58 m/s (130 mph) and winds of 26 m/s (58 mph) or more can last for more than twenty minutes. In the United States, such straight-line wind events are most common during the spring when instability is highest and weather fronts routinely cross the country. Straight-line wind events in the form of derechos can take place throughout the eastern half of the U.S.

Straight-line winds may be damaging to marine interests. Small ships, cutters and sailboats are at risk from this meteorological phenomenon.

Formation

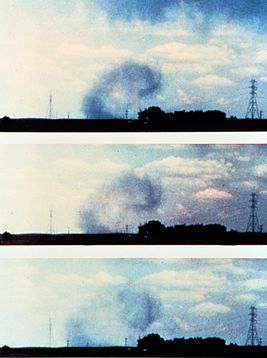
The formation of a downburst starts with hail or large raindrops falling through drier air. Hailstones melt and raindrops evaporate, pulling latent heat from surrounding air and cooling it considerably. Cooler air has a higher density than the warmer air around it, so it sinks to the surface. As the cold air hits the ground or water it spreads out and a mesoscale front can be observed as a gust front. Areas under and immediately adjacent to the downburst are the areas which receive the highest winds and rainfall, if any is present. Also, because the rain-cooled air is descending from the middle troposphere, a significant drop in temperatures is noticed. Due to interaction with the surface, the downburst quickly loses strength as it fans out and forms the distinctive "curl shape" that is commonly seen at the periphery of the microburst (see image). Downbursts usually last only a few minutes and then dissipate, except in the case of squall lines and derecho events. However, despite their short lifespan, microbursts are a serious hazard to aviation and property and can result in substantial damage to the area.

Downbursts go through three stages in their cycle: the downburst, outburst, and cushion stages.

Development stages of microbursts

The evolution of microbursts is broken down into three stages: the contact stage, the outburst stage, and the cushion stage:

  • A downburst initially develops as the downdraft begins its descent from the cloud base. The downdraft accelerates, and within minutes reaches the surface (contact stage).
  • During the outburst stage, the wind "curls" as the cold air of the downburst moves away from the point of impact with the surface.
  • During the cushion stage, winds about the curl continue to accelerate, while the winds at the surface slow due to friction.

On a weather radar Doppler display, a downburst is seen as a couplet of radial winds in the outburst and cushion stages. The rightmost image shows such a display from the ARMOR Doppler Weather Radar in Huntsville, Alabama in 2012. The radar is on the right side of the image and the downburst is along the line separating the velocity towards the radar (green), and the one moving away (red).

Physical processes of dry and wet microbursts

Basic physical processes using simplified buoyancy equations

Start by using the vertical momentum equation:

By decomposing the variables into a basic state and a perturbation, defining the basic states, and using the ideal gas law (), then the equation can be written in the form

where B is buoyancy. The virtual temperature correction usually is rather small and to a good approximation; it can be ignored when computing buoyancy. Finally, the effects of precipitation loading on the vertical motion are parametrized by including a term that decreases buoyancy as the liquid water mixing ratio () increases, leading to the final form of the parcel's momentum equation:

The first term is the effect of perturbation pressure gradients on vertical motion. In some storms this term has a large effect on updrafts (Rotunno and Klemp, 1982) but there is not much reason to believe it has much of an impact on downdrafts (at least to a first approximation) and therefore will be ignored.

The second term is the effect of buoyancy on vertical motion. Clearly, in the case of microbursts, one expects to find that B is negative meaning the parcel is cooler than its environment. This cooling typically takes place as a result of phase changes (evaporation, melting, and sublimation). Precipitation particles that are small, but are in great quantity, promote a maximum contribution to cooling and, hence, to creation of negative buoyancy. The major contribution to this process is from evaporation.

The last term is the effect of water loading. Whereas evaporation is promoted by large numbers of small droplets, it only requires a few large drops to contribute substantially to the downward acceleration of air parcels. This term is associated with storms having high precipitation rates. Comparing the effects of water loading to those associated with buoyancy, if a parcel has a liquid water mixing ratio of 1.0 g kg−1, this is roughly equivalent to about 0.3 K of negative buoyancy; the latter is a large (but not extreme) value. Therefore, in general terms, negative buoyancy is typically the major contributor to downdrafts.

Negative vertical motion associated only with buoyancy

Using pure "parcel theory" results in a prediction of the maximum downdraft of

where NAPE is the negative available potential energy,

and where LFS denotes the level of free sink for a descending parcel and SFC denotes the surface. This means that the maximum downward motion is associated with the integrated negative buoyancy. Even a relatively modest negative buoyancy can result in a substantial downdraft if it is maintained over a relatively large depth. A downward speed of 25 m/s (56 mph; 90 km/h) results from the relatively modest NAPE value of 312.5 m2 s−2. To a first approximation, the maximum gust is roughly equal to the maximum downdraft speed.

Heat bursts

A special, and much rarer, kind of downburst is a heat burst, which results from precipitation-evaporated air compressionally heating as it descends from very high altitude, usually on the backside of a dying squall line or outflow boundary. Heat bursts are chiefly a nocturnal occurrence, can produce winds over 160 km/h (100 mph), are characterized by exceptionally dry air, can suddenly raise the surface temperature to 38 °C (100 °F) or more, and sometimes persist for several hours.

Danger to aviation

A series of photographs of the surface curl soon after a microburst impacted the surface

Downbursts, particularly microbursts, are exceedingly dangerous to aircraft which are taking off or landing due to the strong vertical wind shear caused by these events. Several fatal crashes are attributed to downbursts.

The following are some fatal crashes and/or aircraft incidents that have been attributed to microbursts in the vicinity of airports:

A microburst often causes aircraft to crash when they are attempting to land or shortly after takeoff (American Airlines Flight 63 and Delta Air Lines Flight 318 are a notable exception). The microburst is an extremely powerful gust of air that, once hitting the surface, spreads in all directions. As the aircraft is coming in to land, the pilots try to slow the plane to an appropriate speed. When the microburst hits, the pilots will see a large spike in their airspeed, caused by the force of the headwind created by the microburst. A pilot inexperienced with microbursts would try to decrease the speed. The plane would then travel through the microburst, and fly into the tailwind, causing a sudden decrease in the amount of air flowing across the wings. The decrease in airflow over the wings of the aircraft causes a drop in the amount of lift produced. This decrease in lift combined with a strong downward flow of air can cause the thrust required to remain at altitude to exceed what is available, thus causing the aircraft to stall. If the plane is at a low altitude shortly after takeoff or during landing, it will not have sufficient altitude to recover.

The strongest microburst recorded thus far occurred at Andrews Field, Maryland on 1 August 1983, with wind speeds reaching 240.5 km/h (149.4 mph).

Danger to buildings

  • On June 21, 2023, a severe thunderstorm in the Greater Houston area resulted in a powerful downburst. The storm was part of a larger tornado outbreak sequence that occurred from June 20-26, 2023. A record-breaking wind gust of 97 mph (156 km/h) was observed at George Bush Intercontinental Airport, surpassing the previous record of 82 mph (132 km/h) recorded during Hurricane Ike in 2008. The aftermath left approximately 324,000 customers without power and caused extensive damage to CenterPoint Energy's equipment and infrastructure. The storm caused significant damage to buildings, with at least 243 homes damaged. The storm was strong enough to flip a small plane and push another off the tarmac at Hooks Airport in northwest Harris County.
  • On 21 May 2022, a particularly intense downburst was responsible for damage in Ottawa, Ontario, Canada. Maximum wind speeds reaching 190 km/h (120 mph) were surveyed and analyzed by the Northern Tornados Project, in an area measuring approximately 36 km (22 mi) long and 5 km (3 mi) wide. 10 people were killed and many communities experienced significant damage and power outages spanning days as a result of the derecho that moved across Ontario and Quebec. It was one of Canada’s most destructive wind storms in its history, with over $875 million in damages across both provinces.
Strong microburst winds flip a several-ton shipping container up the side of a hill, Vaughan, Ontario, Canada
  • On 31 March 2019, a very destructive downburst cluster with characteristics of a small derecho, but too small to satisfy the criteria, impacted across a 33 km (21 mi) wide and 45 km (28 mi) long swath in the Bara and Parsa Districts, Nepal. Occurring at an elevation of 83 to 109 m (270 to 360 ft) amsl around 18:45 local time, the 30-45 min duration winds flattened many and severely damaged numerous buildings, leading to 28 deaths and hundreds of injuries.
  • On 15 May 2018, an extremely powerful front moved through the northeastern United States, specifically New York and Connecticut, causing significant damage. Nearly a half million people lost power and 5 people were killed. Winds were recorded in excess of 100 mph (160 km/h) and several tornadoes and macrobursts were confirmed by the NWS.
  • On 3 April 2018, a wet microburst struck William P. Hobby Airport, Texas at 11:53 PM, causing an aircraft hangar to partially collapse. Six business jets (four stored in the hangar and two outside) were damaged. A severe thunderstorm warning was issued just seconds before the microburst struck.
  • On 23 May 2017, a wet microburst struck Sealy, Texas with 80 to 100 mph (130 to 160 km/h) winds knocking down trees and power lines. Significant damage to structures was reported across Sealy. Twenty students were slightly injured by flying debris while attending a function at Sealy High School.
  • On 9 August 2016, a wet microburst struck the city of Cleveland Heights, Ohio, an eastern suburb of Cleveland. The storm developed very quickly. Thunderstorms developed west of Cleveland at 9 PM, and the National Weather Service issued a severe thunderstorm warning at 9:55 PM. The storm had passed over Cuyahoga County by 10:20 PM. Lightning struck 10 times per minute over Cleveland Heights. and 80 mph (130 km/h) winds knocked down hundreds of trees and utility poles. More than 45,000 people lost power, with damage so severe that nearly 6,000 homes remained without power two days later.
  • On 22 July 2016, a wet microburst hit portions of Kent and Providence Counties in Rhode Island, causing wind damage in the cities of Cranston, Rhode Island and West Warwick, Rhode Island. Numerous fallen trees were reported, as well as downed powerlines and minimal property damage. Thousands of people were without power for several days, even as long as over 4 days. The storm occurred late at night, and no injuries were reported.
  • On 23 June 2015, a macroburst hit portions of Gloucester and Camden Counties in New Jersey causing widespread damage mostly due to falling trees. Electrical utilities were affected for several days causing protracted traffic signal disruption and closed businesses.
  • On 23 August 2014, a dry microburst hit Mesa, Arizona. It ripped the roof off of half a building and a shed, nearly damaging the surrounding buildings. No serious injuries were reported.
  • On 21 December 2013 a wet microburst hit Brunswick, Ohio. The roof was ripped off of a local business; the debris damaged several houses and cars near the business. Due to the time, between 1 am and 2 am, there were no injuries.
  • On 9 July 2012, a wet microburst hit an area of Spotsylvania County, Virginia near the border of the city of Fredericksburg, causing severe damage to two buildings. One of the buildings was a children's cheerleading center. Two serious injuries were reported.
  • On 22 June 2012, a wet microburst hit the town of Bladensburg, Maryland, causing severe damage to trees, apartment buildings, and local roads. The storm caused an outage in which 40,000 customers lost power.
  • On 8 September 2011, at 5:01 PM, a dry microburst hit Nellis Air Force Base, Nevada causing several aircraft shelters to collapse. Multiple aircraft were damaged and eight people were injured.
  • On 18 August 2011, a wet microburst hit the musical festival Pukkelpop in Hasselt, causing severe localized damage. Five people were killed and at least 140 people were injured. Later research showed that the wind reached speeds of 170 km/h (110 mph).
  • On 22 September 2010, in the Hegewisch neighborhood of Chicago, a wet microburst hit, causing severe localized damage and localized power outages, including fallen-tree impacts into at least four homes. No fatalities were reported.
  • On 16 September 2010, just after 5:30 PM, a wet macroburst with winds of 125 mph (200 km/h) hit parts of Central Queens in New York City, causing extensive damage to trees, buildings, and vehicles in an area 8 miles long and 5 miles wide. Approximately 3,000 trees were knocked down by some reports. There was one fatality when a tree fell onto a car on the Grand Central Parkway.
  • On 24 June 2010, shortly after 4:30 PM, a wet microburst hit the city of Charlottesville, Virginia. Field reports and damage assessments show that Charlottesville experienced numerous downbursts during the storm, with wind estimates at over 75 mph (120 km/h). In a matter of minutes, trees and downed power lines littered the roadways. A number of houses were hit by trees. Immediately after the storm, up to 60,000 Dominion Power customers in Charlottesville and surrounding Albemarle County were without power.
  • On 11 June 2010, around 3:00 AM, a wet microburst hit a neighborhood in southwestern Sioux Falls, South Dakota. It caused major damage to four homes, all of which were occupied. No injuries were reported. Roofs were blown off of garages and walls were flattened by the estimated 100 mph (160 km/h) winds. The cost of repairs was thought to be $500,000 or more.
  • On 2 May 2009, the lightweight steel and mesh building in Irving, Texas used for practice by the Dallas Cowboys football team was flattened by a microburst, according to the National Weather Service.
  • On 12 March 2006, a microburst hit Lawrence, Kansas. 60 percent of the University of Kansas campus buildings sustained some form of damage from the storm. Preliminary estimates put the cost of repairs at between $6 million and $7 million.
  • On 13 May 1989, a microburst with winds over 95 mph (150 km/h) hit Fort Hood, Texas. Over 200 U.S. Army helicopters were damaged. The storm damaged at least 20 percent of the fort's buildings, forcing 25 military families from their quarters. In a preliminary damage estimate, the Army said repairs to almost 200 helicopters would cost $585 million and repairs to buildings and other facilities about $15 million.
  • On May 9, 1980, a microburst at the leading edge of an advancing cold front struck the 606 ft (185 m) freighter MV Summit Venture just as it was about to pass through the narrow channel under the Sunshine Skyway Bridge over Tampa Bay. Sudden torrential rain cut visibility to zero and straight-line winds estimated at over 70 mph (110 km/h) pushed the ship into a support pier, causing the catastrophic collapse of the southbound span and 35 deaths as several private vehicles and a Greyhound Bus plummeted 150 ft (46 m) into the water..
  • On 4 July 1977, the Independence Day Derecho of 1977 formed over west-central Minnesota. As the derecho moved east-southeast, it became very intense over central Minnesota around midday. From that time through the afternoon the system produced winds of 80 to more than 100 mph (160 km/h), with areas of extreme damage from central Minnesota into northern Wisconsin. The derecho continued rapidly southeast before finally weakening over northern Ohio.

Model predictive control

From Wikipedia, the free encyclopedia

Model predictive control (MPC) is an advanced method of process control that is used to control a process while satisfying a set of constraints. It has been in use in the process industries in chemical plants and oil refineries since the 1980s. In recent years it has also been used in power system balancing models and in power electronics. Model predictive controllers rely on dynamic models of the process, most often linear empirical models obtained by system identification. The main advantage of MPC is the fact that it allows the current timeslot to be optimized, while keeping future timeslots in account. This is achieved by optimizing a finite time-horizon, but only implementing the current timeslot and then optimizing again, repeatedly, thus differing from a linear–quadratic regulator (LQR). Also MPC has the ability to anticipate future events and can take control actions accordingly. PID controllers do not have this predictive ability. MPC is nearly universally implemented as a digital control, although there is research into achieving faster response times with specially designed analog circuitry.

Generalized predictive control (GPC) and dynamic matrix control (DMC) are classical examples of MPC.

Overview

The models used in MPC are generally intended to represent the behavior of complex and simple dynamical systems. The additional complexity of the MPC control algorithm is not generally needed to provide adequate control of simple systems, which are often controlled well by generic PID controllers. Common dynamic characteristics that are difficult for PID controllers include large time delays and high-order dynamics.

MPC models predict the change in the dependent variables of the modeled system that will be caused by changes in the independent variables. In a chemical process, independent variables that can be adjusted by the controller are often either the setpoints of regulatory PID controllers (pressure, flow, temperature, etc.) or the final control element (valves, dampers, etc.). Independent variables that cannot be adjusted by the controller are used as disturbances. Dependent variables in these processes are other measurements that represent either control objectives or process constraints.

MPC uses the current plant measurements, the current dynamic state of the process, the MPC models, and the process variable targets and limits to calculate future changes in the dependent variables. These changes are calculated to hold the dependent variables close to target while honoring constraints on both independent and dependent variables. The MPC typically sends out only the first change in each independent variable to be implemented, and repeats the calculation when the next change is required.

While many real processes are not linear, they can often be considered to be approximately linear over a small operating range. Linear MPC approaches are used in the majority of applications with the feedback mechanism of the MPC compensating for prediction errors due to structural mismatch between the model and the process. In model predictive controllers that consist only of linear models, the superposition principle of linear algebra enables the effect of changes in multiple independent variables to be added together to predict the response of the dependent variables. This simplifies the control problem to a series of direct matrix algebra calculations that are fast and robust.

When linear models are not sufficiently accurate to represent the real process nonlinearities, several approaches can be used. In some cases, the process variables can be transformed before and/or after the linear MPC model to reduce the nonlinearity. The process can be controlled with nonlinear MPC that uses a nonlinear model directly in the control application. The nonlinear model may be in the form of an empirical data fit (e.g. artificial neural networks) or a high-fidelity dynamic model based on fundamental mass and energy balances. The nonlinear model may be linearized to derive a Kalman filter or specify a model for linear MPC.

An algorithmic study by El-Gherwi, Budman, and El Kamel shows that utilizing a dual-mode approach can provide significant reduction in online computations while maintaining comparative performance to a non-altered implementation. The proposed algorithm solves N convex optimization problems in parallel based on exchange of information among controllers.

Theory behind MPC

A discrete MPC scheme.

MPC is based on iterative, finite-horizon optimization of a plant model. At time the current plant state is sampled and a cost minimizing control strategy is computed (via a numerical minimization algorithm) for a relatively short time horizon in the future: . Specifically, an online or on-the-fly calculation is used to explore state trajectories that emanate from the current state and find (via the solution of Euler–Lagrange equations) a cost-minimizing control strategy until time . Only the first step of the control strategy is implemented, then the plant state is sampled again and the calculations are repeated starting from the new current state, yielding a new control and new predicted state path. The prediction horizon keeps being shifted forward and for this reason MPC is also called receding horizon control. Although this approach is not optimal, in practice it has given very good results. Much academic research has been done to find fast methods of solution of Euler–Lagrange type equations, to understand the global stability properties of MPC's local optimization, and in general to improve the MPC method.

Principles of MPC

Model predictive control is a multivariable control algorithm that uses:

  • an internal dynamic model of the process
  • a cost function J over the receding horizon
  • an optimization algorithm minimizing the cost function J using the control input u

An example of a quadratic cost function for optimization is given by:

without violating constraints (low/high limits) with

: th controlled variable (e.g. measured temperature)
: th reference variable (e.g. required temperature)
: th manipulated variable (e.g. control valve)
: weighting coefficient reflecting the relative importance of
: weighting coefficient penalizing relative big changes in

etc.

Nonlinear MPC

Nonlinear model predictive control, or NMPC, is a variant of model predictive control that is characterized by the use of nonlinear system models in the prediction. As in linear MPC, NMPC requires the iterative solution of optimal control problems on a finite prediction horizon. While these problems are convex in linear MPC, in nonlinear MPC they are not necessarily convex anymore. This poses challenges for both NMPC stability theory and numerical solution.

The numerical solution of the NMPC optimal control problems is typically based on direct optimal control methods using Newton-type optimization schemes, in one of the variants: direct single shooting, direct multiple shooting methods, or direct collocation. NMPC algorithms typically exploit the fact that consecutive optimal control problems are similar to each other. This allows to initialize the Newton-type solution procedure efficiently by a suitably shifted guess from the previously computed optimal solution, saving considerable amounts of computation time. The similarity of subsequent problems is even further exploited by path following algorithms (or "real-time iterations") that never attempt to iterate any optimization problem to convergence, but instead only take a few iterations towards the solution of the most current NMPC problem, before proceeding to the next one, which is suitably initialized. Another promising candidate for the nonlinear optimization problem is to use a randomized optimization method. Optimum solutions are found by generating random samples that satisfy the constraints in the solution space and finding the optimum one based on cost function. 

While NMPC applications have in the past been mostly used in the process and chemical industries with comparatively slow sampling rates, NMPC is being increasingly applied, with advancements in controller hardware and computational algorithms, e.g., preconditioning, to applications with high sampling rates, e.g., in the automotive industry, or even when the states are distributed in space (Distributed parameter systems). As an application in aerospace, recently, NMPC has been used to track optimal terrain-following/avoidance trajectories in real-time.

Explicit MPC

Explicit MPC (eMPC) allows fast evaluation of the control law for some systems, in stark contrast to the online MPC. Explicit MPC is based on the parametric programming technique, where the solution to the MPC control problem formulated as optimization problem is pre-computed offline. This offline solution, i.e., the control law, is often in the form of a piecewise affine function (PWA), hence the eMPC controller stores the coefficients of the PWA for each a subset (control region) of the state space, where the PWA is constant, as well as coefficients of some parametric representations of all the regions. Every region turns out to geometrically be a convex polytope for linear MPC, commonly parameterized by coefficients for its faces, requiring quantization accuracy analysis. Obtaining the optimal control action is then reduced to first determining the region containing the current state and second a mere evaluation of PWA using the PWA coefficients stored for all regions. If the total number of the regions is small, the implementation of the eMPC does not require significant computational resources (compared to the online MPC) and is uniquely suited to control systems with fast dynamics. A serious drawback of eMPC is exponential growth of the total number of the control regions with respect to some key parameters of the controlled system, e.g., the number of states, thus dramatically increasing controller memory requirements and making the first step of PWA evaluation, i.e. searching for the current control region, computationally expensive.

Robust MPC

Robust variants of model predictive control are able to account for set bounded disturbance while still ensuring state constraints are met. Some of the main approaches to robust MPC are given below.

  • Min-max MPC. In this formulation, the optimization is performed with respect to all possible evolutions of the disturbance. This is the optimal solution to linear robust control problems, however it carries a high computational cost. The basic idea behind the min/max MPC approach is to modify the on-line "min" optimization to a "min-max" problem, minimizing the worst case of the objective function, maximized over all possible plants from the uncertainty set.
  • Constraint Tightening MPC. Here the state constraints are enlarged by a given margin so that a trajectory can be guaranteed to be found under any evolution of disturbance.
  • Tube MPC. This uses an independent nominal model of the system, and uses a feedback controller to ensure the actual state converges to the nominal state. The amount of separation required from the state constraints is determined by the robust positively invariant (RPI) set, which is the set of all possible state deviations that may be introduced by disturbance with the feedback controller.
  • Multi-stage MPC. This uses a scenario-tree formulation by approximating the uncertainty space with a set of samples and the approach is non-conservative because it takes into account that the measurement information is available at every time stage in the prediction and the decisions at every stage can be different and can act as recourse to counteract the effects of uncertainties. The drawback of the approach however is that the size of the problem grows exponentially with the number of uncertainties and the prediction horizon.
  • Tube-enhanced multi-stage MPC. This approach synergizes multi-stage MPC and tube-based MPC. It provides high degrees of freedom to choose the desired trade-off between optimality and simplicity by the classification of uncertainties and the choice of control laws in the predictions.

Commercially available MPC software

Commercial MPC packages are available and typically contain tools for model identification and analysis, controller design and tuning, as well as controller performance evaluation.

A survey of commercially available packages has been provided by S.J. Qin and T.A. Badgwell in Control Engineering Practice 11 (2003) 733–764.

MPC vs. LQR

Model predictive control and linear-quadratic regulators are both expressions of optimal control, with different schemes of setting up optimisation costs.

While a model predictive controller often looks at fixed length, often graduatingly weighted sets of error functions, the linear-quadratic regulator looks at all linear system inputs and provides the transfer function that will reduce the total error across the frequency spectrum, trading off state error against input frequency.

Due to these fundamental differences, LQR has better global stability properties, but MPC often has more locally optimal[?] and complex performance.

The main differences between MPC and LQR are that LQR optimizes across the entire time window (horizon) whereas MPC optimizes in a receding time window, and that with MPC a new solution is computed often whereas LQR uses the same single (optimal) solution for the whole time horizon. Therefore, MPC typically solves the optimization problem in a smaller time window than the whole horizon and hence may obtain a suboptimal solution. However, because MPC makes no assumptions about linearity, it can handle hard constraints as well as migration of a nonlinear system away from its linearized operating point, both of which are major drawbacks to LQR.

This means that LQR can become weak when operating away from stable fixed points. MPC can chart a path between these fixed points, but convergence of a solution is not guaranteed, especially if thought as to the convexity and complexity of the problem space has been neglected.

Operator (computer programming)

From Wikipedia, the free encyclopedia https://en.wikipedia.org/wiki/Operator_(computer_programmin...