From Wikipedia, the free encyclopedia


The geology of Mars is the scientific study of the surface, crust, and interior of the planet Mars. It emphasizes the composition, structure, history, and physical processes that shape the planet. It is fully analogous to the field of terrestrial geology. In planetary science, the term geology is used in its broadest sense to mean the study of the solid parts of planets and moons. The term incorporates aspects of geophysics, geochemistry, mineralogy, geodesy, and cartography.[2] A neologism, areology, from the Greek word Arēs (Mars), sometimes appears as a synonym for Mars' geology in the popular media and works of science fiction (e.g., Kim Stanley Robinson’s Mars trilogy),[3] but the term is rarely, if ever, used by professional geologists and planetary scientists.[4]
Geologic map of Mars (2014)

Image map of Mars
The following imagemap of the planet Mars has embedded links to geographical features in addition to the noted Rover and Lander locations. Click on the features and you will be taken to the corresponding article pages. North is at the top; Elevations: red (higher), yellow (zero), blue (lower).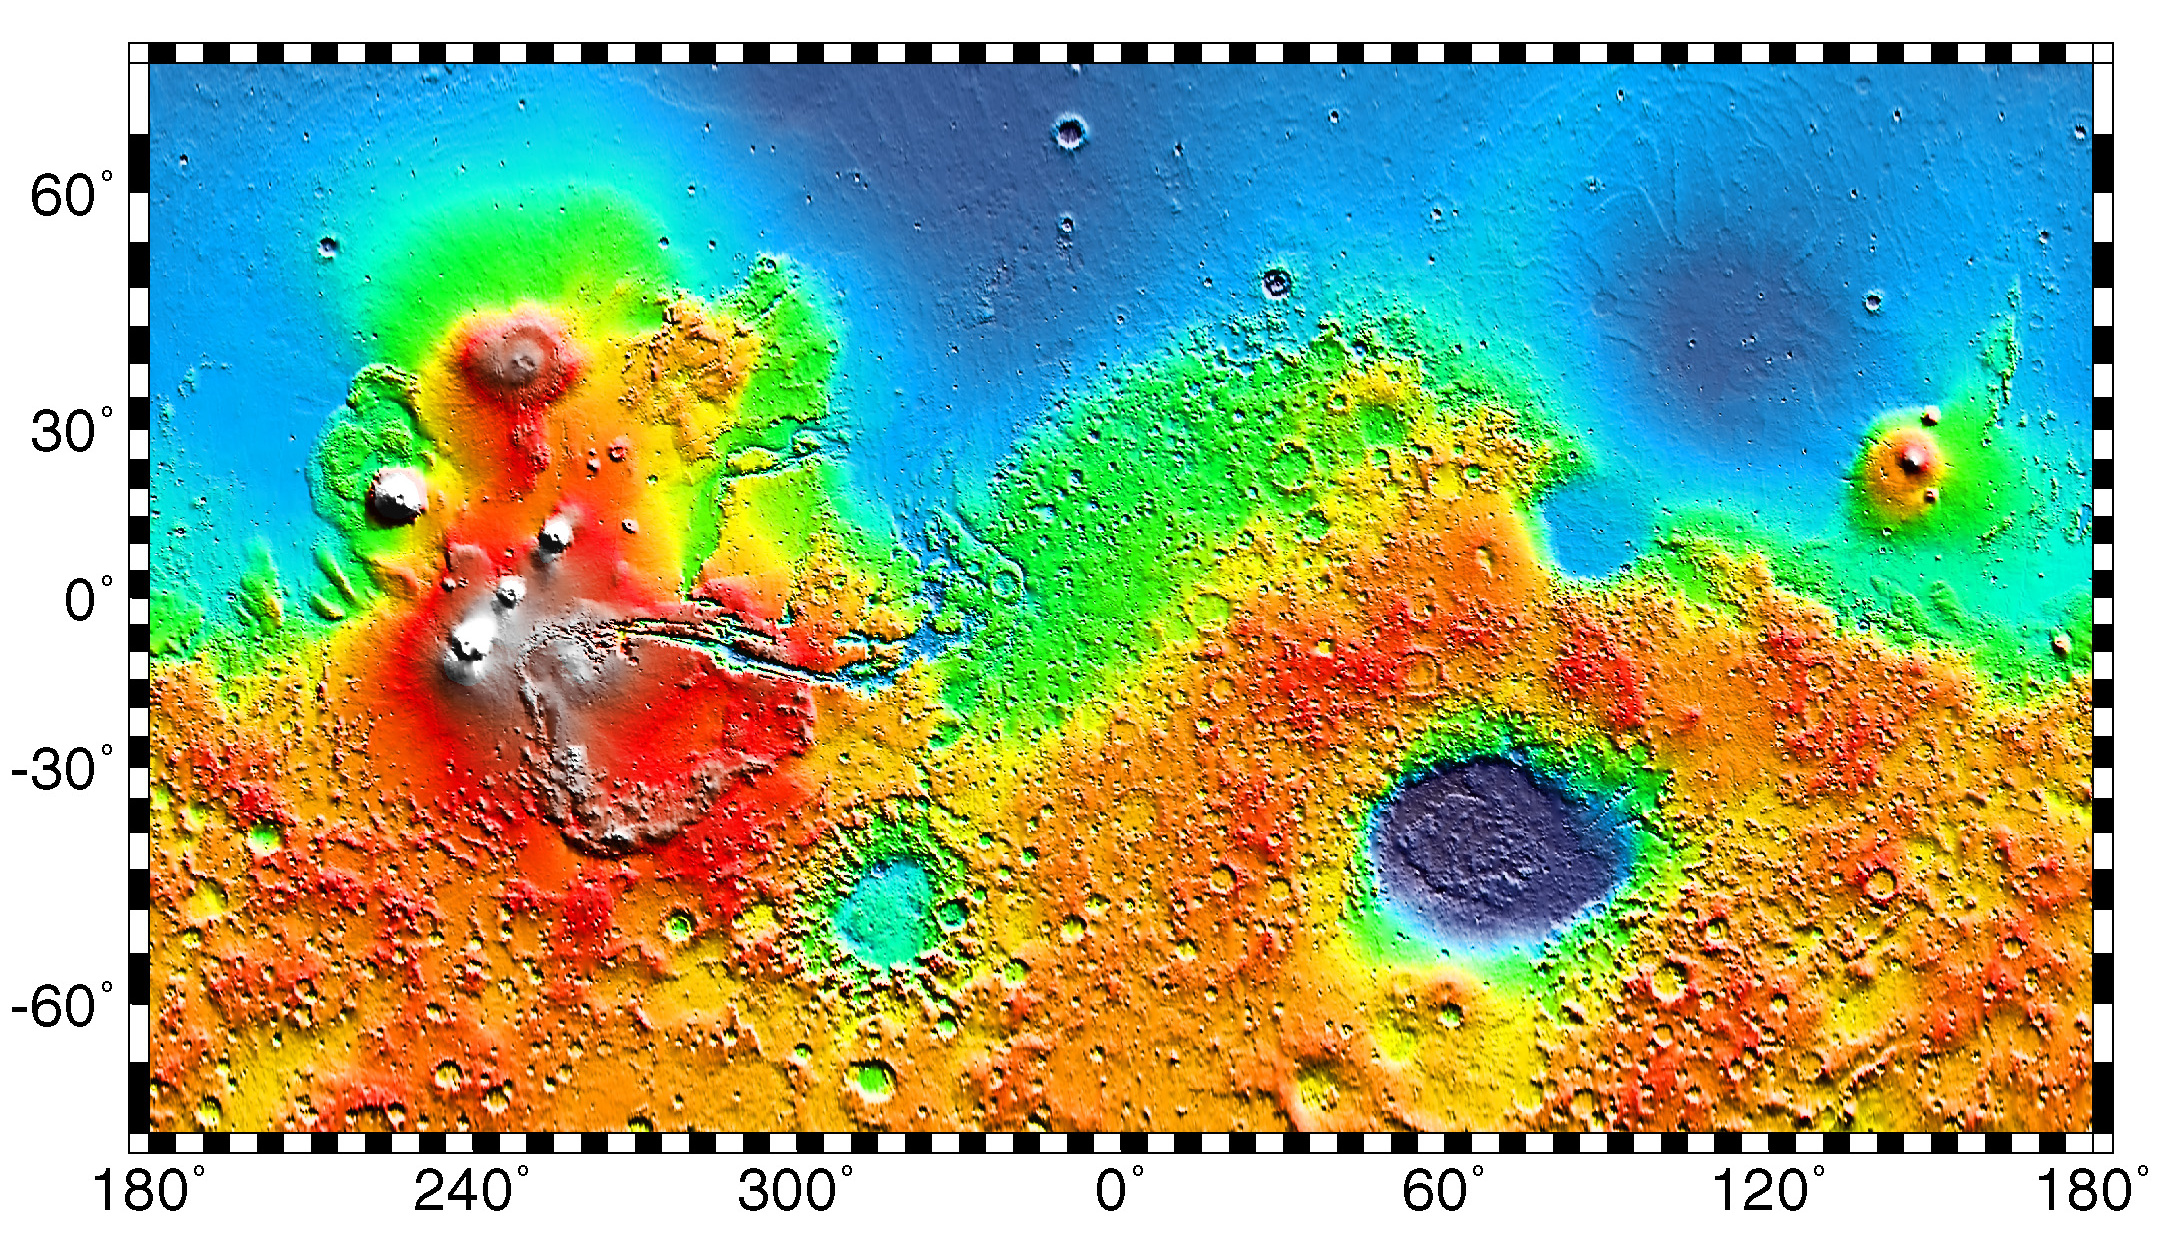

Composition of Mars
Mars is a terrestrial, differentiated planet.Global physiography
Most of our current knowledge about the geology of Mars comes from studying landforms and relief features (terrain) seen in images taken by orbiting spacecraft. Mars has a number of distinct, large-scale surface features that indicate the types of geological processes that have operated on the planet over time. This section introduces several of the larger physiographic regions of Mars. Together, these regions illustrate how geologic processes involving volcanism, tectonism, water, ice, and impacts have shaped the planet on a global scale.Hemispheric dichotomy
Main article: Martian dichotomy

Mars Orbital Laser Altimeter (MOLA) colorized shaded-relief maps showing elevations in the western and eastern hemispheres of Mars. (Left): The western hemisphere is dominated by the Tharsis region (red and brown). Tall volcanoes appear white. Valles Marineris (blue) is the long gash-like feature to the right. (Right): Eastern hemisphere shows the cratered highlands (yellow to red) with the Hellas basin (deep blue/purple) at lower left. The Elysium province is at the upper right edge. Areas north of the dichotomy boundary appear as shades of blue on both maps.
The northern and southern hemispheres of Mars are strikingly different from each other in topography and physiography. This dichotomy is a fundamental global geologic feature of the planet. Simply stated, the northern part of the planet is an enormous topographic depression. About one-third of the planet’s surface (mostly in the northern hemisphere) lies 3–6 km lower in elevation than the southern two-thirds. This is a first-order relief feature on par with the elevation difference between Earth’s continents and ocean basins.[8] The dichotomy is also expressed in two other ways: as a difference in impact crater density and crustal thickness between the two hemispheres.[9] The hemisphere south of the dichotomy boundary (often called the southern highlands or uplands) is very heavily cratered and ancient, characterized by rugged surfaces that date back to the period of heavy bombardment. In contrast, the lowlands north of the dichotomy boundary have few large craters, are very smooth and flat, and have other features indicating that extensive resurfacing has occurred since the southern highlands formed. The third distinction between the two hemispheres is in crustal thickness. Topographic and geophysical gravity data indicate that the crust in the southern highlands has a maximum thickness of about 58 km (36 mi), while crust in the northern lowlands "peaks" at around 32 km (20 mi) in thickness.[10][11] The location of the dichotomy boundary varies in latitude across Mars and depends on which of the three physical expressions of the dichotomy is being considered.
The origin and age of the hemispheric dichotomy are still debated. Hypotheses of origin generally fall into two categories: one, the dichotomy was produced by a mega-impact event or several large impacts early in the planet’s history (exogenic theories)[12][13][14] or two, the dichotomy was produced by crustal thinning in the northern hemisphere by mantle convection, overturning, or other chemical and thermal processes in the planet’s interior (endogenic theories).[15][16] One endogenic model proposes an early episode of plate tectonics producing a thinner crust in the north, similar to what is occurring at spreading plate boundaries on Earth.[17] Whatever its origin, the Martian dichotomy appears to be extremely old. Laser altimeter and radar sounding data from orbiting spacecraft have identified a large number of basin-sized structures previously hidden in visual images. Called quasi-circular depressions (QCDs), these features likely represent derelict impact craters from the period of heavy bombardment that are now covered by a veneer of younger deposits. Crater counting studies of QCDs suggest that the underlying surface in the northern hemisphere is at least as old as the oldest exposed crust in the southern highlands.[18] The ancient age of the dichotomy places a significant constraint on theories of its origin.[19]
Tharsis and Elysium volcanic provinces
Straddling the dichotomy boundary in Mars’ western hemisphere is a massive volcano-tectonic province known as the Tharsis region or the Tharsis bulge. This immense, elevated structure is thousands of kilometers in diameter and covers up to 25% of the planet’s surface.[20] Averaging 7–10 km above datum (Martian "sea" level), Tharsis contains the highest elevations on the planet and the largest known volcanoes in the Solar System. Three enormous volcanoes, Ascraeus Mons, Pavonis Mons, and Arsia Mons (collectively known as the Tharsis Montes), sit aligned NE-SW along the crest of the buldge. The vast Alba Mons (formerly Alba Patera) occupies the northern part of the region. The huge shield volcano Olympus Mons lies off the main buldge, at the western edge of the province. The extreme massiveness of Tharsis has placed tremendous stresses on the planet’s lithosphere. As a result, immense extensional fractures (grabens and rift valleys) radiate outward from Tharsis, extending halfway around the planet.[21]A smaller volcanic center lies several thousand kilometers west of Tharsis in Elysium. The Elysium volcanic complex is about 2,000 kilometers in diameter and consists of three main volcanoes, Elysium Mons, Hecates Tholus, and Albor Tholus. The Elysium group of volcanoes is thought to be somewhat different from the Tharsis Montes, in that development of the former involved both lavas and pyroclastics.[22]
Large impact basins
Several enormous, circular impact basins are present on Mars. The largest one that is readily visible is the Hellas basin located in the southern hemisphere, it is the second largest confirmed impact structure on the planet, centered at about 64°E longitude and 40°S latitude. The central part of the basin (Hellas Planitia) is 1,800 km in diameter[23] and surrounded by a broad, heavily eroded annular rim structure characterized by closely spaced rugged irregular mountains (massifs), which probably represent uplifted, jostled blocks of old pre-basin crust.[24] (See Anseris Mons, for example.)Ancient, low-relief volcanic constructs (highland paterae) are located on the northeastern and southwestern portions of the rim. The basin floor contains thick, structurally complex sedimentary deposits that have a long geologic history of deposition, erosion, and internal deformation. The lowest elevations on the planet are located within the Hellas basin, with some areas of the basin floor lying over 8 km below datum.[25]
The two other large impact structures on the planet are the Argyre and Isidis basins. Like Hellas, Argyre (800 km in diameter) is located in the southern highlands and is surrounded by a broad ring of mountains. The mountains in the southern portion of the rim, Charitum Montes, may have been eroded by valley glaciers and ice sheets at some point in Mars’ history.[26] The Isidis basin (roughly 1,000 km in diameter) lies on the dichotomy boundary at about 87°E longitude. The northeastern portion of the basin rim has been eroded and is now buried by northern plains deposits, giving the basin a semicircular outline. The northwestern rim of the basin is characterized by arcuate grabens (Nili Fossae) that are circumferential to the basin. One additional large basin, Utopia, is completely buried by northern plains deposits. Its outline is clearly discernable only from altimetry data. All of the large basins on Mars are extremely old, dating back to the late heavy bombardment. They are thought to be comparable in age to the Imbrium and Orientale basins on the Moon.
Equatorial canyon system

Near the equator in the western hemisphere lies an immense system of deep, interconnected canyons and troughs collectively known as the Valles Marineris. The canyon system extends eastward from Tharsis for a length of over 4,000 km, nearly a quarter of the planet’s circumference. If placed on Earth, Valles Marineris would span the width of North America.[27] In places, the canyons are up to 300 km wide and 10 km deep. Often compared to Earth’s Grand Canyon, the Valles Marineris has a very different origin than its tinier, so-called counterpart on Earth. The Grand Canyon is largely a product of water erosion. The Martian equatorial canyons were of tectonic origin, i.e. they were formed mostly by faulting. They could be similar to the East African Rift valleys.[28] The canyons represent the surface expression of powerful extensional strain in the Martian crust, probably due to loading from the Tharsis bulge.[29]
Chaotic terrain and outflow channels
The terrain at the eastern end of the Valles Marineris grades into dense jumbles of low rounded hills that seem to have formed by the collapse of upland surfaces to form broad, rubble-filled hollows.[30]Called chaotic terrain, these areas mark the heads of huge outflow channels that emerge full size from the chaotic terrain and empty (debouch) northward into Chryse Planitia. The presence of streamlined islands and other geomorphic features indicate that the channels were most likely formed by catastrophic releases of water from aquifers or the melting of subsurface ice. The channels, which include Ares, Shalbatana, Simud, and Tiu Valles, are enormous by terrestrial standards, and the flows that formed them correspondingly immense. For example, the peak discharge required to carve the 28-km-wide Ares Vallis is estimated to have been 500 million cubic feet per second, over ten thousand times the average discharge of the Mississippi River.[31]

Mars Orbital Laser Altimeter (MOLA) derived image of Planum Boreum. Vertical exaggeration is extreme. Note that residual ice cap is only the thin veneer (shown in white) on top of the plateau.
Ice caps
The polar ice caps are well-known telescopic features of Mars, first identified by Christiaan Huygens in 1672.[32] Since the 1960s, we have known that the seasonal caps (those seen in the telescope to grow and wane seasonally) are composed of carbon dioxide (CO2) ice that condenses out of the atmosphere as temperatures fall to 148 K, the frost point of CO2, during the polar wintertime.[33] In the north, the CO2 ice completely dissipates (sublimes) in summer, leaving behind a residual cap of water (H2O) ice. At the south pole, a small residual cap of CO2 ice remains in summer.Both residual ice caps overlie thick layered deposits of interbedded ice and dust. In the north, the layered deposits form a 3 km-high, 1,000 km-diameter plateau called Planum Boreum. A similar kilometers-thick plateau, Planum Australe, lies in the south. Both plana (the Latin plural of planum) are sometimes treated to be synonymous with the "polar ice caps", but the permanent ice (seen as the high albedo, white surfaces in images) forms only a relatively thin mantle on top of the layered deposits. The layered deposits probably represent alternating cycles of dust and ice deposition caused by climate changes related to variations in the planet's orbital parameters over time (see also Milankovitch cycles). The polar layered deposits are some of the youngest geologic units on Mars.
Map of quadrangles
The following imagemap of the planet Mars is divided into the 30 quadrangles defined by the United States Geological Survey[34][35] The quadrangles are numbered with the prefix "MC" for "Mars Chart."[36] Click on the quadrangle and you will be taken to the corresponding article pages. North is at the top;0°N 180°W / 0°N 180°W is at the far left on the equator. The map images were taken by the Mars Global Surveyor.
 WikiMiniAtlas


Mollweide projection of albedo features on Mars from Hubble Space Telescope. Bright ochre areas in left, center, and right are Tharsis, Arabia, and Elysium, respectively. The dark region at top center left is Acidalium Planitia. Syrtis Major is the dark area projecting upward in the center right. Note orographic clouds over Olympus and Elysium Montes (left and right, respectively).
No topography is visible on Mars from Earth. The bright areas and dark markings seen through a telescope are albedo features. The bright, red-ochre areas are locations where fine dust covers the surface. Bright areas (excluding the polar caps and clouds) include Hellas, Tharsis, and Arabia Terra.
The dark gray markings represent areas that the wind has swept clean of dust, leaving behind the lower layer of dark, rocky material. Dark markings are most distinct in a broad belt from 0° to 40° S latitude. However, the most prominent dark marking, Syrtis Major Planum, is in the northern hemisphere.[37] The classical albedo feature, Mare Acidalium (Acidalia Planitia), is another prominent dark area in the northern hemisphere. A third type of area, intermediate in color and albedo, is also present and thought to represent regions containing a mixture of the material from the bright and dark areas.[38]
Impact craters
Impact craters were first identified on Mars by the Mariner 4 spacecraft in 1965.[39] Early observations showed that Martian craters were generally shallower and smoother than lunar craters, indicating that Mars has a more active history of erosion and deposition than the Moon.[40]In other aspects, Martian craters resemble lunar craters. Both are products of hypervelocity impacts and show a progression of morphology types with increasing size. Martian craters below about 7 km in diameter are called simple craters; they are bowl-shaped with sharp raised rims and have depth/diameter ratios of about 1/5.[41] Martian craters change from simple to more complex types at diameters of roughly 5 to 8 km. Complex craters have central peaks (or peak complexes), relatively flat floors, and terracing or slumping along the inner walls. Complex craters are shallower than simple craters in proportion to their widths, with depth/diameter ratios ranging from 1/5 at the simple-to-complex transition diameter (~7 km) to about 1/30 for a 100-km diameter crater. Another transition occurs at crater diameters of around 130 km as central peaks turn into concentric rings of hills to form multi-ring basins.[42]
Mars has the greatest diversity of impact crater types of any planet in the Solar System.[43] This is partly because the presence of both rocky and volatile-rich layers in the subsurface produces a range of morphologies even among craters within the same size classes. Mars also has an atmosphere that plays a role in ejecta emplacement and subsequent erosion. Moreover, Mars has a rate of volcanic and tectonic activity low enough that ancient, eroded craters are still preserved, yet high enough to have resurfaced large areas of the planet, producing a diverse range of crater populations of widely differing ages. Over 42,000 impact craters greater than 5 km in diameter have been catalogued on Mars,[44] and the number of smaller craters is probably innumerable. The density of craters on Mars is highest in the southern hemisphere, south of the dichotomy boundary. This is where most of the large craters and basins are located.
Crater morphology provides information about the physical structure and composition of the surface and subsurface at the time of impact. For example, the size of central peaks in Martian craters is larger than comparable craters on Mercury or the Moon.[45] In addition, the central peaks of many large craters on Mars have pit craters at their summits. Central pit craters are rare on the Moon but are very common on Mars and the icy satellites of the outer Solar System. Large central peaks and the abundance of pit craters probably indicate the presence of near-surface ice at the time of impact.[43] Polewards of 30 degrees of latitude, the form of older impact craters is rounded out ("softened") by acceleration of soil creep by ground ice.[46]
The most notable difference between Martian craters and other craters in the Solar System is the presence of lobate (fludized) ejecta blankets. Many craters at equatorial and mid-latitudes on Mars have this form of ejecta morphology, which is thought to arise when the impacting object melts ice in the subsurface. Liquid water in the ejected material forms a muddy slurry that flows along the surface, producing the characteristic lobe shapes.[47][48] The crater Yuty is a good example of a rampart crater, which is so called because of the rampart-like edge to its ejecta blanket.[49]
-
 HiRISE image of simple rayed crater on southeastern flank of Elysium Mons.
 -
 THEMIS image of complex crater with fluidized ejecta. Note central peak with pit crater.
 -
 Viking orbiter image of Yuty crater showing lobate ejecta.
 -
 THEMIS close-up view of ejecta from 17-km diameter crater at 21°S, 285°E. Note prominent rampart.


Martian craters show a large diversity of preservational states, from extremely fresh to old and eroded. Degraded and infilled impact craters record variations in volcanic, fluvial, and eolian activity over geologic time.[52] Pedestal craters are craters with their ejecta sitting above the surrounding terrain to form raised platforms. They occur because the crater's ejecta forms a resistant layer so that the area nearest the crater erodes more slowly than the rest of the region. Some pedestals are hundreds of meters above the surrounding area, meaning that hundreds of meters of material were eroded away. Pedestal craters were first observed during the Mariner 9 mission in 1972.[53][54][55]
Volcanism[edit]

First X-ray diffraction view of Martian soil - CheMin analysis reveals feldspar, pyroxenes, olivine and more (Curiosity rover at "Rocknest", October 17, 2012).[56]
Volcanic structures and landforms cover large portions of the Martian surface. The most conspicuous volcanoes on Mars occur in Tharsis and Elysium. Geologists think one of the reasons that volcanoes on Mars are able to grow so large is because Mars has sparsely few tectonic boundaries compared to Earth.[57] Lava from a stationary hot spot is able to accumulate at one location on the surface for many hundreds of millions of years.
On October 17, 2012, the Curiosity rover on the planet Mars at "Rocknest" performed the first X-ray diffraction analysis of Martian soil. The results from the rover's CheMin analyzer revealed the presence of several minerals, including feldspar, pyroxenes and olivine, and suggested that the Martian soil in the sample was similar to the "weathered basaltic soils" of Hawaiian volcanoes.[56]
Sedimentology

Flowing water appears to have been common on the surface of Mars at various points in its history, and especially on ancient Mars.[58] Many of these flows carved the surface, forming valley networks and producing sediment. This sediment has been redeposited in a wide variety of wet environments, including in alluvial fans, meandering channels, deltas, lakes, and perhaps even oceans.[59][60] The processes of deposition and transportation are associated with gravity. Due to gravity, related differences in water fluxes and flow speeds, inferred from grain size distributions, Martian landscapes were created by different environmental conditions.[61] Nevertheless, there are other ways of estimating the amount of water on ancient Mars (see: Water on Mars). Groundwater has been implicated in the cementation of aeolian sediments and the formation and transport of a wide variety of sedimentary minerals including clays, sulphates and hematite.[62]
When the surface has been dry, wind has been a major geomorphic agent. Wind driven sand bodies like megaripples and dunes are extremely common on the modern Martian surface, and Opportunity has documented abundant aeolian sandstones on its traverse.[63] Ventifacts, like Jake Matijevic (rock), are an other aeolian landform on the Martian Surface.[64]
A wide variety of other sedimentological facies are also present locally on Mars, including glacial deposits, hot springs, dry mass movement deposits (especially landslides), and cryogenic and periglacial material, amongst many others.[59]
Groundwater on Mars
One group of researchers proposed that some of the layers on Mars were caused by groundwater rising to the surface in many places, especially inside of craters. According to the theory, groundwater with dissolved minerals came to the surface, in and later around craters, and helped to form layers by adding minerals (especially sulfate) and cementing sediments. This hypothesis is supported by a groundwater model and by sulfates discovered in a wide area.[65][66] At first, by examining surface materials with Opportunity Rover, scientists discovered that groundwater had repeatedly risen and deposited sulfates.[62][67][68][69][70] Later studies with instruments on board the Mars Reconnaissance Orbiter showed that the same kinds of materials exist in a large area that included Arabia.[71]Interesting geological features
Avalanches
On February 19, 2008, a geologic event was captured by the HiRISE camera on the Mars Reconnaissance Orbiter. Images that captured a spectacular avalanche thought to be fine grained ice, dust, and large blocks are shown to have fallen from a 700-metre (2,300 ft) high cliff. Evidence of the avalanche are shown by the dust clouds rising from the cliff afterwards.[72] Such geological events are theorized to be the cause of geologic patterns known as slope streaks.-
 Image of the February 19, 2008 Mars avalanche captured by the Mars Reconnaissance Orbiter.
 -
 Closer shot of the avalanche.
 -
 Dust clouds rise above the 700-metre (2,300 ft) deep cliff.
 -
 A photo with scale demonstrates the size of the avalanche.


Possible Caves
NASA scientists studying pictures from the Odyssey spacecraft have spotted what might be seven caves on the flanks of the Arsia Mons volcano on Mars. The pit entrances measure from 100 to 252 metres (328 to 827 ft) wide and they are believed to be at least 73 to 96 metres (240 to 315 ft) deep.See image below: the pits have been informally named (A) Dena, (B) Chloe, (C) Wendy, (D) Annie, (E) Abby (left) and Nikki, and (F) Jeanne. Because light did not reach the floor of most of the pits, it is likely that they extend much deeper than these lower estimates.[citation needed] Dena's floor was observed and found to be 130m deep.[73] Further investigation suggested that these were not necessarily lava tube "skylights".[74] Review of the images has resulted in yet more discoveries of deep pits.[75]
-
 A cave on Mars ("Jeanne") as seen by the Mars Reconnaissance Orbiter.
 -
 HiRISE closeup of Jeanne showing afternoon illumination of the east wall of the shaft.
 -
 THEMIS image of cave entrances on Mars.


Inverted relief
Some areas of Mars show inverted relief, where features that were once depressions, like streams, are now above the surface. It is believed that materials like large rocks were deposited in low-lying areas. Later, wind erosion removed much of the surface layers, but left behind the more resistant deposits. Other ways of making inverted relief might be lava flowing down a stream bed or materials being cemented by minerals dissolved in water. On Earth, materials cemented by silica are highly resistant to all kinds of erosional forces. Examples of inverted channels on Earth are found in the Cedar Mountain Formation near Green River, Utah. Inverted relief in the shape of streams are further evidence of water flowing on the Martian surface in past times.[77] Inverted relief in the form of stream channels suggest that the climate was different—much wetter—when the inverted channels were formed.In an article published in January 2010, a large group of scientists endorsed the idea of searching for life in Miyamoto Crater because of inverted stream channels and minerals that indicated the past presence of water.[78]
Images of other examples of inverted terrain are shown below from various parts of Mars.
-
 Inverted Streams near Juventae Chasma, as seen by Mars Global Surveyor. These streams begin at the top of a ridge then run together.
 -
 Inverted Channel with many branches in Syrtis Major quadrangle.
 -

-
 Inverted Channel in Miyamoto Crater, as seen by HiRISE. Image is located in Margaritifer Sinus quadrangle. The scale bar is 500 meters long.


