Search This Blog

Tuesday, April 7, 2015

Infrared spectroscopy


From Wikipedia, the free encyclopedia

Infrared spectroscopy (IR spectroscopy) is the spectroscopy that deals with the infrared region of the electromagnetic spectrum, that is light with a longer wavelength and lower frequency than visible light. It covers a range of techniques, mostly based on absorption spectroscopy. As with all spectroscopic techniques, it can be used to identify and study chemicals. For a given sample which may be solid, liquid, or gaseous, the method or technique of infrared spectroscopy uses an instrument called an infrared spectrometer (or spectrophotometer) to produce an infrared spectrum. A basic IR spectrum is essentially a graph of infrared light absorbance (or transmittance) on the vertical axis vs. frequency or wavelength on the horizontal axis. Typical units of frequency used in IR spectra are reciprocal centimeters (sometimes called wave numbers), with the symbol cm−1. Units of IR wavelength are commonly given in micrometers (formerly called "microns"), symbol μm, which are related to wave numbers in a reciprocal way. A common laboratory instrument that uses this technique is a Fourier transform infrared (FTIR) spectrometer. Two-dimensional IR is also possible as discussed below.

The infrared portion of the electromagnetic spectrum is usually divided into three regions; the near-, mid- and far- infrared, named for their relation to the visible spectrum. The higher-energy near-IR, approximately 14000–4000 cm−1 (0.8–2.5 μm wavelength) can excite overtone or harmonic vibrations. The mid-infrared, approximately 4000–400 cm−1 (2.5–25 μm) may be used to study the fundamental vibrations and associated rotational-vibrational structure. The far-infrared, approximately 400–10 cm−1 (25–1000 μm), lying adjacent to the microwave region, has low energy and may be used for rotational spectroscopy. The names and classifications of these subregions are conventions, and are only loosely based on the relative molecular or electromagnetic properties.

Theory


Sample of an IR spec. reading; this one is from bromomethane (CH3Br), showing peaks around 3000, 1300, and 1000 cm−1 (on the horizontal axis).

Infrared spectroscopy exploits the fact that molecules absorb specific frequencies that are characteristic of their structure. These absorptions are resonant frequencies, i.e. the frequency of the absorbed radiation matches the transition energy of the bond or group that vibrates. The energies are determined by the shape of the molecular potential energy surfaces, the masses of the atoms, and the associated vibronic coupling.

In particular, in the Born–Oppenheimer and harmonic approximations, i.e. when the molecular Hamiltonian corresponding to the electronic ground state can be approximated by a harmonic oscillator in the neighborhood of the equilibrium molecular geometry, the resonant frequencies are associated with the normal modes corresponding to the molecular electronic ground state potential energy surface. The resonant frequencies are also related to the strength of the bond and the mass of the atoms at either end of it. Thus, the frequency of the vibrations are associated with a particular normal mode of motion and a particular bond type.

Number of vibrational modes

In order for a vibrational mode in a molecule to be "IR active", it must be associated with changes in the dipole. A permanent dipole is not necessary, as the rule requires only a change in dipole moment.[1]

A molecule can vibrate in many ways, and each way is called a vibrational mode. For molecules with N number of atoms in them, linear molecules have 3N – 5 degrees of vibrational modes, whereas nonlinear molecules have 3N – 6 degrees of vibrational modes (also called vibrational degrees of freedom). As an example H2O, a non-linear molecule, will have 3 × 3 – 6 = 3 degrees of vibrational freedom, or modes.

Simple diatomic molecules have only one bond and only one vibrational band. If the molecule is symmetrical, e.g. N2, the band is not observed in the IR spectrum, but only in the Raman spectrum. Asymmetrical diatomic molecules, e.g. CO, absorb in the IR spectrum. More complex molecules have many bonds, and their vibrational spectra are correspondingly more complex, i.e. big molecules have many peaks in their IR spectra.

The atoms in a CH2X2 group, commonly found in organic compounds and where X can represent any other atom, can vibrate in nine different ways. Six of these involve only the CH2 portion: symmetric and antisymmetric stretching, scissoring, rocking, wagging and twisting, as shown below. (Note, that because CH2 is attached to X2 it has 6 modes, unlike H2O, which only has 3 modes. The rocking, wagging, and twisting modes do not exist for H2O, since they are rigid body translations and no relative displacements exist.)

Symmetrical
stretching
Antisymmetrical
stretching

Scissoring
Symmetrical stretching.gif Asymmetrical stretching.gif Scissoring.gif
Rocking Wagging Twisting
Modo rotacao.gif Wagging.gif Twisting.gif

These figures do not represent the "recoil" of the C atoms, which, though necessarily present to balance the overall movements of the molecule, are much smaller than the movements of the lighter H atoms.

Special effects

The simplest and most important IR bands arise from the "normal modes," the simplest distortions of the molecule. In some cases, "overtone bands" are observed. These bands arise from the absorption of a photon that leads to a doubly excited vibrational state. Such bands appear at approximately twice the energy of the normal mode. Some vibrations, so-called 'combination modes," involve more than one normal mode. The phenomenon of Fermi resonance can arise when two modes are similar in energy; Fermi resonance results in an unexpected shift in energy and intensity of the bands etc.

Practical IR spectroscopy

The infrared spectrum of a sample is recorded by passing a beam of infrared light through the sample. When the frequency of the IR is the same as the vibrational frequency of a bond, absorption occurs. Examination of the transmitted light reveals how much energy was absorbed at each frequency (or wavelength). This can be achieved by scanning the wavelength range using a monochromator. Alternatively, the whole wavelength range is measured at once using a Fourier transform instrument and then a transmittance or absorbance spectrum is generated using a dedicated procedure. Analysis of the position, shape and intensity of peaks in this spectrum reveals details about the molecular structure of the sample.

This technique works almost exclusively on samples with covalent bonds. Simple spectra are obtained from samples with few IR active bonds and high levels of purity. More complex molecular structures lead to more absorption bands and more complex spectra. The technique has been used for the characterization of very complex mixtures[citation needed]. Spectra issues with infrared fluorescence are rare.

Sample preparation

Gaseous samples require a sample cell with a long pathlength to compensate for the diluteness. The pathlength of the sample cell depends on the concentration of the compound of interest. A simple glass tube with length of 5 to 10 cm equipped with infrared-transparent windows at the both ends of the tube can be used for concentrations down to several hundred ppm. Sample gas concentrations well below ppm can be measured with a White's cell in which the infrared light is guided with mirrors to travel through the gas. White's cells are available with optical pathlength starting from 0.5 m up to hundred meters.

Liquid samples can be sandwiched between two plates of a salt (commonly sodium chloride, or common salt, although a number of other salts such as potassium bromide or calcium fluoride are also used).[2] The plates are transparent to the infrared light and do not introduce any lines onto the spectra.

Solid samples can be prepared in a variety of ways. One common method is to crush the sample with an oily mulling agent (usually Nujol) in a marble or agate mortar, with a pestle. A thin film of the mull is smeared onto salt plates and measured. The second method is to grind a quantity of the sample with a specially purified salt (usually potassium bromide) finely (to remove scattering effects from large crystals). This powder mixture is then pressed in a mechanical press to form a translucent pellet through which the beam of the spectrometer can pass.[2] A third technique is the "cast film" technique, which is used mainly for polymeric materials. The sample is first dissolved in a suitable, non hygroscopic solvent. A drop of this solution is deposited on surface of KBr or NaCl cell. The solution is then evaporated to dryness and the film formed on the cell is analysed directly. Care is important to ensure that the film is not too thick otherwise light cannot pass through. This technique is suitable for qualitative analysis. The final method is to use microtomy to cut a thin (20–100 µm) film from a solid sample. This is one of the most important ways of analysing failed plastic products for example because the integrity of the solid is preserved.

In photoacoustic spectroscopy the need for sample treatment is minimal. The sample, liquid or solid, is placed into the sample cup which is inserted into the photoacoustic cell which is then sealed for the measurement. The sample may be one solid piece, powder or basically in any form for the measurement. For example, a piece of rock can be inserted into the sample cup and the spectrum measured from it.

It is important to note that spectra obtained from different sample preparation methods will look slightly different from each other due to differences in the samples' physical states.

Comparing to a reference


Schematics of a two-beam absorption spectrometer. A beam of infrared light is produced, passed through an interferometer (not shown), and then split into two separate beams. One is passed through the sample, the other passed through a reference. The beams are both reflected back towards a detector, however first they pass through a splitter, which quickly alternates which of the two beams enters the detector. The two signals are then compared and a printout is obtained. This "two-beam" setup gives accurate spectra even if the intensity of the light source drifts over time.

To take the infrared spectrum of a sample, it is necessary to measure both the sample and a "reference" (or "control"). This is because each measurement is affected by not only the light-absorption properties of the sample, but also the properties of the instrument (for example, what light source is used, what infrared detector is used, etc.). The reference measurement makes it possible to eliminate the instrument influence. Mathematically, the sample transmission spectrum is divided by the reference transmission spectrum.

The appropriate "reference" depends on the measurement and its goal. The simplest reference measurement is to simply remove the sample (replacing it by air). However, sometimes a different reference is more useful. For example, if the sample is a dilute solute dissolved in water in a beaker, then a good reference measurement might be to measure pure water in the same beaker. Then the reference measurement would cancel out not only all the instrumental properties (like what light source is used), but also the light-absorbing and light-reflecting properties of the water and beaker, and the final result would just show the properties of the solute (at least approximately).

A common way to compare to a reference is sequentially: first measure the reference, then replace the reference by the sample and measure the sample. This technique is not perfectly reliable; if the infrared lamp is a bit brighter during the reference measurement, then a bit dimmer during the sample measurement, the measurement will be distorted. More elaborate methods, such as a "two-beam" setup (see figure), can correct for these types of effects to give very accurate results. The Standard addition method can be used to statistically cancel these errors.

FTIR

An interferogram from an FTIR measurement. The horizontal axis is the position of the mirror, and the vertical axis is the amount of light detected. This is the "raw data" which can be Fourier transformed to get the actual spectrum.

Fourier transform infrared (FTIR) spectroscopy is a measurement technique that allows one to record infrared spectra. Infrared light is guided through an interferometer and then through the sample (or vice versa). A moving mirror inside the apparatus alters the distribution of infrared light that passes through the interferometer. The signal directly recorded, called an "interferogram", represents light output as a function of mirror position. A data-processing technique called Fourier transform turns this raw data into the desired result (the sample's spectrum): Light output as a function of infrared wavelength (or equivalently, wavenumber). As described above, the sample's spectrum is always compared to a reference.

There is an alternate method for taking spectra (the "dispersive" or "scanning monochromator" method), where one wavelength at a time passes through the sample. The dispersive method is more common in UV-Vis spectroscopy, but is less practical in the infrared than the FTIR method. One reason that FTIR is favored is called "Fellgett's advantage" or the "multiplex advantage": The information at all frequencies is collected simultaneously, improving both speed and signal-to-noise ratio. Another is called "Jacquinot's Throughput Advantage": A dispersive measurement requires detecting much lower light levels than an FTIR measurement.[3] There are other advantages, as well as some disadvantages,[3] but virtually all modern infrared spectrometers are FTIR instruments.

Absorption bands

IR spectroscopy is often used to identify structures because functional groups give rise to characteristic bands both in terms of intensity and position (frequency). The positions of these bands is summarized in correlation tables as shown below.

IR summary version 2.gif
Wavenumbers listed in cm−1.

Badger's rule

For many kinds of samples, the assignments are known, i.e. which bond deformation(s) are associated with which frequency. In such cases further information can be gleaned about the strength on a bond, relying on the empirical guideline called Badger's Rule. Originally published by Richard Badger in 1934,[4] this rule states that the strength of a bond correlates with the frequency of its vibrational mode. That is, increase in bond strength leads to corresponding frequency increase and vice versa.

Uses and applications

Infrared spectroscopy is a simple and reliable technique widely used in both organic and inorganic chemistry, in research and industry. It is used in quality control, dynamic measurement, and monitoring applications such as the long-term unattended measurement of CO2 concentrations in greenhouses and growth chambers by infrared gas analyzers.

It is also used in forensic analysis in both criminal and civil cases, for example in identifying polymer degradation. It can be used in determining the blood alcohol content of a suspected drunk driver.

A useful way of analysing solid samples without the need for cutting samples uses ATR or attenuated total reflectance spectroscopy. Using this approach, samples are pressed against the face of a single crystal. The infrared radiation passes through the crystal and only interacts with the sample at the interface between the two materials.

With increasing technology in computer filtering and manipulation of the results, samples in solution can now be measured accurately (water produces a broad absorbance across the range of interest, and thus renders the spectra unreadable without this computer treatment).

Some instruments will also automatically tell you what substance is being measured from a store of thousands of reference spectra held in storage.

Infrared spectroscopy is also useful in measuring the degree of polymerization in polymer manufacture. Changes in the character or quantity of a particular bond are assessed by measuring at a specific frequency over time. Modern research instruments can take infrared measurements across the range of interest as frequently as 32 times a second. This can be done whilst simultaneous measurements are made using other techniques. This makes the observations of chemical reactions and processes quicker and more accurate.

Infrared spectroscopy has also been successfully utilized in the field of semiconductor microelectronics:[5] for example, infrared spectroscopy can be applied to semiconductors like silicon, gallium arsenide, gallium nitride, zinc selenide, amorphous silicon, silicon nitride, etc.

The instruments are now small, and can be transported, even for use in field trials.

In February 2014, NASA announced a greatly upgraded database, based on IR spectroscopy, for tracking polycyclic aromatic hydrocarbons (PAHs) in the universe. According to scientists, more than 20% of the carbon in the universe may be associated with PAHs, possible starting materials for the formation of life. PAHs seem to have been formed shortly after the Big Bang, are widespread throughout the universe, and are associated with new stars and exoplanets.[6]

Isotope effects

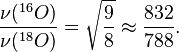
The different isotopes in a particular species may exhibit different fine details in infrared spectroscopy. For example, the O–O stretching frequency (in reciprocal centimeters) of oxyhemocyanin is experimentally determined to be 832 and 788 cm−1 for ν(16O–16O) and ν(18O–18O), respectively.

By considering the O–O bond as a spring, the wavenumber of absorbance, ν can be calculated:
\nu = \frac{1}{2 \pi c} \sqrt{\frac{k}{\mu}}
where k is the spring constant for the bond, c is the speed of light, and μ is the reduced mass of the A–B system:
\mu = \frac{m_A m_B}{m_A + m_B}
(m_i is the mass of atom i).

The reduced masses for 16O–16O and 18O–18O can be approximated as 8 and 9 respectively. Thus
\frac{\nu(^{16}O)}{\nu(^{18}O)} = \sqrt{\frac{9}{8}} \approx \frac{832}{788}.
Where \nu is the wavenumber; [wavenumber = frequency/(speed of light)]

The effect of isotopes, both on the vibration and the decay dynamics, has been found to be stronger than previously thought. In some systems, such as silicon and germanium, the decay of the anti-symmetric stretch mode of interstitial oxygen involves the symmetric stretch mode with a strong isotope dependence. For example, it was shown that for a natural silicon sample, the lifetime of the anti-symmetric vibration is 11.4 ps. When the isotope of one of the silicon atoms is increased to 29Si, the lifetime increases to 19 ps. In similar manner, when the silicon atom is changed to 30Si, the lifetime becomes 27 ps.[7]

Two-dimensional IR

Two-dimensional infrared correlation spectroscopy analysis combines multiple samples of infrared spectra to reveal more complex properties. By extending the spectral information of a perturbed sample, spectral analysis is simplified and resolution is enhanced. The 2D synchronous and 2D asynchronous spectra represent a graphical overview of the spectral changes due to a perturbation (such as a changing concentration or changing temperature) as well as the relationship between the spectral changes at two different wavenumbers.


Pulse Sequence used to obtain a two-dimensional Fourier transform infrared spectrum. The time period \tau_1 is usually referred to as the coherence time and the second time period \tau_2 is known as the waiting time. The excitation frequency is obtained by Fourier transforming along the \tau_1 axis.

Nonlinear two-dimensional infrared spectroscopy[8][9] is the infrared version of correlation spectroscopy. Nonlinear two-dimensional infrared spectroscopy is a technique that has become available with the development of femtosecond infrared laser pulses. In this experiment, first a set of pump pulses is applied to the sample. This is followed by a waiting time during which the system is allowed to relax. The typical waiting time lasts from zero to several picoseconds, and the duration can be controlled with a resolution of tens of femtoseconds. A probe pulse is then applied, resulting in the emission of a signal from the sample. The nonlinear two-dimensional infrared spectrum is a two-dimensional correlation plot of the frequency ω1 that was excited by the initial pump pulses and the frequency ω3 excited by the probe pulse after the waiting time. This allows the observation of coupling between different vibrational modes; because of its extremely fine time resolution, it can be used to monitor molecular dynamics on a picosecond timescale. It is still a largely unexplored technique and is becoming increasingly popular for fundamental research.

As with two-dimensional nuclear magnetic resonance (2DNMR) spectroscopy, this technique spreads the spectrum in two dimensions and allows for the observation of cross peaks that contain information on the coupling between different modes. In contrast to 2DNMR, nonlinear two-dimensional infrared spectroscopy also involves the excitation to overtones. These excitations result in excited state absorption peaks located below the diagonal and cross peaks. In 2DNMR, two distinct techniques, COSY and NOESY, are frequently used. The cross peaks in the first are related to the scalar coupling, while in the latter they are related to the spin transfer between different nuclei. In nonlinear two-dimensional infrared spectroscopy, analogs have been drawn to these 2DNMR techniques.
Nonlinear two-dimensional infrared spectroscopy with zero waiting time corresponds to COSY, and nonlinear two-dimensional infrared spectroscopy with finite waiting time allowing vibrational population transfer corresponds to NOESY. The COSY variant of nonlinear two-dimensional infrared spectroscopy has been used for determination of the secondary structure content of proteins.[10]

Molecular vibration


From Wikipedia, the free encyclopedia

A molecular vibration occurs when atoms in a molecule are in periodic motion while the molecule as a whole has constant translational and rotational motion. The frequency of the periodic motion is known as a vibration frequency, and the typical frequencies of molecular vibrations range from less than 1012 to approximately 1014 Hz.

In general, a molecule with N atoms has 3N – 6 normal modes of vibration, but a linear molecule has 3N – 5 such modes, as rotation about its molecular axis cannot be observed.[1] A diatomic molecule has one normal mode of vibration. The normal modes of vibration of polyatomic molecules are independent of each other but each normal mode will involve simultaneous vibrations of different parts of the molecule such as different chemical bonds.

A molecular vibration is excited when the molecule absorbs a quantum of energy, E, corresponding to the vibration's frequency, ν, according to the relation E = (where h is Planck's constant). A fundamental vibration is excited when one such quantum of energy is absorbed by the molecule in its ground state. When two quanta are absorbed the first overtone is excited, and so on to higher overtones.

To a first approximation, the motion in a normal vibration can be described as a kind of simple harmonic motion. In this approximation, the vibrational energy is a quadratic function (parabola) with respect to the atomic displacements and the first overtone has twice the frequency of the fundamental. In reality, vibrations are anharmonic and the first overtone has a frequency that is slightly lower than twice that of the fundamental.
Excitation of the higher overtones involves progressively less and less additional energy and eventually leads to dissociation of the molecule, as the potential energy of the molecule is more like a Morse potential.

The vibrational states of a molecule can be probed in a variety of ways. The most direct way is through infrared spectroscopy, as vibrational transitions typically require an amount of energy that corresponds to the infrared region of the spectrum. Raman spectroscopy, which typically uses visible light, can also be used to measure vibration frequencies directly. The two techniques are complementary and comparison between the two can provide useful structural information such as in the case of the rule of mutual exclusion for centrosymmetric molecules.

Vibrational excitation can occur in conjunction with electronic excitation (vibronic transition), giving vibrational fine structure to electronic transitions, particularly with molecules in the gas state.

Simultaneous excitation of a vibration and rotations gives rise to vibration-rotation spectra.

Vibrational coordinates

The coordinate of a normal vibration is a combination of changes in the positions of atoms in the molecule. When the vibration is excited the coordinate changes sinusoidally with a frequency ν, the frequency of the vibration.

Internal coordinates

Internal coordinates are of the following types, illustrated with reference to the planar molecule ethylene,
Ethylene
  • Stretching: a change in the length of a bond, such as C-H or C-C
  • Bending: a change in the angle between two bonds, such as the HCH angle in a methylene group
  • Rocking: a change in angle between a group of atoms, such as a methylene group and the rest of the molecule.
  • Wagging: a change in angle between the plane of a group of atoms, such as a methylene group and a plane through the rest of the molecule,
  • Twisting: a change in the angle between the planes of two groups of atoms, such as a change in the angle between the two methylene groups.
  • Out-of-plane: a change in the angle between any one of the C-H bonds and the plane defined by the remaining atoms of the ethylene molecule. Another example is in BF3 when the boron atom moves in and out of the plane of the three fluorine atoms.
In a rocking, wagging or twisting coordinate the bond lengths within the groups involved do not change. The angles do. Rocking is distinguished from wagging by the fact that the atoms in the group stay in the same plane.

In ethene there are 12 internal coordinates: 4 C-H stretching, 1 C-C stretching, 2 H-C-H bending, 2 CH2 rocking, 2 CH2 wagging, 1 twisting. Note that the H-C-C angles cannot be used as internal coordinates as the angles at each carbon atom cannot all increase at the same time.

Vibrations of a methylene group (-CH2-) in a molecule for illustration

The atoms in a CH2 group, commonly found in organic compounds, can vibrate in six different ways: symmetric and asymmetric stretching, scissoring, rocking, wagging and twisting as shown here:

Symmetrical
stretching
Asymmetrical
stretching
Scissoring (Bending)
Symmetrical stretching.gif Asymmetrical stretching.gif Scissoring.gif
Rocking Wagging Twisting
Modo rotacao.gif Wagging.gif Twisting.gif

(These figures do not represent the "recoil" of the C atoms, which, though necessarily present to balance the overall movements of the molecule, are much smaller than the movements of the lighter H atoms).

Symmetry-adapted coordinates

Symmetry-adapted coordinates may be created by applying a projection operator to a set of internal coordinates.[2]
The projection operator is constructed with the aid of the character table of the molecular point group. For example, the four(un-normalised) C-H stretching coordinates of the molecule ethene are given by
Q_{s1} =  q_{1} + q_{2} + q_{3} + q_{4}\!
Q_{s2} =  q_{1} + q_{2} - q_{3} - q_{4}\!
Q_{s3} =  q_{1} - q_{2} + q_{3} - q_{4}\!
Q_{s4} =  q_{1} - q_{2} - q_{3} + q_{4}\!
where q_{1} - q_{4} are the internal coordinates for stretching of each of the four C-H bonds.

Illustrations of symmetry-adapted coordinates for most small molecules can be found in Nakamoto.[3]

Normal coordinates

The normal coordinates, denoted as Q, refer to the positions of atoms away from their equilibrium positions, with respect to a normal mode of vibration. Each normal mode is assigned a single normal coordinate, and so the normal coordinate refers to the "progress" along that normal mode at any given time. Formally, normal modes are determined by solving a secular determinant, and then the normal coordinates (over the normal modes) can be expressed as a summation over the cartesian coordinates (over the atom positions). The advantage of working in normal modes is that they diagonalize the matrix governing the molecular vibrations, so each normal mode is an independent molecular vibration, associated with its own spectrum of quantum mechanical states. If the molecule possesses symmetries, it will belong to a point group, and the normal modes will "transform as" an irreducible representation under that group. The normal modes can then be qualitatively determined by applying group theory and projecting the irreducible representation onto the cartesian coordinates. For example, when this treatment is applied to CO2, it is found that the C=O stretches are not independent, but rather there is an O=C=O symmetric stretch and an O=C=O asymmetric stretch.
  • symmetric stretching: the sum of the two C-O stretching coordinates; the two C-O bond lengths change by the same amount and the carbon atom is stationary. Q = q1 + q2
  • asymmetric stretching: the difference of the two C-O stretching coordinates; one C-O bond length increases while the other decreases. Q = q1 - q2
When two or more normal coordinates belong to the same irreducible representation of the molecular point group (colloquially, have the same symmetry) there is "mixing" and the coefficients of the combination cannot be determined a priori. For example, in the linear molecule hydrogen cyanide, HCN, The two stretching vibrations are
  1. principally C-H stretching with a little C-N stretching; Q1 = q1 + a q2 (a << 1)
  2. principally C-N stretching with a little C-H stretching; Q2 = b q1 + q2 (b << 1)
The coefficients a and b are found by performing a full normal coordinate analysis by means of the Wilson GF method.[4]

Newtonian mechanics


The HCl molecule as an anharmonic oscillator vibrating at energy level E3. D0 is dissociation energy here, r0 bond length, U potential energy. Energy is expressed in wavenumbers. The hydrogen chloride molecule is attached to the coordinate system to show bond length changes on the curve.

Perhaps surprisingly, molecular vibrations can be treated using Newtonian mechanics to calculate the correct vibration frequencies. The basic assumption is that each vibration can be treated as though it corresponds to a spring. In the harmonic approximation the spring obeys Hooke's law: the force required to extend the spring is proportional to the extension. The proportionality constant is known as a force constant, k. The anharmonic oscillator is considered elsewhere.[5]
\mathrm{Force}=- k Q \!
By Newton’s second law of motion this force is also equal to a reduced mass, μ, times acceleration.
 \mathrm{Force} = \mu \frac{d^2Q}{dt^2}
Since this is one and the same force the ordinary differential equation follows.
\mu \frac{d^2Q}{dt^2} + k Q = 0
The solution to this equation of simple harmonic motion is
Q(t) =  A \cos (2 \pi \nu  t) ;\ \  \nu =   {1\over {2 \pi}} \sqrt{k \over \mu}. \!
A is the maximum amplitude of the vibration coordinate Q. It remains to define the reduced mass, μ. In general, the reduced mass of a diatomic molecule, AB, is expressed in terms of the atomic masses, mA and mB, as
\frac{1}{\mu} = \frac{1}{m_A}+\frac{1}{m_B}.
The use of the reduced mass ensures that the centre of mass of the molecule is not affected by the vibration. In the harmonic approximation the potential energy of the molecule is a quadratic function of the normal coordinate. It follows that the force-constant is equal to the second derivative of the potential energy.
k=\frac{\partial ^2V}{\partial Q^2}
When two or more normal vibrations have the same symmetry a full normal coordinate analysis must be performed (see GF method). The vibration frequencies,νi are obtained from the eigenvalues,λi, of the matrix product GF. G is a matrix of numbers derived from the masses of the atoms and the geometry of the molecule.[4] F is a matrix derived from force-constant values. Details concerning the determination of the eigenvalues can be found in.[6]

Quantum mechanics

In the harmonic approximation the potential energy is a quadratic function of the normal coordinates. Solving the Schrödinger wave equation, the energy states for each normal coordinate are given by
E_n = h \left( n + {1 \over 2 } \right)\nu=h\left( n + {1 \over 2 } \right) {1\over {2 \pi}} \sqrt{k \over m} \!,
where n is a quantum number that can take values of 0, 1, 2 ... In molecular spectroscopy where several types of molecular energy are studied and several quantum numbers are used, this vibrational quantum number is often designated as v.[7][8]

The difference in energy when n (or v) changes by 1 is therefore equal to h\nu, the product of the Planck constant and the vibration frequency derived using classical mechanics. For a transition from level n to level n+1 due to absorption of a photon, the frequency of the photon is equal to the classical vibration frequency \nu (in the harmonic oscillator approximation).

See quantum harmonic oscillator for graphs of the first 5 wave functions, which allow certain selection rules to be formulated. For example, for a harmonic oscillator transitions are allowed only when the quantum number n changes by one,
\Delta n = \pm 1
but this does not apply to an anharmonic oscillator; the observation of overtones is only possible because vibrations are anharmonic. Another consequence of anharmonicity is that transitions such as between states n=2 and n=1 have slightly less energy than transitions between the ground state and first excited state. Such a transition gives rise to a hot band.

Intensities

In an infrared spectrum the intensity of an absorption band is proportional to the derivative of the molecular dipole moment with respect to the normal coordinate.[9] The intensity of Raman bands depends on polarizability.

Watch scientist challenge the scare-promoting Food Babe

& | April 7, 2015 |
 
Original link:  http://geneticliteracyproject.org/2015/04/watch-scientist-challenge-the-scare-promoting-food-babe/
 
food-babe-1cba4a5bff1e5b917ff142309f6ab837e9a62b36-s1100-c15

If you don’t know who Vani Hari is by now, just ask Subway. Under her nom de plume, Food Babe, she and her legion of followers pounded the fast food company until it removed a harmless chemical with a scary sounding name from their bread.

That’s Hari’s stock and trade as self-proclaimed consumer advocate–demonizing benign ingredients, focusing on their seeming “yuck” factor but ignoring the science. In the case of the Subway fiasco, for example, although azodicarbonamide, a dough conditioner is perfectly harmless and widely used in foods, it’s also used in yoga mats. Guess who won that ‘public debate’?

Hari often recounts her self-authored narrative, her personal journey from unhealthy and frumpy to beautiful “babe.” She claims to have achieved this transformation by rejecting standard American fare and its reliance on unhealthy ingredients in favor of an organic diet. Her book, The Food Babe Way, hit shelves in February with the promise of revealing food-industry secrets and helping readers improve their health and waistlines with exclusive tips and tricks. It shot to the top of many bestseller lists–but the science community sees her less of a defender of the culinary downtrodden than as a fearmonger and promoter of chemophobia and dangerous misinformation.

Alison Bernstein, AKA Mommy Ph.D.–co-author of this piece–attended one of Hari’s book promotion appearances last month at the Marcus Jewish Community Center in Atlanta. Bernstein, who recently launched the Scientists Are People campaign to showcase the humanity of oft-demonized scientists, made waves in the science-based food community when she challenged Hari during the Atlanta event’s Q&A.

The event started out in typical Hari fashion–all Food Babe, all the time, replete with her fabulous tale of sickly and homely waif to the organic world’s superwoman. For years, she said, she felt lousy because she was sleep deprived, and regularly gorged on fast food and candy. She was overweight and plagued with eczema. Voila. Now she’s bikini ready–and all by eliminating “chemicals and GMOs,”

Hari’s typical narrative drew on misguided sympathy. She recounted growing up as a child of Indian immigrants. Wanting to fit in, she rejected her mother’s traditional home cooking, which she “shunned as a child,” complaining that it looked and tasted funny. Instead, she and her brother subsisted on Wendy’s, Burger King, McDonalds, microwavable salisbury steak, and Betty Crocker meals.

https://www.youtube.com/watch?feature=player_embedded&v=EnUDQmNr0p4

Hari’s food misadventures continued as an adult. A peripatetic businesswoman, she would dine at high-end restaurants such as Morton’s and Ruth’s Chris on her company’s expense account. All of that changed, she said, after suffering from appendicitis. It was a wake up call. She examined her food eating patterns, and learned, she said, that she had been “duped” by the food industry. She changed her habits and launched her crusade. Now she asks people to follow the Food Babe Way (which many experts say promotes orthorexia).

Some of what she advocates is just food nutrition 101. Dieticians, physicians, and scientists argue that switching to a diet high in produce, getting adequate sleep (by leaving a high pressure job), and cutting calories and junk food would improve anyone’s health and mood, Food Babe Way or not. Her transformation had nothing to do with avoiding specific chemicals or any specific food.

Hari vigorously disagrees. In Atlanta, following her script, she claimed that an organic diet is the best to avoid “harmful” chemicals. She not only touted eating produce–a good thing–she said it is imperative to purchase organic–something science does not support. She cited the Consumers Union and Environmental Working Group as her sources for her recommendations; both use flawed methodology to arrive at their lists of so-called “safe” and “dangerous” produce. And she promoted the common misconception that organic farming doesn’t use pesticides–or that the natural ones that are used are necessarily safer than targeted, synthetic alternatives.

https://www.youtube.com/watch?feature=player_embedded&v=oJ0nkPXgOhQ

Bernstein corrected Hari’s misinformation during the Q&A session:

https://www.youtube.com/watch?feature=player_embedded&v=S0z2eeq_c_4

When Bernstein challenged Hari’s claim that organic farming don’t use pesticides, Hari first falsely contradicted her, then changed the subject and finally entered attack mode, accusing Bernstein of being one of those “people who don’t want the [pro-organic] message spread.” Bernstein, she implied, wasn’t an independent scientist–she is–but a shill for the food industry.

It was surprising that Hari even answered questions. At most events–such as an appearance earlier this year at the University of Florida–Hari refused to respond to audience queries. Taking questions implies a commitment to dialogue. Rather, Hari motivates by instilling fear, uncertainty and doubt. She demonizes what she doesn’t understand, and has become quite wealthy in the process. Indeed, the hypocrisy of her calling science advocates “shills” is astonishing.

Bernstein observed that Hari courts her audience by making it seem as if she is empowering them: knowledge is power is her narrative. As per her M.O., Food Babe gushed about empowering consumers with information of the dangerous ingredients that haunt their foods. But is arming consumers with misinformation empowering? Or does it exploit their fears of the unknown? People can only make wise decisions when they have access to accurate information. Instilling unfounded fears of food is the opposite of empowering.

https://www.youtube.com/watch?feature=player_embedded&v=rbePYkc4bXk

To be truly empowered, consumers must have access to accurate information. Even Hari admitted that truth has not been her stock and trade. “It was just a hobby,” she said of her early blog. “It wasn’t this well-researched facts kind of thing. It was just my opinion about things.” She claims to have cleared up her act, but medical and science experts disagree.

Hari’s perspective is a mixture of the mystical and misinformation. At one point, she described the body as acidic in the morning, advising drinking lemon water to combat the acidity because “lemon water is very alkaline”. Nothing about what she said is correct. The body’s balance between acidity and alkalinity is referred to as acid-base balance. The pH of the human body is naturally regulated, using different mechanisms to control the blood’s acid-base balance. Lemon juice is not alkaline (basic), it’s acidic. Food does not alter the body’s pH.

https://www.youtube.com/watch?feature=player_embedded&v=ftq4nJqyRqo

Hari also fails to assess the quality of the information that she passes on to he unquestioning followers. And she makes it seems that she,and only she, has cracked the wall of deception built by Food Inc. Most of the supposedly top-secret information she claims to reveal is publicly available at university and government websites, including FDA, USDA, EPA and NIH, as well as non-government websites for the organic industry like OMRI, and various publicly available science publications.

With notoriety comes responsibility. Spreading misinformation and fear is irresponsible and distracting.
The best place for consumers to get accurate information is from those with training and experience in food, farming and nutrition. At the MJCCA event, she repeatedly described scientists as people who hoard information and intentionally deceive the public about “chemicals.” She painted farmers as uncaring, and only out for profit. In contrast, she positioned herself as the anti-expert, rejecting “people who say this is too complicated, you can’t understand this, you need an advanced degree, they don’t want to empower the individual.”

Hari’s assertion that scientists hoard knowledge–even as a scientist was engaging her in open discourse – was baffling. Hari’s fans are hungry for real information. After the Atlanta Q&A, a small crowd formed around Bernstein to ask questions about Parkinson’s disease, pesticide toxicity and where to find accurate information. Many of them had no idea that much of this information is publicly available.

The huge number of scientists, science communicators and farmers who actively, and often selflessly, share medical food information on social media, and cordially engage with the public, serve as proof that Hari’s characterization is wrong, even offensive. She apparently believes she needs to demonize trained experts to convince people to listen to her.

Alison Bernstein is a scientist studying Parkinson’s disease. She lives in Atlanta, GA with her husband, 2 kids and 2 cats. Follow her on her Mommy Ph.D. Facebook page and on Twitter @mommyphd2.

Kavin Senapathy is a contributor at Genetic Literacy Project and other sites. She is a mother of two and a freelance writer who works for a genomics and bioinformatics R&D in Madison, WI. Opinions expressed are her own and do not reflect her employer. Follow Kavin on her science advocacy Facebook page, and Twitter @ksenapathy

Additional Resources:

Chemical polarity


From Wikipedia, the free encyclopedia
 

A water molecule, a commonly used example of polarity. The two charges are present with a negative charge in the middle (red shade), and a positive charge at the ends (blue shade).

In chemistry, polarity refers to a separation of electric charge leading to a molecule or its chemical groups having an electric dipole or multipole moment. Polar molecules interact through dipole–dipole intermolecular forces and hydrogen bonds. Molecular polarity is dependent on the difference in electronegativity between atoms in a compound and the asymmetry of the compound's structure. Polarity underlies a number of physical properties including surface tension, solubility, and melting and boiling-points.

Polarity of bonds

Hydrogen-fluoride-3D-balls.png
Hydrogen-fluoride-elpot-transparent-3D-balls.png
In a molecule of hydrogen fluoride (HF), the more electronegative atom (fluoride) is shown in yellow. Because the electrons spend more time by the fluorine atom in the H-F bond, the red represents partially negatively charged regions, while blue represents partially positively charged regions.

Not all atoms attract electrons with the same force. The amount of "pull" an atom exerts on its electrons is called its electronegativity. Atoms with high electronegativities — such as fluorine, oxygen, and nitrogen — exert a greater pull on electrons than atoms with lower electronegativities. In a bond, this leads to unequal sharing of electrons between the atoms, as electrons will be drawn closer to the atom with the higher electronegativity.

Because electrons have a negative charge, the unequal sharing of electrons within a bond leads to the formation of an electric dipole: a separation of positive and negative electric charge. Because the amount of charge separated in such dipoles is usually smaller than a fundamental charge, they are called partial charges, denoted as δ+ (delta plus) and δ− (delta minus). These symbols were introduced by Christopher Ingold and his wife Hilda Usherwood in 1926.[1] The bond dipole moment is calculated by multiplying the amount of charge separated and the distance between the charges.

These dipoles within molecules can interact with dipoles in other molecules, creating dipole-dipole intermolecular forces.

Classification

Chemists classify the polarity of chemical bonds into three groups:
  • Non-polar bonds occur when the difference in electronegativity between the two atoms is less than 0.4
  • Polar bonds occur when the difference in electronegativity between the two atoms is between 0.4 and 2.0
  • Ionic bonds occur when the difference in electronegativity between the two atoms is greater than 2.0[citation needed]
Bonds can fall between one of two extremes — being completely nonpolar or completely polar. A completely nonpolar bond occurs when the electronegativities are identical and therefore possess a difference of zero. A completely polar bond is more correctly called an ionic bond, and occurs when the difference between electronegativities is large enough that one atom actually takes an electron from the other. The terms "polar" and "nonpolar" are usually applied to covalent bonds, that is, bonds where the polarity is not complete. To determine the polarity of a covalent bond using numerical means, the difference between the electronegativity of the atoms is taken. On the Pauling scale, if the result is less than 0.4, the bond is generally nonpolar covalent. If the result is between 0.4 and 1.7, the bond is generally polar covalent. If the result is greater than 1.7 the bond is generally considered ionic.

Pauling considered that the partial ionic character of a bond is an approximate function of the difference in electronegativity between the two bonded atoms. He estimated that a difference of 1.7 corresponds to 50% ionic character, so that a greater difference corresponds to a bond which is predominantly ionic.[2]

Polarity of molecules

While the molecules can be described as "polar covalent", "nonpolar covalent", or "ionic", this is often a relative term, with one molecule simply being more polar or more nonpolar than another. However, the following properties are typical of such molecules.

A molecule is composed of one or more chemical bonds between molecular orbitals of different atoms. A molecule may be polar either as a result of polar bonds due to differences in electronegativity as described above, or as a result of an asymmetric arrangement of nonpolar covalent bonds and non-bonding pairs of electrons known as a full molecular orbital.

Polar molecules


The water molecule is made up of Oxygen and Hydrogen, with respective electronegativities of 3.44 and 2.20. The dipoles from each of the two bonds (red arrows) add together to make the overall molecule polar.

A polar molecule has a net dipole as a result of the opposing charges (i.e. having partial positive and partial negative charges) from polar bonds arranged asymmetrically. Water (H2O) is an example of a polar molecule since it has a slight positive charge on one side and a slight negative charge on the other. The dipoles do not cancel out resulting in a net dipole. Due to the polar nature of the water molecule itself, polar molecules are generally able to dissolve in water. Another example includes sugars (like sucrose), which have many polar oxygen–hydrogen (-OH) groups and are overall highly polar.

If the bond dipole moments of the molecule do not cancel, the molecule is polar. For example, the water molecule (H2O) contains two polar O-H bonds in a bent (nonlinear) geometry. The bond dipole moments do not cancel, so that the molecule forms a molecular dipole with its negative pole at the oxygen and its positive pole midway between the two hydrogen atoms. In the figure each bond joins the central O atom with a negative charge (red) to an H atom with a positive charge (blue).

The ammonia molecule, polar as a result of its molecular geometry. The red represents partially negatively charged regions.

The hydrogen fluoride, HF, molecule is polar by virtue of polar covalent bonds — in the covalent bond electrons are displaced towards the more electronegative fluorine atom. Ammonia, NH3, molecule the three N–H bonds have only a slight polarity (toward the more electronegative nitrogen atom). However, the molecule has two lone electrons in an orbital, that points towards the fourth apex of the approximate tetrahedron, (VSEPR). This orbital is not participating in covalent bonding; it is electron-rich, which results in a powerful dipole across the whole ammonia molecule.

In the ozone - O3 - molecule the two O–O bonds are nonpolar (there is no electronegativity difference between atoms of the same element). However, the distribution of other electrons is uneven — since the central atom has to share electrons with two other atoms, but each of the outer atoms has to share electrons with only one other atom, the central atom is more deprived of electrons than the others (the central atom has a formal charge of +1, while the outer atoms each have a formal charge of −1/2). Since the molecule has a bent geometry, the result is a dipole across the whole ozone molecule.

Nonpolar molecules

A molecule may be nonpolar either when there is an equal sharing of electrons between the two atoms of a diatomic molecule or because of the symmetrical arrangement of polar bonds in a more complex molecule. For example, boron trifluoride (BF3) has a trigonal planar arrangement of three polar bonds at 120°. This results in no overall dipole in the molecule.

In a molecule of boron trifluoride, the trigonal planar arrangement of three polar bonds results in no overall dipole.

Carbon dioxide has two polar C-O bonds in a linear geometry.

Not every molecule with polar bonds is a polar molecule. Carbon dioxide (CO2) has two polar C-O bonds, but the geometry of CO2 is linear so that the two bond dipole moments cancel and there is no net molecular dipole moment; the molecule is non-polar.

In methane, the bonds are arranged symmetrically (in a tetrahedral arrangement) so there is no overall dipole.

Examples of household nonpolar compounds include fats, oil, and petrol/gasoline. Therefore (per the "oil and water" rule of thumb),[clarification needed] most nonpolar molecules are water-insoluble (hydrophobic) at room temperature. However, many nonpolar organic solvents, such as turpentine, are able to dissolve polar substances. When comparing a polar and nonpolar molecule with similar molar masses, the polar molecule in general has a higher boiling point, because the dipole–dipole interaction between polar molecules causes greater attachment. The most common form of such an interaction is the hydrogen bond, which is also known as the H-bond.

In the methane molecule (CH4) the four C–H bonds are arranged tetrahedrally around the carbon atom. Each bond has polarity (though not very strong). However, the bonds are arranged symmetrically so there is no overall dipole in the molecule. The diatomic oxygen molecule (O2) does not have polarity in the covalent bond because of equal electronegativity, hence there is no polarity in the molecule.

Hybrids

Large molecules that have one end with polar groups attached and another end with nonpolar groups are good surfactants. They can aid in the formation of stable emulsions, or blends, of water and fats. Surfactants reduce the interfacial tension between oil and water by adsorbing at the liquid–liquid interface.


Predicting molecule polarity

  • This classification table gives a good general understanding of predicting molecular dipole of some general molecular structures. However, one should not interpret it literally:
Formula Description Example
Polar AB Linear Molecules CO
HAx Molecules with a single H HF
AxOH Molecules with an OH at one end C2H5OH
OxAy Molecules with an O at one end H2O
NxAy Molecules with an N at one end NH3
Nonpolar A2 Diatomic molecules of the same element O2
CxAy Most carbon compounds CO2
  • Determining the point group is a useful way to predict polarity of a molecule. In general, a molecule will not possess dipole moment, if the individual bond dipole moments of the molecule cancel each other out. This is because dipole moments are euclidean vector quantities with magnitude and direction, and a two equal vectors who oppose each other will cancel out.
Any molecule with an centre of inversion ( "i" ) or a horizontal mirror plane ( "σh ") will not possess dipole moments. Likewise, a molecule with more than one Cn axis will not possess dipole moment because dipole moments cannot lie in more than one dimension. As a consequence of that constraint, all molecules with D symmetry (Schönflies notation) will, therefore, not have dipole moment because, by definition, D point groups have two or multiple Cn axis.

Since C1, Cs,C∞h Cn and Cnv point groups do not have a centre of inversion, horizontal mirror planes or multiple Cn axis, molecules in one of those point groups will have dipole moment.

Butane

From Wikipedia, the free encyclopedia ...