Search This Blog

Monday, April 3, 2017

Joseph Fourier

From Wikipedia, the free encyclopedia

Joseph Fourier
Fourier2.jpg
Jean-Baptiste Joseph Fourier
Born 21 March 1768
Auxerre, Burgundy, Kingdom of France (now in Yonne, France)
Died 16 May 1830 (aged 62)
Paris, Kingdom of France
Residence France
Nationality French
Fields Mathematician, physicist, historian
Institutions École Normale
École Polytechnique
Alma mater École Normale
Academic advisors Joseph-Louis Lagrange
Notable students Peter Gustav Lejeune Dirichlet
Claude-Louis Navier
Giovanni Plana
Known for Fourier series
Fourier transform
Fourier's law of conduction
Fourier–Motzkin elimination

Jean-Baptiste Joseph Fourier - (/ˈfʊəriˌ, -iər/;[1] French: [fuʁje]; 21 March 1768 – 16 May 1830) was a French mathematician and physicist born in Auxerre and best known for initiating the investigation of Fourier series and their applications to problems of heat transfer and vibrations. The Fourier transform and Fourier's law are also named in his honour. Fourier is also generally credited with the discovery of the greenhouse effect.[2]

Biography

Fourier was born at Auxerre (now in the Yonne département of France), the son of a tailor. He was orphaned at age nine. Fourier was recommended to the Bishop of Auxerre, and through this introduction, he was educated by the Benedictine Order of the Convent of St. Mark. The commissions in the scientific corps of the army were reserved for those of good birth, and being thus ineligible, he accepted a military lectureship on mathematics. He took a prominent part in his own district in promoting the French Revolution, serving on the local Revolutionary Committee. He was imprisoned briefly during the Terror but in 1795 was appointed to the École Normale, and subsequently succeeded Joseph-Louis Lagrange at the École Polytechnique.

Fourier accompanied Napoleon Bonaparte on his Egyptian expedition in 1798, as scientific adviser, and was appointed secretary of the Institut d'Égypte. Cut off from France by the English fleet, he organized the workshops on which the French army had to rely for their munitions of war. He also contributed several mathematical papers to the Egyptian Institute (also called the Cairo Institute) which Napoleon founded at Cairo, with a view of weakening English influence in the East. After the British victories and the capitulation of the French under General Menou in 1801, Fourier returned to France.
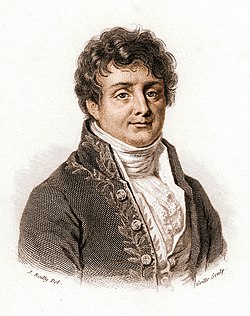
1820 watercolor caricatures of French mathematicians Adrien-Marie Legendre (left) and Joseph Fourier (right) by French artist Julien-Leopold Boilly, watercolor portrait numbers 29 and 30 of Album de 73 Portraits-Charge Aquarelle’s des Membres de I’Institute.[3]

In 1801,[4] Napoleon appointed Fourier Prefect (Governor) of the Department of Isère in Grenoble, where he oversaw road construction and other projects. However, Fourier had previously returned home from the Napoleon expedition to Egypt to resume his academic post as professor at École Polytechnique when Napoleon decided otherwise in his remark

... the Prefect of the Department of Isère having recently died, I would like to express my confidence in citizen Fourier by appointing him to this place.[4]

Hence being faithful to Napoleon, he took the office of Prefect.[4] It was while at Grenoble that he began to experiment on the propagation of heat. He presented his paper On the Propagation of Heat in Solid Bodies to the Paris Institute on December 21, 1807. He also contributed to the monumental Description de l'Égypte.[5]

Fourier moved to England in 1816. Later, he returned to France, and in 1822 succeeded Jean Baptiste Joseph Delambre as Permanent Secretary of the French Academy of Sciences. In 1830, he was elected a foreign member of the Royal Swedish Academy of Sciences.

In 1830, his diminished health began to take its toll:
Fourier had already experienced, in Egypt and Grenoble, some attacks of aneurism of the heart. At Paris, it was impossible to be mistaken with respect to the primary cause of the frequent suffocations which he experienced. A fall, however, which he sustained on the 4th of May 1830, while descending a flight of stairs, aggravated the malady to an extent beyond what could have been ever feared.[6]
Shortly after this event, he died in his bed on 16 May 1830.

Fourier was buried in the Père Lachaise Cemetery in Paris, a tomb decorated with an Egyptian motif to reflect his position as secretary of the Cairo Institute, and his collation of Description de l'Égypte. His name is one of the 72 names inscribed on the Eiffel Tower.

A bronze statue was erected in Auxerre in 1849, but it was melted down for armaments during World War II.[7] Joseph Fourier University in Grenoble is named after him.

The Analytic Theory of Heat

Sketch of Fourier, circa 1820.

In 1822 Fourier published his work on heat flow in Théorie analytique de la chaleur (The Analytical Theory of Heat),[8] in which he based his reasoning on Newton's law of cooling, namely, that the flow of heat between two adjacent molecules is proportional to the extremely small difference of their temperatures. This book was translated,[9] with editorial 'corrections',[10] into English 56 years later by Freeman (1878).[11] The book was also edited, with many editorial corrections, by Darboux and republished in French in 1888.[10]

There were three important contributions in this work, one purely mathematical, two essentially physical. In mathematics, Fourier claimed that any function of a variable, whether continuous or discontinuous, can be expanded in a series of sines of multiples of the variable. Though this result is not correct without additional conditions, Fourier's observation that some discontinuous functions are the sum of infinite series was a breakthrough. The question of determining when a Fourier series converges has been fundamental for centuries. Joseph-Louis Lagrange had given particular cases of this (false) theorem, and had implied that the method was general, but he had not pursued the subject. Peter Gustav Lejeune Dirichlet was the first to give a satisfactory demonstration of it with some restrictive conditions. This work provides the foundation for what is today known as the Fourier transform.

One important physical contribution in the book was the concept of dimensional homogeneity in equations; i.e. an equation can be formally correct only if the dimensions match on either side of the equality; Fourier made important contributions to dimensional analysis.[12] The other physical contribution was Fourier's proposal of his partial differential equation for conductive diffusion of heat. This equation is now taught to every student of mathematical physics.

Determinate equations

Bust of Fourier in Grenoble

Fourier left an unfinished work on determinate equations which was edited by Claude-Louis Navier and published in 1831. This work contains much original matter — in particular, there is a demonstration of Fourier's theorem on the position of the roots of an algebraic equation. Joseph-Louis Lagrange had shown how the roots of an algebraic equation might be separated by means of another equation whose roots were the squares of the differences of the roots of the original equation. François Budan, in 1807 and 1811, had enunciated the theorem generally known by the name of Fourier, but the demonstration was not altogether satisfactory. Fourier's proof[13] is the same as that usually given in textbooks on the theory of equations. The final solution of the problem was given in 1829 by Jacques Charles François Sturm.

Discovery of the greenhouse effect

Fourier's grave, Père Lachaise Cemetery

In the 1820s Fourier calculated that an object the size of the Earth, and at its distance from the Sun, should be considerably colder than the planet actually is if warmed by only the effects of incoming solar radiation. He examined various possible sources of the additional observed heat in articles published in 1824[14] and 1827.[15] While he ultimately suggested that interstellar radiation might be responsible for a large portion of the additional warmth, Fourier's consideration of the possibility that the Earth's atmosphere might act as an insulator of some kind is widely recognized as the first proposal of what is now known as the greenhouse effect,[16] although Fourier never called it that.[17][18]

In his articles, Fourier referred to an experiment by de Saussure, who lined a vase with blackened cork. Into the cork, he inserted several panes of transparent glass, separated by intervals of air. Midday sunlight was allowed to enter at the top of the vase through the glass panes. The temperature became more elevated in the more interior compartments of this device. Fourier concluded that gases in the atmosphere could form a stable barrier like the glass panes.[19] This conclusion may have contributed to the later use of the metaphor of the 'greenhouse effect' to refer to the processes that determine atmospheric temperatures.[20] Fourier noted that the actual mechanisms that determine the temperatures of the atmosphere included convection, which was not present in de Saussure's experimental device.

Works

  • Fourier, Joseph (1821). Rapport sur les tontines. 5. Paris: Memoirs of the Royal Academy of Sciences of the Institut de France. pp. 26–43.

Half-life

From Wikipedia, the free encyclopedia

Half-life (abbreviated t1⁄2) is the time required for a quantity to reduce to half its initial value. The term is commonly used in nuclear physics to describe how quickly unstable atoms undergo, or how long stable atoms survive, radioactive decay. The term is also used more generally to characterize any type of exponential or non-exponential decay. For example, the medical sciences refer to the biological half-life of drugs and other chemicals in the body. The converse of half-life is doubling time.

The original term, half-life period, dating to Ernest Rutherford's discovery of the principle in 1907, was shortened to half-life in the early 1950s.[1] Rutherford applied the principle of a radioactive element's half-life to studies of age determination of rocks by measuring the decay period of radium to lead-206.

Half-life is constant over the lifetime of an exponentially decaying quantity, and it is a characteristic unit for the exponential decay equation. The accompanying table shows the reduction of a quantity as a function of the number of half-lives elapsed.

Probabilistic nature

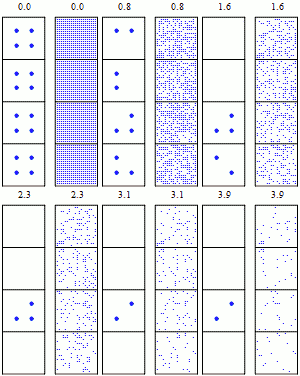
Simulation of many identical atoms undergoing radioactive decay, starting with either 4 atoms per box (left) or 400 (right). The number at the top is how many half-lives have elapsed. Note the consequence of the law of large numbers: with more atoms, the overall decay is more regular and more predictable.

A half-life usually describes the decay of discrete entities, such as radioactive atoms. In that case, it does not work to use the definition that states "half-life is the time required for exactly half of the entities to decay". For example, if there are 3 radioactive atoms with a half-life of one second, there will not be "1.5 atoms" left after one second.

Instead, the half-life is defined in terms of probability: "Half-life is the time required for exactly half of the entities to decay on average". In other words, the probability of a radioactive atom decaying within its half-life is 50%.

For example, the image on the right is a simulation of many identical atoms undergoing radioactive decay. Note that after one half-life there are not exactly one-half of the atoms remaining, only approximately, because of the random variation in the process. Nevertheless, when there are many identical atoms decaying (right boxes), the law of large numbers suggests that it is a very good approximation to say that half of the atoms remain after one half-life.

There are various simple exercises that demonstrate probabilistic decay, for example involving flipping coins or running a statistical computer program.[2][3][4]

Formulas for half-life in exponential decay

An exponential decay can be described by any of the following three equivalent formulas:
{\displaystyle {\begin{aligned}N(t)&=N_{0}\left({\frac {1}{2}}\right)^{\frac {t}{t_{1/2}}}\\N(t)&=N_{0}e^{-{\frac {t}{\tau }}}\\N(t)&=N_{0}e^{-\lambda t}\end{aligned}}}
where
  • N0 is the initial quantity of the substance that will decay (this quantity may be measured in grams, moles, number of atoms, etc.),
  • N(t) is the quantity that still remains and has not yet decayed after a time t,
  • t1⁄2 is the half-life of the decaying quantity,
  • τ is a positive number called the mean lifetime of the decaying quantity,
  • λ is a positive number called the decay constant of the decaying quantity.
The three parameters t1⁄2, τ, and λ are all directly related in the following way:
{\displaystyle t_{1/2}={\frac {\ln(2)}{\lambda }}=\tau \ln(2)}
By plugging in and manipulating these relationships, we get all of the following equivalent descriptions of exponential decay, in terms of the half-life:
{\displaystyle {\begin{aligned}N(t)&=N_{0}\left({\frac {1}{2}}\right)^{\frac {t}{t_{1/2}}}=N_{0}2^{-t/t_{1/2}}\\&=N_{0}e^{-t\ln(2)/t_{1/2}}\\t_{1/2}&={\frac {t}{\log _{2}(N_{0}/N(t))}}={\frac {t}{\log _{2}(N_{0})-\log _{2}(N(t))}}\\&={\frac {1}{\log _{2^{t}}(N_{0})-\log _{2^{t}}(N(t))}}={\frac {t\ln(2)}{\ln(N_{0})-\ln(N(t))}}\end{aligned}}}
Regardless of how it's written, we can plug into the formula to get
  • N(0)=N_{0} as expected (this is the definition of "initial quantity")
  • {\displaystyle N\left(t_{1/2}\right)={\frac {1}{2}}N_{0}} as expected (this is the definition of half-life)
  • \lim _{t\to \infty }N(t)=0; i.e., amount approaches zero as t approaches infinity as expected (the longer we wait, the less remains).

Decay by two or more processes

Some quantities decay by two exponential-decay processes simultaneously. In this case, the actual half-life T1⁄2 can be related to the half-lives t1 and t2 that the quantity would have if each of the decay processes acted in isolation:
{\displaystyle {\frac {1}{T_{1/2}}}={\frac {1}{t_{1}}}+{\frac {1}{t_{2}}}}
For three or more processes, the analogous formula is:
{\displaystyle {\frac {1}{T_{1/2}}}={\frac {1}{t_{1}}}+{\frac {1}{t_{2}}}+{\frac {1}{t_{3}}}+\cdots }
For a proof of these formulas, see Exponential decay § Decay by two or more processes.

Examples

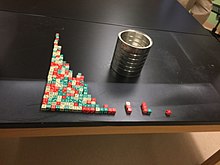
Half life demonstrated using dice in a classroom experiment

There is a half-life describing any exponential-decay process. For example:
  • The current flowing through an RC circuit or RL circuit decays with a half-life of RCln(2) or ln(2)L/R, respectively. For this example, the term half time might be used instead of "half life", but they mean the same thing.
  • In a first-order chemical reaction, the half-life of the reactant is ln(2)/λ, where λ is the reaction rate constant.
  • In radioactive decay, the half-life is the length of time after which there is a 50% chance that an atom will have undergone nuclear decay. It varies depending on the atom type and isotope, and is usually determined experimentally. See List of nuclides.
The half life of a species is the time it takes for the concentration of the substance to fall to half of its initial value.

In non-exponential decay

The decay of many physical quantities is not exponential—for example, the evaporation of water from a puddle, or (often) the chemical reaction of a molecule. In such cases, the half-life is defined the same way as before: as the time elapsed before half of the original quantity has decayed. However, unlike in an exponential decay, the half-life depends on the initial quantity, and the prospective half-life will change over time as the quantity decays.
As an example, the radioactive decay of carbon-14 is exponential with a half-life of 5,730 years. A quantity of carbon-14 will decay to half of its original amount (on average) after 5,730 years, regardless of how big or small the original quantity was. After another 5,730 years, one-quarter of the original will remain. On the other hand, the time it will take a puddle to half-evaporate depends on how deep the puddle is. Perhaps a puddle of a certain size will evaporate down to half its original volume in one day. But on the second day, there is no reason to expect that one-quarter of the puddle will remain; in fact, it will probably be much less than that. This is an example where the half-life reduces as time goes on. (In other non-exponential decays, it can increase instead.)

The decay of a mixture of two or more materials which each decay exponentially, but with different half-lives, is not exponential. Mathematically, the sum of two exponential functions is not a single exponential function. A common example of such a situation is the waste of nuclear power stations, which is a mix of substances with vastly different half-lives. Consider a mixture of a rapidly decaying element A, with a half-life of 1 second, and a slowly decaying element B, with a half-life of 1 year. In a couple of minutes, almost all atoms of element A will have decayed after repeated halving of the initial number of atoms, but very few of the atoms of element B will have done so as only a tiny fraction of its half-life has elapsed. Thus, the mixture taken as a whole will not decay by halves.

In biology and pharmacology

A biological half-life or elimination half-life is the time it takes for a substance (drug, radioactive nuclide, or other) to lose one-half of its pharmacologic, physiologic, or radiological activity. In a medical context, the half-life may also describe the time that it takes for the concentration of a substance in blood plasma to reach one-half of its steady-state value (the "plasma half-life"). The relationship between the biological and plasma half-lives of a substance can be complex, due to factors including accumulation in tissues, active metabolites, and receptor interactions.[5]
While a radioactive isotope decays almost perfectly according to so-called "first order kinetics" where the rate constant is a fixed number, the elimination of a substance from a living organism usually follows more complex chemical kinetics.

For example, the biological half-life of water in a human being is about 9 to 10 days,[citation needed] though this can be altered by behavior and various other conditions. The biological half-life of cesium in human beings is between one and four months.

Sunday, April 2, 2017

Clausius–Clapeyron relation

From Wikipedia, the free encyclopedia

The Clausius–Clapeyron relation, named after Rudolf Clausius[1] and Benoît Paul Émile Clapeyron,[2] is a way of characterizing a discontinuous phase transition between two phases of matter of a single constituent. On a pressuretemperature (P–T) diagram, the line separating the two phases is known as the coexistence curve. The Clausius–Clapeyron relation gives the slope of the tangents to this curve. Mathematically,
{\frac {\mathrm {d} P}{\mathrm {d} T}}={\frac {L}{T\,\Delta v}}={\frac {\Delta s}{\Delta v}},
where \mathrm {d} P/\mathrm {d} T is the slope of the tangent to the coexistence curve at any point, L is the specific latent heat, T is the temperature, \Delta v is the specific volume change of the phase transition, and \Delta s is the specific entropy change of the phase transition.

Derivations

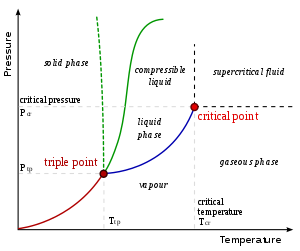
A typical phase diagram. The dotted green line gives the anomalous behavior of water. The Clausius–Clapeyron relation can be used to find the relationship between pressure and temperature along phase boundaries.

Derivation from state postulate

Using the state postulate, take the specific entropy s for a homogeneous substance to be a function of specific volume v and temperature T.[3]:508
\mathrm {d} s=\left({\frac {\partial s}{\partial v}}\right)_{T}\mathrm {d} v+\left({\frac {\partial s}{\partial T}}\right)_{v}\mathrm {d} T.
The Clausius–Clapeyron relation characterizes behavior of a closed system during a phase change, during which temperature and pressure are constant by definition. Therefore,[3]:508
\mathrm{d} s = \left(\frac{\partial s}{\partial v}\right)_T \mathrm{d} v.
Using the appropriate Maxwell relation gives[3]:508
{\displaystyle \mathrm {d} s=\left({\frac {\partial P}{\partial T}}\right)_{v}\mathrm {d} v}
where P is the pressure. Since pressure and temperature are constant, by definition the derivative of pressure with respect to temperature does not change.[4][5]:57, 62 & 671 Therefore, the partial derivative of specific entropy may be changed into a total derivative
{\displaystyle {\mathrm {d} s}={\frac {\mathrm {d} P}{\mathrm {d} T}}{\mathrm {d} v}}
and the total derivative of pressure with respect to temperature may be factored out when integrating from an initial phase \alpha to a final phase \beta ,[3]:508 to obtain
{\displaystyle {\frac {\mathrm {d} P}{\mathrm {d} T}}={\frac {\Delta s}{\Delta v}}}
where \Delta s\equiv s_{\beta}-s_{\alpha} and \Delta v\equiv v_{\beta}-v_{\alpha} are respectively the change in specific entropy and specific volume. Given that a phase change is an internally reversible process, and that our system is closed, the first law of thermodynamics holds
{\displaystyle \mathrm {d} u=\delta q+\delta w=T\;\mathrm {d} s-P\;\mathrm {d} v}
where u is the internal energy of the system. Given constant pressure and temperature (during a phase change) and the definition of specific enthalpy h, we obtain
{\displaystyle \mathrm {d} h=\mathrm {d} u+P\;\mathrm {d} v}
{\displaystyle \mathrm {d} h=T\;\mathrm {d} s}
{\mathrm  {d}}s={\frac  {{\mathrm  {d}}h}{T}}
Given constant pressure and temperature (during a phase change), we obtain[3]:508
\Delta s={\frac  {\Delta h}{T}}
Substituting the definition of specific latent heat L=\Delta h gives
\Delta s={\frac  {L}{T}}
Substituting this result into the pressure derivative given above ({\mathrm  {d}}P/{\mathrm  {d}}T={\mathrm  {\Delta s}}/{\mathrm  {\Delta v}}), we obtain[3]:508[6]
\frac{\mathrm{d} P}{\mathrm{d} T} = \frac {L}{T \Delta v}.
This result (also known as the Clapeyron equation) equates the slope of the tangent to the coexistence curve \mathrm {d} P/\mathrm {d} T, at any given point on the curve, to the function {L}/{T{\Delta v}} of the specific latent heat L, the temperature T, and the change in specific volume \Delta v.

Derivation from Gibbs–Duhem relation

Suppose two phases, \alpha and \beta , are in contact and at equilibrium with each other. Their chemical potentials are related by
\mu_{\alpha} = \mu_{\beta}.
Furthermore, along the coexistence curve,
\mathrm{d}\mu_{\alpha} = \mathrm{d}\mu_{\beta}.
One may therefore use the Gibbs–Duhem relation
\mathrm{d}\mu = M(-s\mathrm{d}T + v\mathrm{d}P)
(where s is the specific entropy, v is the specific volume, and M is the molar mass) to obtain
-(s_{{\beta }}-s_{{\alpha }}){\mathrm  {d}}T+(v_{{\beta }}-v_{{\alpha }}){\mathrm  {d}}P=0
Rearrangement gives
{\frac  {{\mathrm  {d}}P}{{\mathrm  {d}}T}}={\frac  {s_{{\beta }}-s_{{\alpha }}}{v_{{\beta }}-v_{{\alpha }}}}={\frac  {\Delta s}{\Delta v}}
from which the derivation of the Clapeyron equation continues as in the previous section.

Ideal gas approximation at low temperatures

When the phase transition of a substance is between a gas phase and a condensed phase (liquid or solid), and occurs at temperatures much lower than the critical temperature of that substance, the specific volume of the gas phase v_{\mathrm{g}} greatly exceeds that of the condensed phase v_{\mathrm{c}}. Therefore, one may approximate
\Delta v =v_{\mathrm{g}}\left(1-\tfrac{v_{\mathrm{c}}}{v_{\mathrm{g}}}\right)\approx v_{\mathrm{g}}
at low temperatures. If pressure is also low, the gas may be approximated by the ideal gas law, so that
v_{{{\mathrm  {g}}}}=RT/P
where P is the pressure, R is the specific gas constant, and T is the temperature. Substituting into the Clapeyron equation
{\frac  {{\mathrm  {d}}P}{{\mathrm  {d}}T}}={\frac  {\Delta s}{\Delta v}}
we can obtain the Clausius–Clapeyron equation[3]:509
{\displaystyle {\frac {\mathrm {d} P}{\mathrm {d} T}}={\frac {PL}{T^{2}R}}}
for low temperatures and pressures,[3]:509 where L is the specific latent heat of the substance.
Let (P_1,T_1) and (P_2,T_2) be any two points along the coexistence curve between two phases \alpha and \beta . In general, L varies between any two such points, as a function of temperature. But if L is constant,
\frac {\mathrm{d} P}{P} = \frac {L}{R} \frac {\mathrm{d}T}{T^2},
{\displaystyle \int _{P_{1}}^{P_{2}}{\frac {\mathrm {d} P}{P}}={\frac {L}{R}}\int _{T_{1}}^{T_{2}}{\frac {\mathrm {d} T}{T^{2}}}}
\left. \ln P\right|_{P=P_1}^{P_2} = -\frac{L}{R} \cdot \left.\frac{1}{T}\right|_{T=T_1}^{T_2}
or[5]:672
\ln {\frac  {P_{1}}{P_{2}}}=-{\frac  {L}{R}}\left({\frac  {1}{T_{1}}}-{\frac  {1}{T_{2}}}\right)
These last equations are useful because they relate equilibrium or saturation vapor pressure and temperature to the latent heat of the phase change, without requiring specific volume data.

Applications

Chemistry and chemical engineering

For transitions between a gas and a condensed phase with the approximations described above, the expression may be rewritten as
\ln P=-{\frac  {L}{R}}\left({\frac  {1}{T}}\right)+c
where c is a constant. For a liquid-gas transition, L is the specific latent heat (or specific enthalpy) of vaporization; for a solid-gas transition, L is the specific latent heat of sublimation. If the latent heat is known, then knowledge of one point on the coexistence curve determines the rest of the curve. Conversely, the relationship between \ln P and 1/T is linear, and so linear regression is used to estimate the latent heat.

Meteorology and climatology

Atmospheric water vapor drives many important meteorologic phenomena (notably precipitation), motivating interest in its dynamics. The Clausius–Clapeyron equation for water vapor under typical atmospheric conditions (near standard temperature and pressure) is
{\frac  {{\mathrm  {d}}e_{s}}{{\mathrm  {d}}T}}={\frac  {L_{v}(T)e_{s}}{R_{v}T^{2}}}
where:
The temperature dependence of the latent heat L_{v}(T), and therefore of the saturation vapor pressure e_{s}(T), cannot be neglected in this application. Fortunately, the August-Roche-Magnus formula provides a very good approximation, using pressure in hPa and temperature in Celsius:
e_{s}(T)=6.1094\exp \left({\frac  {17.625T}{T+243.04}}\right) [7][8]
(This is also sometimes called the Magnus or Magnus-Tetens approximation, though this attribution is historically inaccurate.[9])

Under typical atmospheric conditions, the denominator of the exponent depends weakly on T (for which the unit is Celsius). Therefore, the August-Roche-Magnus equation implies that saturation water vapor pressure changes approximately exponentially with temperature under typical atmospheric conditions, and hence the water-holding capacity of the atmosphere increases by about 7% for every 1 °C rise in temperature.[10]

Example

One of the uses of this equation is to determine if a phase transition will occur in a given situation. Consider the question of how much pressure is needed to melt ice at a temperature {\Delta T} below 0 °C. Note that water is unusual in that its change in volume upon melting is negative. We can assume
 {\Delta P} = \frac{L}{T\,\Delta v} {\Delta T}
and substituting in
L = 3.34×10⁵ J/kg (latent heat of fusion for water),
T = 273 K (absolute temperature), and
\Delta v = −9.05×10⁻⁵ m³/kg (change in specific volume from solid to liquid),
we obtain
\frac{\Delta P}{\Delta T} = −13.5 MPa/K.
To provide a rough example of how much pressure this is, to melt ice at −7 °C (the temperature many ice skating rinks are set at) would require balancing a small car (mass = 1000 kg[11]) on a thimble (area = 1 cm²).

Second derivative

While the Clausius–Clapeyron relation gives the slope of the coexistence curve, it does not provide any information about its curvature or second derivative. The second derivative of the coexistence curve of phases 1 and 2 is given by [12]
{\displaystyle {\begin{aligned}{\frac {\mathrm {d} ^{2}P}{\mathrm {d} T^{2}}}={\frac {1}{v_{2}-v_{1}}}\left[{\frac {c_{p2}-c_{p1}}{T}}-2(v_{2}\alpha _{2}-v_{1}\alpha _{1}){\frac {\mathrm {d} P}{\mathrm {d} T}}\right]+\\{\frac {1}{v_{2}-v_{1}}}\left[(v_{2}\kappa _{T2}-v_{1}\kappa _{T1})\left({\frac {\mathrm {d} P}{\mathrm {d} T}}\right)^{2}\right],\end{aligned}}}
where subscripts 1 and 2 denote the different phases, c_{p} is the specific heat capacity at constant pressure, \alpha = (1/v)(\mathrm{d}v/\mathrm{d}T)_P is the thermal expansion coefficient, and \kappa_T = -(1/v)(\mathrm{d}v/\mathrm{d}P)_T is the isothermal compressibility.

Social privilege

From Wikipedia, the free encyclopedia https://en.wikipedi...