Search This Blog

Saturday, April 14, 2018

Red dwarf

From Wikipedia, the free encyclopedia


A red dwarf is a small and relatively cool star on the main sequence, of M spectral type. Red dwarfs range in mass from a low of 0.075 to about 0.50 solar mass and have a surface temperature of less than 4,000 K. Sometimes K-type main-sequence stars, with masses between 0.50-0.8 solar mass, are also included.

Red dwarfs are by far the most common type of star in the Milky Way, at least in the neighborhood of the Sun, but because of their low luminosity, individual red dwarfs cannot be easily observed. From Earth, not one is visible to the naked eye.[1] Proxima Centauri, the nearest star to the Sun, is a red dwarf (Type M5, apparent magnitude 11.05), as are fifty of the sixty nearest stars. According to some estimates, red dwarfs make up three-quarters of the stars in the Milky Way.[2]

Stellar models indicate that red dwarfs less than 0.35 M are fully convective.[3] Hence the helium produced by the thermonuclear fusion of hydrogen is constantly remixed throughout the star, avoiding helium buildup at the core, thereby prolonging the period of fusion. Red dwarfs therefore develop very slowly, maintaining a constant luminosity and spectral type for trillions of years, until their fuel is depleted. Because of the comparatively short age of the universe, no red dwarfs exist at advanced stages of evolution.

Definition


Proxima Centauri, the closest star to the Sun at 4.2 ly, is a red dwarf

The term "red dwarf" when used to refer to a star does not have a strict definition. One of the earliest uses of the term was in 1915, used simply to contrast "red" dwarf stars from hotter "blue" dwarf stars.[4] It became established use, although the definition remained vague.[5] In terms of which spectral types qualify as red dwarfs, different researchers picked different limits, for example K8–M5[6] or "later than K5".[7] Dwarf M star, abbreviated dM, was also used, but sometimes it also included stars of spectral type K.[8]

In modern usage, the definition of a red dwarf still varies. When explicitly defined, it typically includes late K- and early to mid-M-class stars,[9] but in many cases it is restricted just to M-class stars.[10][11] In some cases all K stars are included as red dwarfs,[12] and occasionally even earlier stars.[13]

The coolest true main-sequence stars are thought to have spectral types around L2 or L3, but many objects cooler than about M6 or M7 are brown dwarfs, insufficiently massive to sustain hydrogen-1 fusion.[14]

Description and characteristics

Red dwarfs are very-low-mass stars.[15] As a result, they have relatively low pressures, a low fusion rate, and hence, a low temperature. The energy generated is the product of nuclear fusion of hydrogen into helium by way of the proton–proton (PP) chain mechanism. Hence, these stars emit little light, sometimes as little as ​110,000 that of the Sun. Even the largest red dwarfs (for example HD 179930, HIP 12961 and Lacaille 8760) have only about 10% of the Sun's luminosity.[16] In general, red dwarfs less than 0.35 M transport energy from the core to the surface by convection. Convection occurs because of opacity of the interior, which has a high density compared to the temperature. As a result, energy transfer by radiation is decreased, and instead convection is the main form of energy transport to the surface of the star. Above this mass, a red dwarf will have a region around its core where convection does not occur.[17]


The predicted main-sequence lifetime of a red dwarf plotted against its mass relative to the Sun.[18]

Because low-mass red dwarfs are fully convective, helium does not accumulate at the core, and compared to larger stars such as the Sun, they can burn a larger proportion of their hydrogen before leaving the main sequence. As a result, red dwarfs have estimated lifespans far longer than the present age of the universe, and stars less than 0.8 M have not had time to leave the main sequence. The lower the mass of a red dwarf, the longer the lifespan. It is believed that the lifespan of these stars exceeds the expected 10-billion-year lifespan of our Sun by the third or fourth power of the ratio of the solar mass to their masses; thus, a 0.1 M red dwarf may continue burning for 10 trillion years.[15][19] As the proportion of hydrogen in a red dwarf is consumed, the rate of fusion declines and the core starts to contract. The gravitational energy released by this size reduction is converted into heat, which is carried throughout the star by convection.[20]
Typical characteristics[21]
Stellar
class
Mass
(M)
Radius
(R)
Luminosity
(L)
Teff
(K)
M0V 60% 62% 7.2% 3,800
M1V 49% 49% 3.5% 3,600
M2V 44% 44% 2.3% 3,400
M3V 36% 39% 1.5% 3,250
M4V 20% 26% 0.55% 3,100
M5V 14% 20% 0.22% 2,800
M6V 10% 15% 0.09% 2,600
M7V 9% 12% 0.05% 2,500
M8V 8% 11% 0.03% 2,400
M9V 7.5% 8% 0.015% 2,300

According to computer simulations, the minimum mass a red dwarf must have in order to eventually evolve into a red giant is 0.25 M; less massive objects, as they age, would increase their surface temperatures and luminosities becoming blue dwarfs and finally white dwarfs.[18]

The less massive the star, the longer this evolutionary process takes. It has been calculated that a 0.16 M red dwarf (approximately the mass of the nearby Barnard's Star) would stay on the main sequence for 2.5 trillion years, followed by five billion years as a blue dwarf, during which the star would have one third of the Sun's luminosity (L) and a surface temperature of 6,500–8,500 kelvins.[18]

The fact that red dwarfs and other low-mass stars still remain on the main sequence when more massive stars have moved off the main sequence allows the age of star clusters to be estimated by finding the mass at which the stars move off the main sequence. This provides a lower limit to the age of the Universe and also allows formation timescales to be placed upon the structures within the Milky Way, such as the Galactic halo and Galactic disk.

All observed red dwarfs contain "metals", which in astronomy are elements heavier than hydrogen and helium. The Big Bang model predicts that the first generation of stars should have only hydrogen, helium, and trace amounts of lithium, and hence would be of low metallicity. With their extreme lifespans, any red dwarfs that were a part of that first generation (population III stars) should still exist today. Low metallicity red dwarfs, however, are rare. There are several explanations for the missing population of metal-poor red dwarfs. The preferred explanation is that, without heavy elements, only large stars can form. Large stars rapidly burn out and explode as supernova, spewing heavy elements that then allow higher metallicity stars population II stars, including red dwarfs to form. Alternative explanations of the scarcity of metal-poor red dwarfs, such as their dimness and scarcity, are considered less likely because they appear to conflict with stellar-evolution models.[citation needed]

Spectral standard stars


Gliese 623 is a pair of red dwarfs, with GJ 623a on the left and the fainter GJ 623b to the right of center.

The spectral standards for M-type stars have changed slightly over the years, but settled down somewhat since the early 1990s. Part of this is due to the fact that even the nearest red dwarfs are fairly faint, and the study of mid- to late-M dwarfs has progressed only in the past few decades due to evolution of astronomical techniques, from photographic plates to charged-couple devices (CCDs) to infrared-sensitive arrays.

The revised Yerkes Atlas system (Johnson & Morgan 1953)[22] listed only 2 M-type spectral standard stars: HD 147379 (M0 V) and HD 95735/Lalande 21185 (M2 V). While HD 147379 was not considered a standard by expert classifiers in later compendia of standards, Lalande 21185 is still a primary standard for M2 V. Robert Garrison[23] does not list any "anchor" standards among the red dwarfs, but Lalande 21185 has survived as a M2 V standard through many compendia.[22][24][25] The review on MK classification by Morgan & Keenan (1973) did not contain red dwarf standards. In the mid-1970s, red dwarf standard stars were published by Keenan & McNeil (1976)[26] and Boeshaar (1976),[27] but unfortunately there was little agreement among the standards. As later cooler stars were identified through the 1980s, it was clear that an overhaul of the red dwarf standards was needed. Building primarily upon the Boeshaar standards, a group at Steward Observatory (Kirkpatrick, Henry, & McCarthy 1991)[25] filled in the spectral sequence from K5 V to M9 V. It is these M-type dwarf standard stars which have largely survived as the main standards to the modern day. There have been negligible changes in the red dwarf spectral sequence since 1991. Additional red dwarf standards were compiled by Henry et al. (2002),[28] and D. Kirkpatrick has recently reviewed the classification of red dwarfs and standard stars in Gray & Corbally's 2009 monograph.[29] The M-dwarf primary spectral standards are: GJ 270 (M0 V), GJ 229A (M1 V), Lalande 21185 (M2 V), Gliese 581 (M3 V), Gliese 402 (M4 V), GJ 51 (M5 V), Wolf 359 (M6 V), Van Biesbroeck 8 (M7 V), VB 10 (M8 V), LHS 2924 (M9 V).

Planets


Artist's conception of a red dwarf, the most common type of star in the Sun's stellar neighborhood, and in the universe. Although termed a red dwarf, the surface temperature of this star would give it an orange hue when viewed from close proximity.

Many red dwarfs are orbited by exoplanets, but large Jupiter-sized planets are comparatively rare. Doppler surveys of a wide variety of stars indicate about 1 in 6 stars with twice the mass of the Sun are orbited by one or more Jupiter-sized planets, versus 1 in 16 for Sun-like stars and only 1 in 50 for red dwarfs. On the other hand, microlensing surveys indicate that long-orbital-period Neptune-mass planets are found around one in three red dwarfs. [30] Observations with HARPS further indicate 40% of red dwarfs have a "super-Earth" class planet orbiting in the habitable zone where liquid water can exist on the surface.[31] Computer simulations of the formation of planets around low mass stars predict that Earth-sized planets are most abundant, but more than 90% of the simulated planets are at least 10% water by mass, suggesting that many Earth-sized planets orbiting red dwarf stars are covered in deep oceans. [32]

At least four and possibly up to six exoplanets were discovered orbiting within the Gliese 581 planetary system between 2005 and 2010. One planet has about the mass of Neptune, or 16 Earth masses (M). It orbits just 6 million kilometers (0.04 AU) from its star, and is estimated to have a surface temperature of 150 °C, despite the dimness of its star. In 2006, an even smaller exoplanet (only 5.5 M) was found orbiting the red dwarf OGLE-2005-BLG-390L; it lies 390 million km (2.6 AU) from the star and its surface temperature is −220 °C (56 K).

In 2007, a new, potentially habitable exoplanet, Gliese 581c, was found, orbiting Gliese 581. The minimum mass estimated by its discoverers (a team led by Stephane Udry) is 5.36 M. The discoverers estimate its radius to be 1.5 times that of Earth (R). Since then Gliese 581d, which is also potentially habitable, was discovered.

Gliese 581c and d are within the habitable zone of the host star, and are two of the most likely candidates for habitability of any exoplanets discovered so far.[33] Gliese 581g, detected September 2010,[34] has a near-circular orbit in the middle of the star's habitable zone. However, the planet's existence is contested.[35]

On 23 February 2017 NASA announced the discovery of seven Earth-sized planets orbiting the red dwarf star TRAPPIST-1 approximately 39 light-years away in the constellation Aquarius. The planets were discovered through the transit method, meaning we have mass and radius information for all of them. TRAPPIST-1e, f and g appear to be within the habitable zone and may have liquid water on the surface.[36]

Habitability
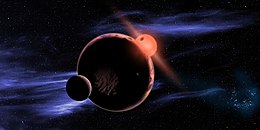

An artist's impression of a planet with two exomoons orbiting in the habitable zone of a red dwarf.

Planetary habitability of red dwarf systems is subject to some debate. In spite of their great numbers and long lifespans, there are several factors which may make life difficult on planets around a red dwarf. First, planets in the habitable zone of a red dwarf would be so close to the parent star that they would likely be tidally locked. This would mean that one side would be in perpetual daylight and the other in eternal night. This could create enormous temperature variations from one side of the planet to the other. Such conditions would appear to make it difficult for forms of life similar to those on Earth to evolve. And it appears there is a great problem with the atmosphere of such tidally locked planets: the perpetual night zone would be cold enough to freeze the main gases of their atmospheres, leaving the daylight zone nude and dry. On the other hand, recent theories propose that either a thick atmosphere or planetary ocean could potentially circulate heat around such a planet.[37]

Variability in stellar energy output may also have negative impacts on the development of life. Red dwarfs are often flare stars, which can emit gigantic flares, doubling their brightness in minutes. This variability may also make it difficult for life to develop and persist near a red dwarf. It may be possible for a planet orbiting close to a red dwarf to keep its atmosphere even if the star flares.[38] However, more-recent research suggests that these stars may be the source of constant high-energy flares and very large magnetic fields, diminishing the possibility of life as we know it. Whether this is a peculiarity of the star under examination or a feature of the entire class remains to be determined.[39]
Sunday, April 8, 2018

Great Oxygenation Event

From Wikipedia, the free encyclopedia
 
O2 build-up in the Earth's atmosphere. Red and green lines represent the range of the estimates while time is measured in billions of years ago (Ga).
 
Stage 1 (3.85–2.45 Ga): Practically no O2 in the atmosphere. The oceans were also largely anoxic with the possible exception of O2 gases in the shallow oceans.
 
Stage 2 (2.45–1.85 Ga): O2 produced, and rose to values of 0.02 and 0.04 atm, but absorbed in oceans and seabed rock.
 
Stage 3 (1.85–0.85 Ga): O2 starts to gas out of the oceans, but is absorbed by land surfaces. There was no significant change in terms of oxygen level.
 
Stages 4 and 5 (0.85–present): O2 sinks filled and the gas accumulates.[1]

The Great Oxygenation Event, the beginning of which is commonly known in scientific media as the Great Oxidation Event (GOE, also called the Oxygen Catastrophe, Oxygen Crisis, Oxygen Holocaust,[2] Oxygen Revolution, or Great Oxidation) was the biologically induced appearance of dioxygen (O2) in Earth's atmosphere.[3] Geological, isotopic, and chemical evidence suggest that this major environmental change happened around 2.45 billion years ago (2.45 Ga),[4] during the Siderian period, at the beginning of the Proterozoic eon. The causes of the event are not clear.[5] The current geochemical and biomarker evidence for the development of oxygenic photosynthesis before the Great Oxidation Event has been mostly inconclusive.[6]

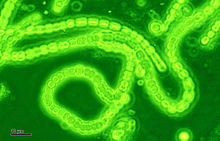
Oceanic cyanobacteria, which evolved into coordinated (but not multicellular or even colonial) macroscopic forms more than 2.3 billion years ago (approximately 200 million years before the GOE),[7] are believed to have become the first microbes to produce oxygen by photosynthesis.[8] Before the GOE, any free oxygen they produced was chemically captured by dissolved iron or organic matter. The GOE started when these oxygen sinks became saturated, at which point oxygen produced by the cyanobacteria was free to escape into the atmosphere.

Cyanobacteria: Responsible for the buildup of oxygen in the Earth's atmosphere

The increased production of oxygen set Earth's original atmosphere off balance.[9] Free oxygen is toxic to obligate anaerobic organisms, and the rising concentrations may have destroyed most such organisms at the time. Cyanobacteria were therefore responsible for one of the most significant mass extinctions in Earth's history. Besides marine cyanobacteria, there is also evidence of cyanobacteria on land.[citation needed]

A spike in chromium contained in ancient rock deposits formed underwater shows the accumulation had been washed off from the continental shelves. Chromium is not easily dissolved and its release from rocks would have required the presence of a powerful acid. One such acid, sulfuric acid (H2SO4), might have been created through bacterial reactions with pyrite.[10] Mats of oxygen-producing cyanobacteria can produce a thin layer, one or two millimeters thick, of oxygenated water in an otherwise anoxic environment even under thick ice, and before oxygen started accumulating in the atmosphere, these organisms would already be adapted to oxygen.[11] Additionally, the free oxygen would have reacted with atmospheric methane, a greenhouse gas, greatly reducing its concentration and triggering the Huronian glaciation, possibly the longest episode of glaciation in Earth's history and called snowball Earth.[12]

Eventually, the evolution of aerobic organisms that consumed oxygen established an equilibrium in its availability. Free oxygen has been an important constituent of the atmosphere ever since.[12]

Timing

The most widely accepted chronology of the Great Oxygenation Event suggests that free oxygen was first produced by prokaryotic and then later eukaryotic organisms that carried out photosynthesis more efficiently, producing oxygen as a waste product. These organisms lived long before the GOE,[13] perhaps as early as 3,400 million years ago.[14][15]
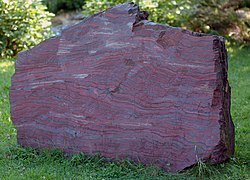
Initially, the oxygen they produced would have quickly been removed from the atmosphere by the chemical weathering of reducing (oxidizable) minerals, most notably iron. This 'mass rusting' led to the deposition of iron(III) oxide in the form of banded-iron formations such as the sediments in Minnesota and Pilbara, Western Australia. The saturation of these mineral sinks, and the resulting persistence of oxygen in the atmosphere, led within 50 million years to the start of the GOE.[16] Oxygen could have accumulated very rapidly: at today's rates of photosynthesis (much greater than those in the Precambrian without land plants), modern atmospheric O2 levels could be produced in only 2,000 years.[17]

Another hypothesis is that oxygen producers did not evolve until a few million years before the major rise in atmospheric oxygen concentration.[18] This is based on a particular interpretation of a supposed oxygen indicator used in previous studies, the mass-independent fractionation of sulfur isotopes. This hypothesis would eliminate the need to explain a lag in time between the evolution of oxyphotosynthetic microbes and the rise in free oxygen.

In either case, oxygen did eventually accumulate in the atmosphere, with two major consequences.

Firstly, it oxidized atmospheric methane (a strong greenhouse gas) to carbon dioxide (a weaker one) and water. This decreased the greenhouse effect of the Earth's atmosphere, causing planetary cooling, and triggered the Huronian glaciation. Starting around 2.4 billion years ago, this lasted 300-400 million years, and may have been the longest ever snowball Earth episode.[18][19]

Secondly, the increased oxygen concentrations provided a new opportunity for biological diversification, as well as tremendous changes in the nature of chemical interactions between rocks, sand, clay, and other geological substrates and the Earth's air, oceans, and other surface waters. Despite the natural recycling of organic matter, life had remained energetically limited until the widespread availability of oxygen. This breakthrough in metabolic evolution greatly increased the free energy availabile to living organisms, with global environmental impacts. For example, mitochondria evolved after the GOE, giving organisms the energy to exploit new, more complex morphologies interacting in increasingly complex ecosystems.[20]

Timeline of glaciations, shown in blue.

Time lag theory

There may have been a gap of up to 900 million years between the start of photosynthetic oxygen production and the geologically rapid increase in atmospheric oxygen about 2.5–2.4 billion years ago. Several hypotheses propose to explain this time lag.

Tectonic trigger

2.1 billion year old rock showing banded iron formation

The oxygen increase had to await tectonically driven changes in the Earth, including the appearance of shelf seas, where reduced organic carbon could reach the sediments and be buried.[21] The newly produced oxygen was first consumed in various chemical reactions in the oceans, primarily with iron. Evidence is found in older rocks that contain massive banded iron formations apparently laid down as this iron and oxygen first combined; most present-day iron ore lies in these deposits. Evidence suggests oxygen levels spiked each time smaller land masses collided to form a super-continent. Tectonic pressure thrust up mountain chains, which eroded to release nutrients into the ocean to feed photosynthetic cyanobacteria.[22]

Nickel famine

Early chemosynthetic organisms likely produced methane, an important trap for molecular oxygen, since methane readily oxidizes to carbon dioxide (CO2) and water in the presence of UV radiation. Modern methanogens require nickel as an enzyme cofactor. As the Earth's crust cooled and the supply of volcanic nickel dwindled, oxygen-producing algae began to out-perform methane producers, and the oxygen percentage of the atmosphere steadily increased.[23] From 2.7 to 2.4 billion years ago, the rate of deposition of nickel declined steadily from a level 400 times today's.[24]

Bistability

Another hypothesis posits a model of the atmosphere that exhibits bistability: two steady states of oxygen concentration. The state of stable low oxygen conentration (0.02%) experiences a high rate of methane oxidation. If some event raises oxygen levels beyond a moderate threshold, the formation of an ozone layer shields UV rays and decreases methane oxidation, raising oxygen further to a stable state of 21% or more. The Great Oxygenation Event can then be understood as a transition from the lower to the upper steady states.[25]

Hydrogen gas

Another theory credits the appearance of cyanobacteria with suppressing hydrogen gas and increasing oxygen.

Some bacteria in the early oceans could separate water into hydrogen and oxygen. Under the Sun's rays, hydrogen molecules were incorporated into organic compounds, with oxygen as a by-product. If the hydrogen-heavy compounds were buried, it would have allowed oxygen to accumulate in the atmosphere.

However, in 2001 scientists realized that the hydrogen would instead escape into space through a process called methane photolysis, in which methane releases its hydrogen in a reaction with oxygen. This could explain why the early Earth stayed warm enough to sustain oxygen-producing lifeforms.[26]

Late evolution of oxy-photosynthesis theory

The oxygen indicator might have been misinterpreted. During the proposed lag era in the previous theory, there was a change in sediments from mass-independently fractionated (MIF) sulfur to mass-dependently fractionated (MDF) sulfur. This was assumed to show the appearance of oxygen in the atmosphere, since oxygen would have prevented the photolysis of sulfur dioxide, which causes MIF. However, the change from MIF to MDF of sulfur isotopes may instead have been caused by an increase in glacial weathering, or the homogenization of the marine sulfur pool as a result of an increased thermal gradient during the Huronian glaciation period (which in this interpretation was not caused by oxygenation).[18]

Role in mineral diversification

The Great Oxygenation Event triggered an explosive growth in the diversity of minerals, with many elements occurring in one or more oxidized forms near the Earth's surface.[27] It is estimated that the GOE was directly responsible for more than 2,500 of the total of about 4,500 minerals found on Earth today. Most of these new minerals were formed as hydrated and oxidized forms due to dynamic mantle and crust processes.[28]

Great Oxygenation
End of Huronian glaciation
Palæoproterozoic
Mesoproterozoic
Neoproterozoic
Palæozoic
Mesozoic
Cenozoic
−2500
−2300
−2100
−1900
−1700
−1500
−1300
−1100
−900
−700
−500
−300
−100
Million years ago. Age of Earth = 4,560


Origin of eukaryotes

It has been proposed that a local rise in oxygen levels due to cyanobacterial photosynthesis in ancient microenvironments was highly toxic to the surrounding biota, and that this selective pressure drove the evolutionary transformation of an archaeal lineage into the first eukaryotes.[29] Oxidative stress involving production of reactive oxygen species (ROS) might have acted in synergy with other environmental stresses (such as ultraviolet radiation and/or desiccation) to drive selection in an early archaeal lineage towards eukaryosis. This archaeal ancestor may already have had DNA repair mechanisms based on DNA pairing and recombination and possibly some kind of cell fusion mechanism.[30][31] The detrimental effects of internal ROS (produced by endosymbiont proto-mitochondria) on the archaeal genome could have promoted the evolution of meiotic sex from these humble beginnings.[30] Selective pressure for efficient DNA repair of oxidative DNA damages may have driven the evolution of eukaryotic sex involving such features as cell-cell fusions, cytoskeleton-mediated chromosome movements and emergence of the nuclear membrane.[29] Thus the evolution of eukaryotic sex and eukaryogenesis were likely inseparable processes that evolved in large part to facilitate DNA repair.[29][32] Constant pressure of endogenous ROS has been proposed to explain the ubiquitous maintenance of meiotic sex in eukaryotes.[30]

Saturday, April 7, 2018

Morse potential

From Wikipedia, the free encyclopedia

The Morse potential, named after physicist Philip M. Morse, is a convenient interatomic interaction model for the potential energy of a diatomic molecule. It is a better approximation for the vibrational structure of the molecule than the QHO (quantum harmonic oscillator) because it explicitly includes the effects of bond breaking, such as the existence of unbound states. It also accounts for the anharmonicity of real bonds and the non-zero transition probability for overtone and combination bands. The Morse potential can also be used to model other interactions such as the interaction between an atom and a surface. Due to its simplicity (only three fitting parameters), it is not used in modern spectroscopy. However, its mathematical form inspired the MLR (Morse/Long-range) potential, which is the most popular potential energy function used for fitting spectroscopic data.

Potential energy function

The Morse potential (blue) and harmonic oscillator potential (green). Unlike the energy levels of the harmonic oscillator potential, which are evenly spaced by ħω, the Morse potential level spacing decreases as the energy approaches the dissociation energy. The dissociation energy De is larger than the true energy required for dissociation D0 due to the zero point energy of the lowest (v = 0) vibrational level.
The Morse potential energy function is of the form
V(r)=D_{e}(1-e^{-a(r-r_{e})})^{2}
Here r is the distance between the atoms, r_{e} is the equilibrium bond distance, D_{e} is the well depth (defined relative to the dissociated atoms), and a controls the 'width' of the potential (the smaller a is, the larger the well). The dissociation energy of the bond can be calculated by subtracting the zero point energy E(0) from the depth of the well. The force constant of the bond can be found by Taylor expansion of V(r) around r=r_{e} to the second derivative of the potential energy function, from which it can be shown that the parameter, a, is
a={\sqrt {k_{e}/2D_{e}}},
where k_{e} is the force constant at the minimum of the well.

Since the zero of potential energy is arbitrary, the equation for the Morse potential can be rewritten any number of ways by adding or subtracting a constant value. When it is used to model the atom-surface interaction, the energy zero can be redefined so that the Morse potential becomes
V(r)=D_{e}((1-e^{-a(r-r_{e})})^{2}-1)
which is usually written as
V(r)=D_{e}(e^{-2a(r-r_{e})}-2e^{-a(r-r_{e})})
where r is now the coordinate perpendicular to the surface. This form approaches zero at infinite r and equals -D_{e} at its minimum, i.e. r=r_{e}. It clearly shows that the Morse potential is the combination of a short-range repulsion term (the former) and a long-range attractive term (the latter), analogous to the Lennard-Jones potential.

Vibrational states and energies

Like the quantum harmonic oscillator, the energies and eigenstates of the Morse potential can be found using operator methods.[1] One approach involves applying the factorization method to the Hamiltonian.

To write the stationary states on the Morse potential, i.e. solutions \Psi (v) and E(v) of the following Schrödinger equation:
\left(-{\frac {\hbar ^{2}}{2m}}{\frac {\partial ^{2}}{\partial r^{2}}}+V(r)\right)\Psi (v)=E(v)\Psi (v),
it is convenient to introduce the new variables:
x=ar{\text{;  }}x_{e}=ar_{e}{\text{;  }}\lambda ={\frac {\sqrt {2mD_{e}}}{a\hbar }}{\text{;  }}\varepsilon _{v}={\frac {2m}{a^{2}\hbar ^{2}}}E(v).
Then, the Schrödinger equation takes the simple form:
\left(-{\frac {\partial ^{2}}{\partial x^{2}}}+V(x)\right)\Psi _{n}(x)=\varepsilon _{n}\Psi _{n}(x),
V(x)=\lambda ^{2}\left(e^{-2\left(x-x_{e}\right)}-2e^{-\left(x-x_{e}\right)}\right).
Its eigenvalues and eigenstates can be written as:[2]
{\displaystyle \varepsilon _{n}=\lambda ^{2}-\left(\lambda -n-{\frac {1}{2}}\right)^{2}}
\Psi _{n}(z)=N_{n}z^{\lambda -n-{\frac {1}{2}}}e^{-{\frac {1}{2}}z}L_{n}^{(2\lambda -2n-1)}(z),
where z=2\lambda e^{-\left(x-x_{e}\right)}{\text{;  }}N_{n}=\left[{\frac {n!\left(2\lambda -2n-1\right)}{\Gamma (2\lambda -n)}}\right]^{\frac {1}{2}} and L_{n}^{(\alpha )}(z) is a generalized Laguerre polynomial:
L_{n}^{(\alpha )}(z)={\frac {z^{-\alpha }e^{z}}{n!}}{\frac {d^{n}}{dz^{n}}}\left(z^{n+\alpha }e^{-z}\right)={\frac {\Gamma (\alpha +n+1)/\Gamma (\alpha +1)}{\Gamma (n+1)}}\,_{1}F_{1}(-n,\alpha +1,z),
There also exists the following important analytical expression for matrix elements of the coordinate operator (here it is assumed that m>n and N=\lambda -{\frac {1}{2}}) [3]

\left\langle \Psi _{m}|x|\Psi _{n}\right\rangle ={\frac {2(-1)^{m-n+1}}{(m-n)(2N-n-m)}}{\sqrt {\frac {(N-n)(N-m)\Gamma (2N-m+1)m!}{\Gamma (2N-n+1)n!}}}.
The eigenenergies in the initial variables have form:
E(v)=h\nu _{0}(v+1/2)-{\frac {\left[h\nu _{0}(v+1/2)\right]^{2}}{4D_{e}}}
where v is the vibrational quantum number, and \nu _{0} has units of frequency, and is mathematically related to the particle mass, m, and the Morse constants via
\nu _{0}={\frac {a}{2\pi }}{\sqrt {2D_{e}/m}}.
Whereas the energy spacing between vibrational levels in the quantum harmonic oscillator is constant at h\nu _{0}, the energy between adjacent levels decreases with increasing v in the Morse oscillator. Mathematically, the spacing of Morse levels is
E(v+1)-E(v)=h\nu _{0}-(v+1)(h\nu _{0})^{2}/2D_{e}.\,
This trend matches the anharmonicity found in real molecules. However, this equation fails above some value of v_{m} where E(v_{m}+1)-E(v_{m}) is calculated to be zero or negative. Specifically,
v_{m}={\frac {2D_{e}-h\nu _{0}}{h\nu _{0}}}.
This failure is due to the finite number of bound levels in the Morse potential, and some maximum v_{m} that remains bound. For energies above v_{m}, all the possible energy levels are allowed and the equation for E(v) is no longer valid.

Below v_{m}, E(v) is a good approximation for the true vibrational structure in non-rotating diatomic molecules. In fact, the real molecular spectra are generally fit to the form1
E_{v}/hc=\omega _{e}(v+1/2)-\omega _{e}\chi _{e}(v+1/2)^{2}\,
in which the constants \omega _{e} and \omega _{e}\chi _{e} can be directly related to the parameters for the Morse potential.

As is clear from dimensional analysis, for historical reasons the last equation uses spectroscopic notation in which \omega _{e} represents a wavenumber obeying E=hc\omega , and not an angular frequency given by E=\hbar \omega .

Morse/Long-range potential

An important extension of the Morse potential that made the Morse form very useful for modern spectroscopy is the MLR (Morse/Long-range) potential.[4] The MLR potential is used as a standard for representing spectroscopic and/or virial data of diatomic molecules by a potential energy curve. It has been used on N2,[5] Ca2,[6] KLi,[7] MgH,[8][9][10] several electronic states of Li2,[4][11][12][13][9][12] Cs2,[14][15] Sr2,[16] ArXe,[9][17] LiCa,[18] LiNa,[19] Br2,[20] Mg2,[21] HF,[22][23] HCl,[22][23] HBr,[22][23] HI,[22][23] MgD,[8] Be2,[24] BeH,[25] and NaH.[26] More sophisticated versions are used for polyatomic molecules.

Social privilege

From Wikipedia, the free encyclopedia https://en.wikipedi...