Americans are used to thinking
that their nation is special. In many ways, it is: the U.S. has by far
the most Nobel Prize winners, the largest defense expenditures (almost
equal to the next 10 or so countries put together) and the most
billionaires (twice as many as China, the closest competitor). But some
examples of American Exceptionalism should not make us proud. By most
accounts, the U.S. has the highest level of economic inequality among
developed countries. It has the world's greatest per capita health
expenditures yet the lowest life expectancy among comparable countries.
It is also one of a few developed countries jostling for the dubious
distinction of having the lowest measures of equality of opportunity.
The notion of the American Dream—that, unlike old Europe, we are a
land of opportunity—is part of our essence. Yet the numbers say
otherwise. The life prospects of a young American depend more on the
income and education of his or her parents than in almost any other
advanced country. When poor-boy-makes-good anecdotes get passed around
in the media, that is precisely because such stories are so rare.
Things appear to be getting worse, partly as a result of forces, such
as technology and globalization, that seem beyond our control, but most
disturbingly because of those within our command. It is not the laws of
nature that have led to this dire situation: it is the laws of
humankind. Markets do not exist in a vacuum: they are shaped by rules
and regulations, which can be designed to favor one group over another.
President Donald Trump was right in saying that the system is rigged—by
those in the inherited plutocracy of which he himself is a member. And
he is making it much, much worse.
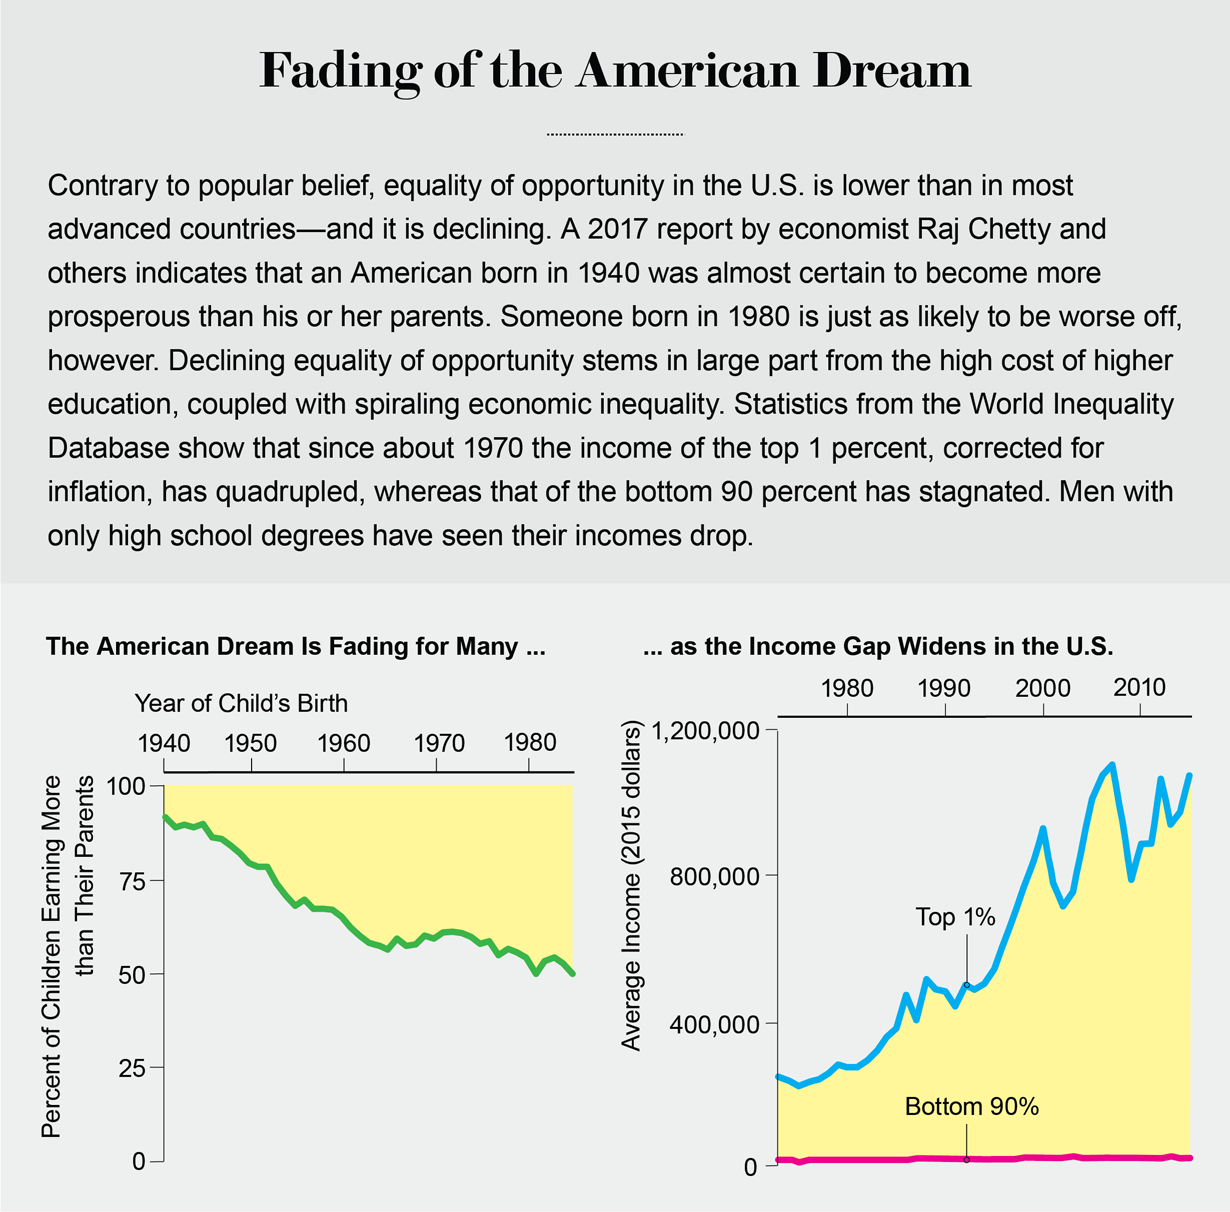
America has long outdone others in its level of inequality, but in
the past 40 years it has reached new heights. Whereas the income share
of the top 0.1 percent has more than quadrupled and that of the top 1
percent has almost doubled, that of the bottom 90 percent has declined.
Wages at the bottom, adjusted for inflation, are about the same as they
were some 60 years ago! In fact, for those with a high school education
or less, incomes have fallen over recent decades. Males have been
particularly hard hit, as the U.S. has moved away from manufacturing
industries into an economy based on services.
Deaths of Despair
Wealth is even less equally distributed, with just three Americans
having as much as the bottom 50 percent—testimony to how much money
there is at the top and how little there is at the bottom. Families in
the bottom 50 percent hardly have the cash reserves to meet an
emergency. Newspapers are replete with stories of those for whom the
breakdown of a car or an illness starts a downward spiral from which
they never recover.
In significant part because of high inequality [see “The
Health-Wealth Gap,” by Robert M. Sapolsky], U.S. life expectancy,
exceptionally low to begin with, is experiencing sustained declines.
This in spite of the marvels of medical science, many advances of which
occur right here in America and which are made readily available to the
rich. Economist Ann Case and 2015 Nobel laureate in economics Angus
Deaton describe one of the main causes of rising morbidity—the increase
in alcoholism, drug overdoses and suicides—as “deaths of despair” by
those who have given up hope.
Credit: Jen
Christiansen; Sources: “The Fading American Dream: Trends in Absolute
Income Mobility Since 1940,” by Raj Chetty et al., in Science, Vol. 356; April 28, 2017 (child-parent wealth comparison); World Inequality database (90% versus 1% wealth trend data)
Defenders of America's inequality have a pat explanation. They refer
to the workings of a competitive market, where the laws of supply and
demand determine wages, prices and even interest rates—a mechanical
system, much like that describing the physical universe. Those with
scarce assets or skills are amply rewarded, they argue, because of the
larger contributions they make to the economy. What they get merely
represents what they have contributed. Often they take out less than
they contributed, so what is left over for the rest is that much more.
This fictional narrative may at one time have assuaged the guilt of
those at the top and persuaded everyone else to accept this sorry state
of affairs. Perhaps the defining moment exposing the lie was the 2008
financial crisis, when the bankers who brought the global economy to the
brink of ruin with predatory lending, market manipulation and various
other antisocial practices walked away with millions of dollars in
bonuses just as millions of Americans lost their jobs and homes and tens
of millions more worldwide suffered on their account. Virtually none of
these bankers were ever held to account for their misdeeds.
I became aware of the fantastical nature of this narrative as a
schoolboy, when I thought of the wealth of the plantation owners, built
on the backs of slaves. At the time of the Civil War, the market value
of the slaves in the South was approximately half of the region's total
wealth, including the value of the land and the physical capital—the
factories and equipment. The wealth of at least this part of this nation
was not based on industry, innovation and commerce but rather on
exploitation. Today we have replaced this open exploitation with more
insidious forms, which have intensified since the Reagan-Thatcher
revolution of the 1980s. This exploitation, I will argue, is largely to
blame for the escalating inequality in the U.S.
After the New Deal of the 1930s, American inequality went into
decline. By the 1950s inequality had receded to such an extent that
another Nobel laureate in economics, Simon Kuznets, formulated what came
to be called Kuznets's law. In the early stages of development, as some
parts of a country seize new opportunities, inequalities grow, he
postulated; in the later stages, they shrink. The theory long fit the
data—but then, around the early 1980s, the trend abruptly reversed.
Explaining Inequality
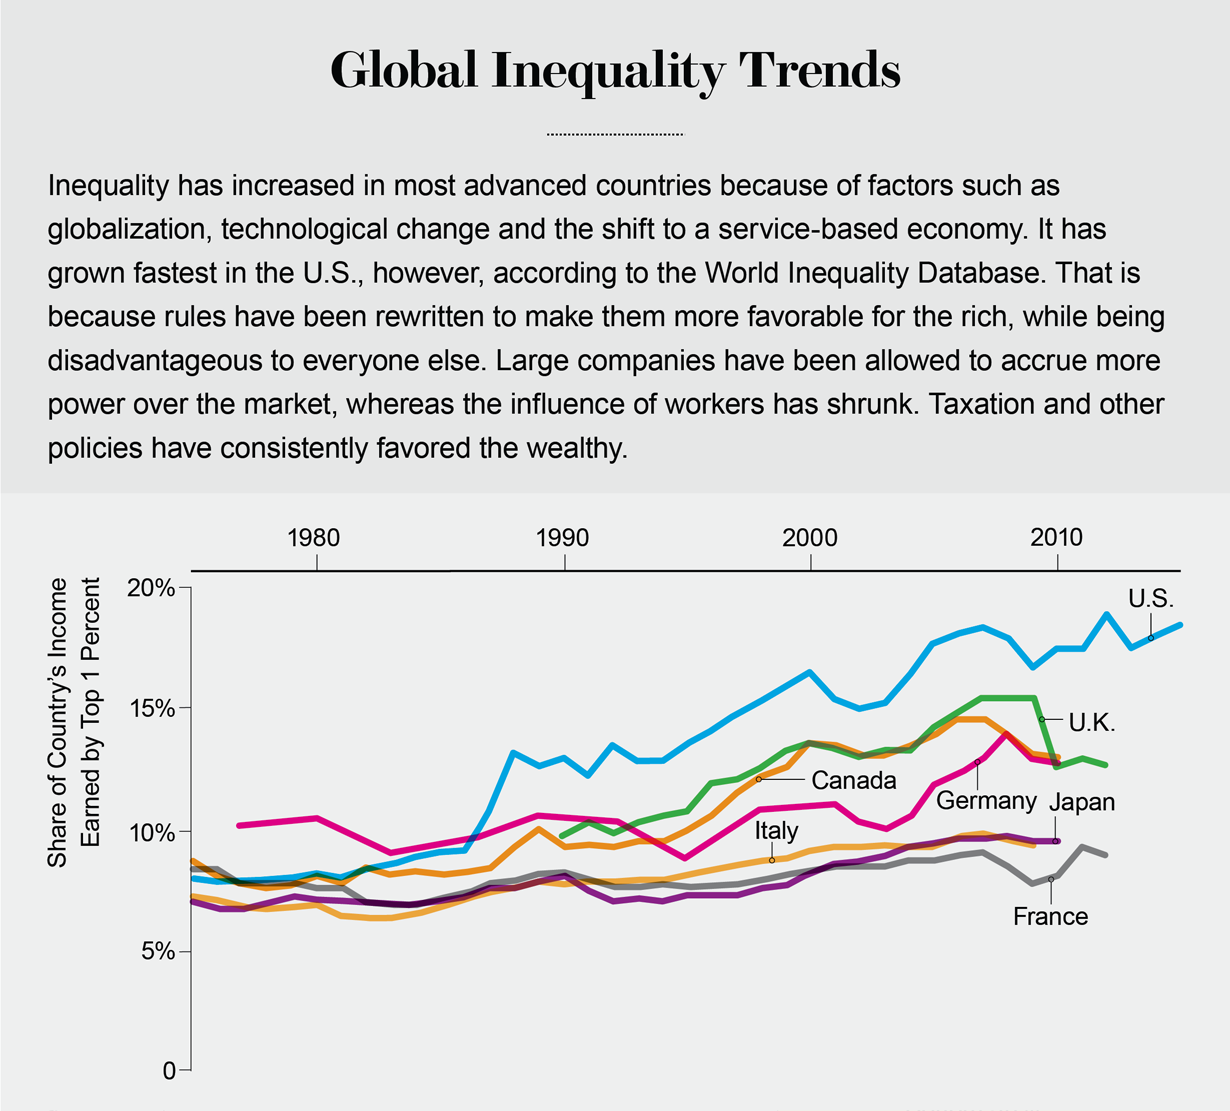
Economists have put forward a range of explanations for why
inequality has in fact been increasing in many developed countries. Some
argue that advances in technology have spurred the demand for skilled
labor relative to unskilled labor, thereby depressing the wages of the
latter. Yet that alone cannot explain why even skilled labor has done so
poorly over the past two decades, why average wages have done so badly
and why matters are so much worse in the U.S. than in other developed
nations. Changes in technology are global and should affect all advanced
economies in the same way. Other economists blame globalization itself,
which has weakened the power of workers. Firms can and do move abroad
unless demands for higher wages are curtailed. But again, globalization
has been integral to all advanced economies. Why is its impact so much
worse in the U.S.?
The shift from a manufacturing to a service-based economy is partly
to blame. At its extreme—a firm of one person—the service economy is a
winner-takes-all system. A movie star makes millions, for example,
whereas most actors make a pittance. Overall, wages are likely to be far
more widely dispersed in a service economy than in one based on
manufacturing, so the transition contributes to greater inequality. This
fact does not explain, however, why the average wage has not improved
for decades. Moreover, the shift to the service sector is happening in
most other advanced countries: Why are matters so much worse in the
U.S.?
Again, because services are often provided locally, firms have more
market power: the ability to raise prices above what would prevail in a
competitive market. A small town in rural America may have only one
authorized Toyota repair shop, which virtually every Toyota owner is
forced to patronize. The providers of these local services can raise
prices over costs, increasing their profits and the share of income
going to owners and managers. This, too, increases inequality. But
again, why is U.S. inequality practically unique?
In his celebrated 2013 treatise Capital in the Twenty-First Century,
French economist Thomas Piketty shifts the gaze to capitalists. He
suggests that the few who own much of a country's capital save so much
that, given the stable and high return to capital (relative to the
growth rate of the economy), their share of the national income has been
increasing. His theory has, however, been questioned on many grounds.
For instance, the savings rate of even the rich in the U.S. is so low,
compared with the rich in other countries, that the increase in
inequality should be lower here, not greater.
An alternative theory is far more consonant with the facts. Since the
mid-1970s the rules of the economic game have been rewritten, both
globally and nationally, in ways that advantage the rich and
disadvantage the rest. And they have been rewritten further in this
perverse direction in the U.S. than in other developed countries—even
though the rules in the U.S. were already less favorable to workers.
From this perspective, increasing inequality is a matter of choice: a
consequence of our policies, laws and regulations.
In the U.S., the market power of large corporations, which was
greater than in most other advanced countries to begin with, has
increased even more than elsewhere. On the other hand, the market power
of workers, which started out less than in most other advanced
countries, has fallen further than elsewhere. This is not only because
of the shift to a service-sector economy—it is because of the rigged
rules of the game, rules set in a political system that is itself rigged
through gerrymandering, voter suppression and the influence of money. A
vicious spiral has formed: economic inequality translates into
political inequality, which leads to rules that favor the wealthy, which
in turn reinforces economic inequality.
Feedback Loop
Political scientists have documented the ways in which money
influences politics in certain political systems, converting higher
economic inequality into greater political inequality. Political
inequality, in its turn, gives rise to more economic inequality as the
rich use their political power to shape the rules of the game in ways
that favor them—for instance, by softening antitrust laws and weakening
unions. Using mathematical models, economists such as myself have shown
that this two-way feedback loop between money and regulations leads to
at least two stable points. If an economy starts out with lower
inequality, the political system generates rules that sustain it,
leading to one equilibrium situation. The American system is the other
equilibrium—and will continue to be unless there is a democratic
political awakening.
An account of how the rules have been shaped must begin with
antitrust laws, first enacted 128 years ago in the U.S. to prevent the
agglomeration of market power. Their enforcement has weakened—at a time
when, if anything, the laws themselves should have been strengthened.
Technological changes have concentrated market power in the hands of a
few global players, in part because of so-called network effects: you
are far more likely to join a particular social network or use a certain
word processor if everyone you know is already using it. Once
established, a firm such as Facebook or Microsoft is hard to dislodge.
Moreover, fixed costs, such as that of developing a piece of software,
have increased as compared with marginal costs—that of duplicating the
software. A new entrant has to bear all these fixed costs up front, and
if it does enter, the rich incumbent can respond by lowering prices
drastically. The cost of making an additional e-book or photo-editing
program is essentially zero.
In short, entry is hard and risky, which gives established firms with
deep war chests enormous power to crush competitors and ultimately
raise prices. Making matters worse, U.S. firms have been innovative not
only in the products they make but in thinking of ways to extend and
amplify their market power. The European Commission has imposed fines of
billions of dollars on Microsoft and Google and ordered them to stop
their anticompetitive practices (such as Google privileging its own
comparison shopping service). In the U.S., we have done too little to
control concentrations of market power, so it is not a surprise that it
has increased in many sectors.
Credit: Jen Christiansen; Sources: Economic Report of the President. January 2017; World Inequality database
Rigged rules also explain why the impact of globalization may have
been worse in the U.S. A concerted attack on unions has almost halved
the fraction of unionized workers in the nation, to about 11 percent.
(In Scandinavia, it is roughly 70 percent.) Weaker unions provide
workers less protection against the efforts of firms to drive down wages
or worsen working conditions. Moreover, U.S. investment treaties such
as the North Atlantic Free Trade Agreement—treaties that were sold as a
way of preventing foreign countries from discriminating against American
firms—also protect investors against a tightening of environmental and
health regulations abroad. For instance, they enable corporations to sue
nations in private international arbitration panels for passing laws
that protect citizens and the environment but threaten the multinational
company's bottom line. Firms like these provisions, which enhance the
credibility of a company's threat to move abroad if workers do not
temper their demands. In short, these investment agreements weaken U.S.
workers' bargaining power even further.
Liberated Finance
Many other changes to our norms, laws, rules and regulations have
contributed to inequality. Weak corporate governance laws have allowed
chief executives in the U.S. to compensate themselves 361 times more
than the average worker, far more than in other developed countries.
Financial liberalization—the stripping away of regulations designed to
prevent the financial sector from imposing harms, such as the 2008
economic crisis, on the rest of society—has enabled the finance industry
to grow in size and profitability and has increased its opportunities
to exploit everyone else. Banks routinely indulge in practices that are
legal but should not be, such as imposing usurious interest rates on
borrowers or exorbitant fees on merchants for credit and debit cards and
creating securities that are designed to fail. They also frequently do
things that are illegal, including market manipulation and insider
trading. In all of this, the financial sector has moved money away from
ordinary Americans to rich bankers and the banks' shareholders. This
redistribution of wealth is an important contributor to American
inequality.
Other means of so-called rent extraction—the withdrawal of income
from the national pie that is incommensurate with societal
contribution—abound. For example, a legal provision enacted in 2003
prohibited the government from negotiating drug prices for Medicare—a
gift of some $50 billion a year or more to the pharmaceutical industry.
Special favors, such as extractive industries' obtaining public
resources such as oil at below fair-market value or banks' getting funds
from the Federal Reserve at near-zero interest rates (which they relend
at high interest rates), also amount to rent extraction. Further
exacerbating inequality is favorable tax treatment for the rich. In the
U.S., those at the top pay a smaller fraction of their income in taxes
than those who are much poorer—a form of largesse that the Trump
administration has just worsened with the 2017 tax bill.
Some economists have argued that we can lessen inequality only by
giving up on growth and efficiency. But recent research, such as work
done by Jonathan Ostry and others at the International Monetary Fund,
suggests that economies with greater equality perform better, with
higher growth, better average standards of living and greater stability.
Inequality in the extremes observed in the U.S. and in the manner
generated there actually damages the economy. The exploitation of market
power and the variety of other distortions I have described, for
instance, makes markets less efficient, leading to underproduction of
valuable goods such as basic research and overproduction of others, such
as exploitative financial products.
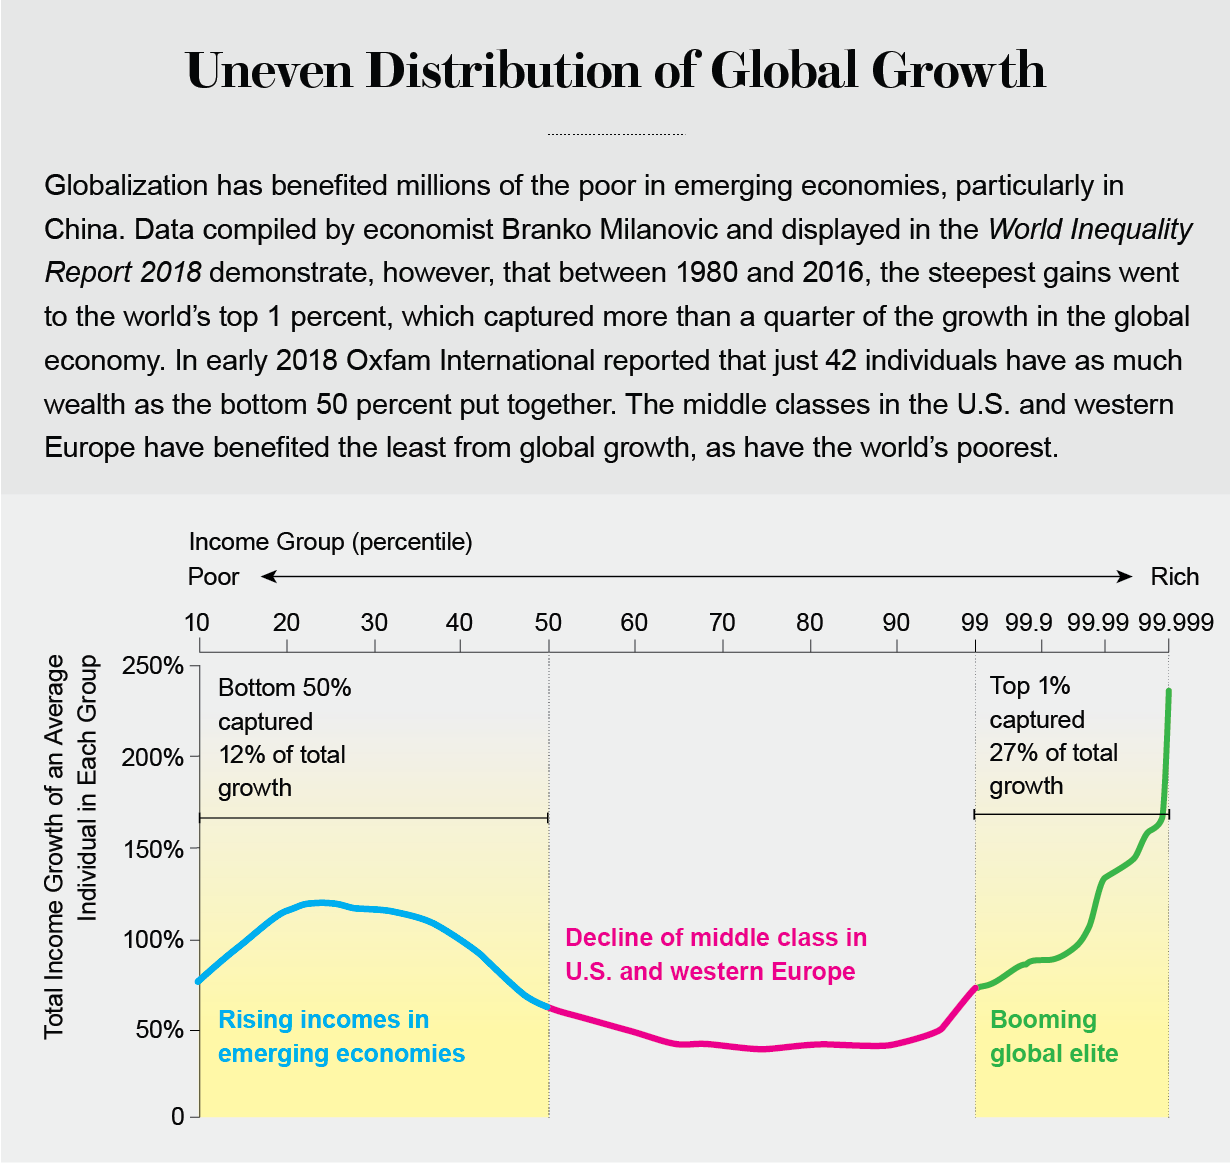
Credit: Jen Christiansen; Sources: World Inequality Report 2018. World Inequality Lab, 2017; Branko Milanovic
Moreover, because the rich typically spend a smaller fraction of
their income on consumption than the poor, total or “aggregate” demand
in countries with higher inequality is weaker. Societies could make up
for this gap by increasing government spending—on infrastructure,
education and health, for instance, all of which are investments
necessary for long-term growth. But the politics of unequal societies
typically puts the burden on monetary policy: interest rates are lowered
to stimulate spending. Artificially low interest rates, especially if
coupled with inadequate financial market regulation, often give rise to
bubbles, which is what happened with the 2008 housing crisis.
It is no surprise that, on average, people living in unequal
societies have less equality of opportunity: those at the bottom never
get the education that would enable them to live up to their potential.
This fact, in turn, exacerbates inequality while wasting the country's
most valuable resource: Americans themselves.
Restoring Justice
Morale is lower in unequal societies, especially when inequality is
seen as unjust, and the feeling of being used or cheated leads to lower
productivity. When those who run gambling casinos or bankers suffering
from moral turpitude make a zillion times more than the scientists and
inventors who brought us lasers, transistors and an understanding of
DNA, it is clear that something is wrong. Then again, the children of
the rich come to think of themselves as a class apart, entitled to their
good fortune, and accordingly more likely to break the rules necessary
for making society function. All of this contributes to a breakdown of
trust, with its attendant impact on social cohesion and economic
performance.
There is no magic bullet to remedy a problem as deep-rooted as
America's inequality. Its origins are largely political, so it is hard
to imagine meaningful change without a concerted effort to take money
out of politics—through, for instance, campaign finance reform. Blocking
the revolving doors by which regulators and other government officials
come from and return to the same industries they regulate and work with
is also essential.
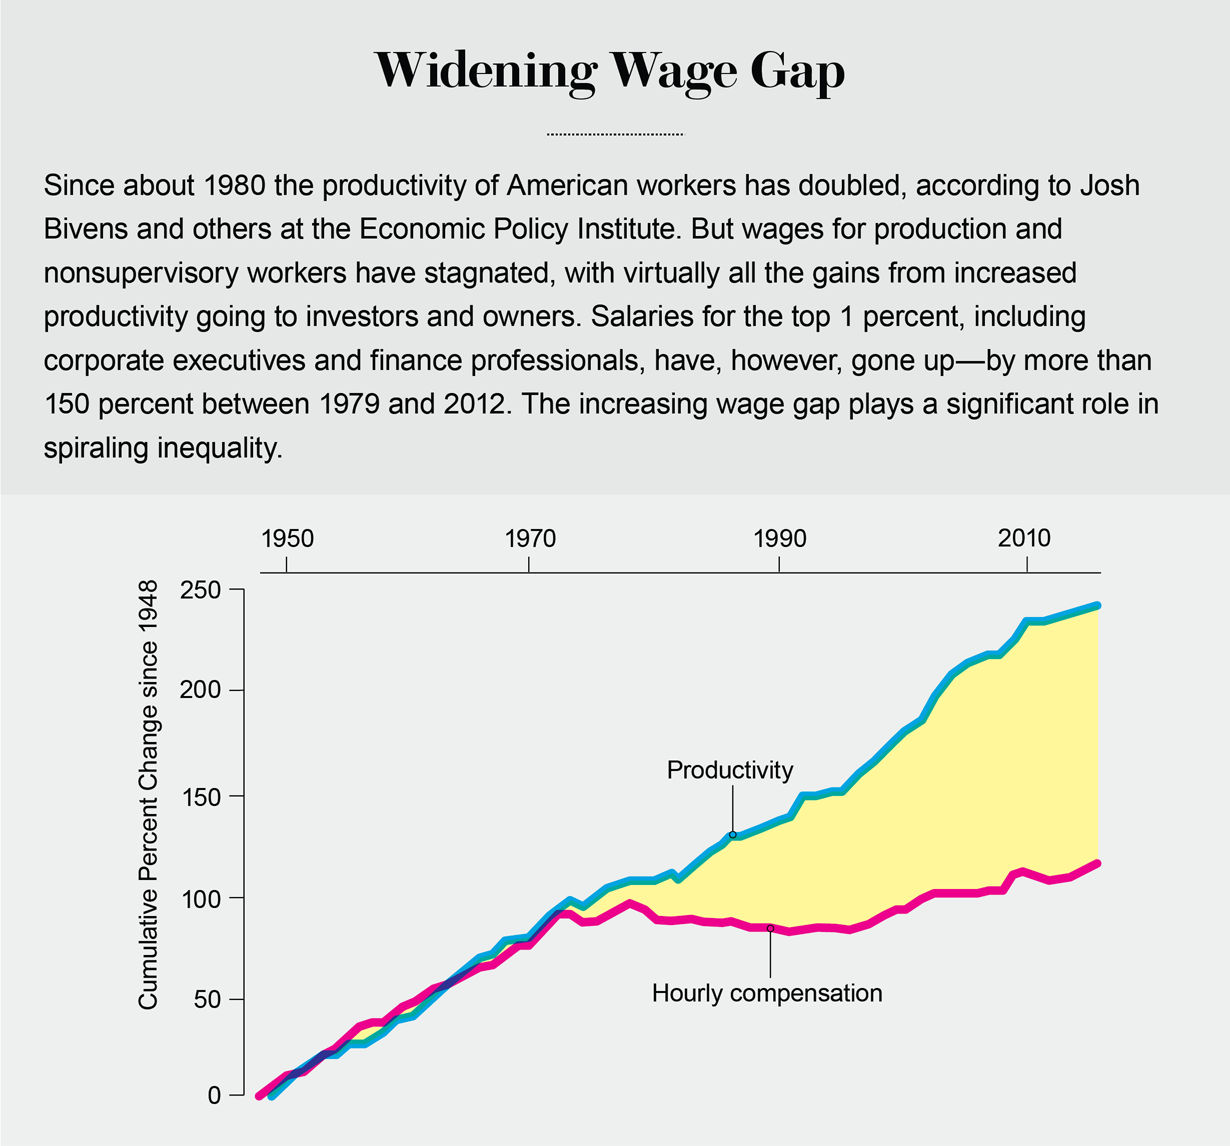
Credit: Jen Christiansen; Sources: Raising America’s Pay: Why It’s Our Central Economic Policy Challenge, by Josh Bivens et al. Economic Policy Institute, June 4, 2014; The State of Working America, by Lawrence Mishel, Josh Bivens, Elise Gould and Heidi Shierholz. 12th Edition. ILR Press, 2012
Beyond that, we need more progressive taxation and high-quality
federally funded public education, including affordable access to
universities for all, no ruinous loans required. We need modern
competition laws to deal with the problems posed by 21st-century market
power and stronger enforcement of the laws we do have. We need labor
laws that protect workers and their rights to unionize. We need
corporate governance laws that curb exorbitant salaries bestowed on
chief executives, and we need stronger financial regulations that will
prevent banks from engaging in the exploitative practices that have
become their hallmark. We need better enforcement of antidiscrimination
laws: it is unconscionable that women and minorities get paid a mere
fraction of what their white male counterparts receive. We also need
more sensible inheritance laws that will reduce the intergenerational
transmission of advantage and disadvantage.
The basic perquisites of a middle-class life, including a secure old
age, are no longer attainable for most Americans. We need to guarantee
access to health care. We need to strengthen and reform retirement
programs, which have put an increasing burden of risk management on
workers (who are expected to manage their portfolios to guard
simultaneously against the risks of inflation and market collapse) and
opened them up to exploitation by our financial sector (which sells them
products designed to maximize bank fees rather than retirement
security). Our mortgage system was our Achilles' heel, and we have not
really fixed it. With such a large fraction of Americans living in
cities, we have to have urban housing policies that ensure affordable
housing for all.
It is a long agenda—but a doable one. When skeptics say it is nice but not affordable, I reply: We cannot afford to not
do these things. We are already paying a high price for inequality, but
it is just a down payment on what we will have to pay if we do not do
something—and quickly. It is not just our economy that is at stake; we
are risking our democracy.
As more of our citizens come to understand why the fruits of economic
progress have been so unequally shared, there is a real danger that
they will become open to a demagogue blaming the country's problems on
others and making false promises of rectifying “a rigged system.” We are
already experiencing a foretaste of what might happen. It could get
much worse.
This article was originally published with the title "A Rigged Economy"
MORE TO EXPLORE
The Price of Inequality: How Today's Divided Society Endangers Our Future. Joseph E. Stiglitz. W. W. Norton, 2012.
The Great Divide: Unequal Societies and What We Can Do about Them. Joseph E. Stiglitz. W. W. Norton, 2015.
Rewriting the Rules of the American Economy: An Agenda for Growth and Shared Prosperity. Joseph E. Stiglitz. W. W. Norton, 2015.
Globalization and Its Discontents Revisited: Anti-globalization in the Era of Trump. Joseph E. Stiglitz. W. W. Norton, 2017.
ABOUT THE AUTHOR(S)
Joseph E. Stiglitz
Joseph
E. Stiglitz is a University Professor at Columbia University and Chief
Economist at the Roosevelt Institute. He received the Nobel prize in
economics in 2001. Stiglitz chaired the Council of Economic Advisers
from 1995–1997, during the Clinton administration, and served as the
chief economist and senior vice president of the World Bank from
1997–2000. He chaired the United Nations commission on reforms of the
international financial system in 2008–2009. His latest authored book is
Globalization and Its Discontents Revisited (2017).
Data analysis is a process of inspecting, cleansing, transforming, and modelingdata
with the goal of discovering useful information, informing conclusions,
and supporting decision-making. Data analysis has multiple facets and
approaches, encompassing diverse techniques under a variety of names,
while being used in different business, science, and social science
domains.
Data mining
is a particular data analysis technique that focuses on modeling and
knowledge discovery for predictive rather than purely descriptive
purposes, while business intelligence covers data analysis that relies heavily on aggregation, focusing mainly on business information. In statistical applications, data analysis can be divided into descriptive statistics, exploratory data analysis (EDA), and confirmatory data analysis (CDA). EDA focuses on discovering new features in the data while CDA focuses on confirming or falsifying existing hypotheses. Predictive analytics focuses on application of statistical models for predictive forecasting or classification, while text analytics
applies statistical, linguistic, and structural techniques to extract
and classify information from textual sources, a species of unstructured data. All of the above are varieties of data analysis.
Data integration is a precursor to data analysis, and data analysis is closely linked to data visualization and data dissemination. The term data analysis is sometimes used as a synonym for data modeling.
The process of data analysis
Data science process flowchart from "Doing Data Science", Cathy O'Neil and Rachel Schutt, 2013
Analysis refers to breaking a whole into its separate components for individual examination. Data analysis is a process
for obtaining raw data and converting it into information useful for
decision-making by users. Data is collected and analyzed to answer
questions, test hypotheses or disprove theories.
Statistician John Tukey
defined data analysis in 1961 as: "Procedures for analyzing data,
techniques for interpreting the results of such procedures, ways of
planning the gathering of data to make its analysis easier, more precise
or more accurate, and all the machinery and results of (mathematical)
statistics which apply to analyzing data."
There are several phases that can be distinguished, described
below. The phases are iterative, in that feedback from later phases may
result in additional work in earlier phases.
Data requirements
The
data is necessary as inputs to the analysis, which is specified based
upon the requirements of those directing the analysis or customers (who
will use the finished product of the analysis). The general type of
entity upon which the data will be collected is referred to as an
experimental unit (e.g., a person or population of people). Specific
variables regarding a population (e.g., age and income) may be specified
and obtained. Data may be numerical or categorical (i.e., a text label
for numbers).
Data collection
Data
is collected from a variety of sources. The requirements may be
communicated by analysts to custodians of the data, such as information
technology personnel within an organization. The data may also be
collected from sensors in the environment, such as traffic cameras,
satellites, recording devices, etc. It may also be obtained through
interviews, downloads from online sources, or reading documentation.
Data processing
The phases of the intelligence cycle
used to convert raw information into actionable intelligence or
knowledge are conceptually similar to the phases in data analysis.
Data initially obtained must be processed or organised for analysis.
For instance, these may involve placing data into rows and columns in a
table format (i.e., structured data) for further analysis, such as within a spreadsheet or statistical software.
Data cleaning
Once
processed and organised, the data may be incomplete, contain
duplicates, or contain errors. The need for data cleaning will arise
from problems in the way that data is entered and stored. Data cleaning
is the process of preventing and correcting these errors. Common tasks
include record matching, identifying inaccuracy of data, overall quality
of existing data, deduplication, and column segmentation.
Such data problems can also be identified through a variety of
analytical techniques. For example, with financial information, the
totals for particular variables may be compared against separately
published numbers believed to be reliable.
Unusual amounts above or below pre-determined thresholds may also be
reviewed. There are several types of data cleaning that depend on the
type of data such as phone numbers, email addresses, employers etc.
Quantitative data methods for outlier detection can be used to get rid
of likely incorrectly entered data. Textual data spell checkers can be
used to lessen the amount of mistyped words, but it is harder to tell if
the words themselves are correct.
Exploratory data analysis
Once the data is cleaned, it can be analyzed. Analysts may apply a variety of techniques referred to as exploratory data analysis to begin understanding the messages contained in the data.
The process of exploration may result in additional data cleaning or
additional requests for data, so these activities may be iterative in
nature. Descriptive statistics, such as the average or median, may be generated to help understand the data. Data visualization may also be used to examine the data in graphical format, to obtain additional insight regarding the messages within the data.
Modeling and algorithms
Mathematical formulas or models called algorithms may be applied to the data to identify relationships among the variables, such as correlation or causation.
In general terms, models may be developed to evaluate a particular
variable in the data based on other variable(s) in the data, with some
residual error depending on model accuracy (i.e., Data = Model + Error).
Inferential statistics includes techniques to measure relationships between particular variables. For example, regression analysis
may be used to model whether a change in advertising (independent
variable X) explains the variation in sales (dependent variable Y). In
mathematical terms, Y (sales) is a function of X (advertising). It may
be described as Y = aX + b + error, where the model is designed such
that a and b minimize the error when the model predicts Y for a given
range of values of X. Analysts may attempt to build models that are
descriptive of the data to simplify analysis and communicate results.
Data product
A
data product is a computer application that takes data inputs and
generates outputs, feeding them back into the environment. It may be
based on a model or algorithm. An example is an application that
analyzes data about customer purchasing history and recommends other
purchases the customer might enjoy.
Once the data is analyzed, it may be reported in many formats to the
users of the analysis to support their requirements. The users may have
feedback, which results in additional analysis. As such, much of the
analytical cycle is iterative.
When determining how to communicate the results, the analyst may consider data visualization techniques to help clearly and efficiently communicate the message to the audience. Data visualization uses information displays
(such as tables and charts) to help communicate key messages contained
in the data. Tables are helpful to a user who might lookup specific
numbers, while charts (e.g., bar charts or line charts) may help explain
the quantitative messages contained in the data.
Quantitative messages
A time series illustrated with a line chart demonstrating trends in U.S. federal spending and revenue over time.
A scatterplot illustrating correlation between two variables (inflation and unemployment) measured at points in time.
Stephen Few described eight types of quantitative messages that users
may attempt to understand or communicate from a set of data and the
associated graphs used to help communicate the message. Customers
specifying requirements and analysts performing the data analysis may
consider these messages during the course of the process.
Time-series: A single variable is captured over a period of time, such as the unemployment rate over a 10-year period. A line chart may be used to demonstrate the trend;
Ranking: Categorical subdivisions are ranked in ascending or descending order, such as a ranking of sales performance (the measure) by sales persons (the category, with each sales person a categorical subdivision) during a single period. A bar chart may be used to show the comparison across the sales persons;
Part-to-whole: Categorical subdivisions are measured as a ratio to the whole (i.e., a percentage out of 100%). A pie chart or bar chart can show the comparison of ratios, such as the market share represented by competitors in a market;
Deviation: Categorical subdivisions are compared against a
reference, such as a comparison of actual vs. budget expenses for
several departments of a business for a given time period. A bar chart
can show comparison of the actual versus the reference amount;
Frequency distribution: Shows the number of observations of a
particular variable for given interval, such as the number of years in
which the stock market return is between intervals such as 0–10%,
11–20%, etc. A histogram, a type of bar chart, may be used for this analysis;
Correlation: Comparison between observations represented by two
variables (X,Y) to determine if they tend to move in the same or
opposite directions. For example, plotting unemployment (X) and
inflation (Y) for a sample of months. A scatter plot is typically used for this message;
Nominal comparison: Comparing categorical subdivisions in no
particular order, such as the sales volume by product code. A bar chart
may be used for this comparison;
Geographic or geospatial: Comparison of a variable across a map or
layout, such as the unemployment rate by state or the number of persons
on the various floors of a building. A cartogram is a typical graphic used.
Techniques for analyzing quantitative data
Author Jonathan Koomey has recommended a series of best practices for understanding quantitative data. These include:
Check raw data for anomalies prior to performing your analysis;
Re-perform important calculations, such as verifying columns of data that are formula driven;
Confirm main totals are the sum of subtotals;
Check relationships between numbers that should be related in a predictable way, such as ratios over time;
Normalize numbers to make comparisons easier, such as analyzing
amounts per person or relative to GDP or as an index value relative to a
base year;
Break problems into component parts by analyzing factors that led to the results, such as DuPont analysis of return on equity.
For the variables under examination, analysts typically obtain descriptive statistics for them, such as the mean (average), median, and standard deviation. They may also analyze the distribution of the key variables to see how the individual values cluster around the mean.
An illustration of the MECE principle used for data analysis.
The consultants at McKinsey and Company named a technique for breaking a quantitative problem down into its component parts called the MECE principle. Each layer can be broken down into its components; each of the sub-components must be mutually exclusive of each other and collectively
add up to the layer above them. The relationship is referred to as
"Mutually Exclusive and Collectively Exhaustive" or MECE. For example,
profit by definition can be broken down into total revenue and total
cost. In turn, total revenue can be analyzed by its components, such as
revenue of divisions A, B, and C (which are mutually exclusive of each
other) and should add to the total revenue (collectively exhaustive).
Analysts may use robust statistical measurements to solve certain analytical problems. Hypothesis testing
is used when a particular hypothesis about the true state of affairs is
made by the analyst and data is gathered to determine whether that
state of affairs is true or false. For example, the hypothesis might be
that "Unemployment has no effect on inflation", which relates to an
economics concept called the Phillips Curve. Hypothesis testing involves considering the likelihood of Type I and type II errors, which relate to whether the data supports accepting or rejecting the hypothesis.
Regression analysis
may be used when the analyst is trying to determine the extent to which
independent variable X affects dependent variable Y (e.g., "To what
extent do changes in the unemployment rate (X) affect the inflation rate
(Y)?"). This is an attempt to model or fit an equation line or curve to
the data, such that Y is a function of X.
Necessary condition analysis
(NCA) may be used when the analyst is trying to determine the extent to
which independent variable X allows variable Y (e.g., "To what extent
is a certain unemployment rate (X) necessary for a certain inflation
rate (Y)?"). Whereas (multiple) regression analysis uses additive logic
where each X-variable can produce the outcome and the X's can compensate
for each other (they are sufficient but not necessary), necessary
condition analysis (NCA) uses necessity logic, where one or more
X-variables allow the outcome to exist, but may not produce it (they are
necessary but not sufficient). Each single necessary condition must be
present and compensation is not possible.
Analytical activities of data users
Users
may have particular data points of interest within a data set, as
opposed to general messaging outlined above. Such low-level user
analytic activities are presented in the following table. The taxonomy
can also be organized by three poles of activities: retrieving values,
finding data points, and arranging data points.
#
Task
General Description
Pro Forma Abstract
Examples
1
Retrieve Value
Given a set of specific cases, find attributes of those cases.
What are the values of attributes {X, Y, Z, ...} in the data cases {A, B, C, ...}?
-What is the mileage per gallon of the Ford Mondeo?- How long is the movie Gone with the Wind?
2
Filter
Given some concrete conditions on attribute values, find data cases satisfying those conditions.
Which data cases satisfy conditions {A, B, C...}?
- What Kellogg's cereals have high fiber?- What comedies have won awards? - Which funds underperformed the SP-500?
3
Compute Derived Value
Given a set of data cases, compute an aggregate numeric representation of those data cases.
What is the value of aggregation function F over a given set S of data cases?
- What is the average calorie content of Post cereals?- What is the gross income of all stores combined? - How many manufacturers of cars are there?
4
Find Extremum
Find data cases possessing an extreme value of an attribute over its range within the data set.
What are the top/bottom N data cases with respect to attribute A?
- What is the car with the highest MPG?- What director/film has won the most awards? - What Marvel Studios film has the most recent release date?
5
Sort
Given a set of data cases, rank them according to some ordinal metric.
What is the sorted order of a set S of data cases according to their value of attribute A?
- Order the cars by weight.- Rank the cereals by calories.
6
Determine Range
Given a set of data cases and an attribute of interest, find the span of values within the set.
What is the range of values of attribute A in a set S of data cases?
- What is the range of film lengths?- What is the range of car horsepowers? - What actresses are in the data set?
7
Characterize Distribution
Given a set of data cases and a quantitative attribute of interest,
characterize the distribution of that attribute’s values over the set.
What is the distribution of values of attribute A in a set S of data cases?
- What is the distribution of carbohydrates in cereals?- What is the age distribution of shoppers?
8
Find Anomalies
Identify any anomalies within a given set of data cases with respect
to a given relationship or expectation, e.g. statistical outliers.
Which data cases in a set S of data cases have unexpected/exceptional values?
- Are there exceptions to the relationship between horsepower and acceleration?- Are there any outliers in protein?
9
Cluster
Given a set of data cases, find clusters of similar attribute values.
Which data cases in a set S of data cases are similar in value for attributes {X, Y, Z, ...}?
- Are there groups of cereals w/ similar fat/calories/sugar?- Is there a cluster of typical film lengths?
10
Correlate
Given a set of data cases and two attributes, determine useful relationships between the values of those attributes.
What is the correlation between attributes X and Y over a given set S of data cases?
- Is there a correlation between carbohydrates and fat?- Is there a correlation between country of origin and MPG? - Do different genders have a preferred payment method? - Is there a trend of increasing film length over the years?
Given a set of data cases, find contextual relevancy of the data to the users.
Which data cases in a set S of data cases are relevant to the current users' context?
- Are there groups of restaurants that have foods based on my current caloric intake?
Barriers to effective analysis
Barriers
to effective analysis may exist among the analysts performing the data
analysis or among the audience. Distinguishing fact from opinion,
cognitive biases, and innumeracy are all challenges to sound data
analysis.
Confusing fact and opinion
You are entitled to your own opinion, but you are not entitled to your own facts.
Effective analysis requires obtaining relevant facts to answer questions, support a conclusion or formal opinion, or test hypotheses.
Facts by definition are irrefutable, meaning that any person involved
in the analysis should be able to agree upon them. For example, in
August 2010, the Congressional Budget Office (CBO) estimated that extending the Bush tax cuts of 2001 and 2003 for the 2011–2020 time period would add approximately $3.3 trillion to the national debt.
Everyone should be able to agree that indeed this is what CBO reported;
they can all examine the report. This makes it a fact. Whether persons
agree or disagree with the CBO is their own opinion.
As another example, the auditor of a public company must arrive
at a formal opinion on whether financial statements of publicly traded
corporations are "fairly stated, in all material respects." This
requires extensive analysis of factual data and evidence to support
their opinion. When making the leap from facts to opinions, there is
always the possibility that the opinion is erroneous.
Cognitive biases
There are a variety of cognitive biases that can adversely affect analysis. For example, confirmation bias
is the tendency to search for or interpret information in a way that
confirms one's preconceptions. In addition, individuals may discredit
information that does not support their views.
Analysts may be trained specifically to be aware of these biases and how to overcome them. In his book Psychology of Intelligence Analysis, retired CIA analyst Richards Heuer
wrote that analysts should clearly delineate their assumptions and
chains of inference and specify the degree and source of the uncertainty
involved in the conclusions. He emphasized procedures to help surface
and debate alternative points of view.
Innumeracy
Effective
analysts are generally adept with a variety of numerical techniques.
However, audiences may not have such literacy with numbers or numeracy;
they are said to be innumerate. Persons communicating the data may
also be attempting to mislead or misinform, deliberately using bad
numerical techniques.
For example, whether a number is rising or falling may not be the
key factor. More important may be the number relative to another
number, such as the size of government revenue or spending relative to
the size of the economy (GDP) or the amount of cost relative to revenue
in corporate financial statements. This numerical technique is referred
to as normalization
or common-sizing. There are many such techniques employed by analysts,
whether adjusting for inflation (i.e., comparing real vs. nominal data)
or considering population increases, demographics, etc. Analysts apply a
variety of techniques to address the various quantitative messages
described in the section above.
Analysts may also analyze data under different assumptions or scenarios. For example, when analysts perform financial statement analysis,
they will often recast the financial statements under different
assumptions to help arrive at an estimate of future cash flow, which
they then discount to present value based on some interest rate, to
determine the valuation of the company or its stock. Similarly, the CBO
analyzes the effects of various policy options on the government's
revenue, outlays and deficits, creating alternative future scenarios for
key measures.
Other topics
Smart buildings
A data analytics approach can be used in order to predict energy consumption in buildings.
The different steps of the data analysis process are carried out in
order to realise smart buildings, where the building management and
control operations including heating, ventilation, air conditioning,
lighting and security are realised automatically by miming the needs of
the building users and optimising resources like energy and time.
Analytics and business intelligence
Analytics is the "extensive use of data, statistical and quantitative
analysis, explanatory and predictive models, and fact-based management
to drive decisions and actions." It is a subset of business intelligence, which is a set of technologies and processes that use data to understand and analyze business performance.
Education
Analytic activities of data visualization users
In education, most educators have access to a data system for the purpose of analyzing student data. These data systems present data to educators in an over-the-counter data
format (embedding labels, supplemental documentation, and a help system
and making key package/display and content decisions) to improve the
accuracy of educators’ data analyses.
Practitioner notes
Initial data analysis
The
most important distinction between the initial data analysis phase and
the main analysis phase, is that during initial data analysis one
refrains from any analysis that is aimed at answering the original
research question. The initial data analysis phase is guided by the
following four questions:
Quality of data
The
quality of the data should be checked as early as possible. Data
quality can be assessed in several ways, using different types of
analysis: frequency counts, descriptive statistics (mean, standard
deviation, median), normality (skewness, kurtosis, frequency histograms,
n: variables are compared with coding schemes of variables external to
the data set, and possibly corrected if coding schemes are not
comparable.
The choice of analyses to assess the data quality during the initial
data analysis phase depends on the analyses that will be conducted in
the main analysis phase.
Quality of measurements
The quality of the measurement instruments
should only be checked during the initial data analysis phase when this
is not the focus or research question of the study. One should check
whether structure of measurement instruments corresponds to structure
reported in the literature.
There are two ways to assess measurement: [NOTE: only one way seems to be listed]
Analysis of homogeneity (internal consistency), which gives an indication of the reliability of a measurement instrument. During this analysis, one inspects the variances of the items and the scales, the Cronbach's α of the scales, and the change in the Cronbach's alpha when an item would be deleted from a scale.
Initial transformations
After
assessing the quality of the data and of the measurements, one might
decide to impute missing data, or to perform initial transformations of
one or more variables, although this can also be done during the main
analysis phase.
Possible transformations of variables are:
Square root transformation (if the distribution differs moderately from normal);
Log-transformation (if the distribution differs substantially from normal);
Inverse transformation (if the distribution differs severely from normal);
Make categorical (ordinal / dichotomous) (if the distribution differs severely from normal, and no transformations help).
Did the implementation of the study fulfill the intentions of the research design?
One should check the success of the randomization
procedure, for instance by checking whether background and substantive
variables are equally distributed within and across groups.
If the study did not need or use a randomization procedure, one should
check the success of the non-random sampling, for instance by checking
whether all subgroups of the population of interest are represented in
sample.
Other possible data distortions that should be checked are:
dropout (this should be identified durin. the initial data analysis phase);
Item nonresponse (whether this is random or not should be assessed during the initial data analysis phase);
In
any report or article, the structure of the sample must be accurately
described. It is especially important to exactly determine the structure
of the sample (and specifically the size of the subgroups) when
subgroup analyses will be performed during the main analysis phase.
The characteristics of the data sample can be assessed by looking at:
Basic statistics of important variables;
Scatter plots;
Correlations and associations;
Cross-tabulations;
Final stage of the initial data analysis
During
the final stage, the findings of the initial data analysis are
documented, and necessary, preferable, and possible corrective actions
are taken.
Also, the original plan for the main data analyses can and should be specified in more detail or rewritten.
In order to do this, several decisions about the main data analyses can and should be made:
In the case of non-normals: should one transform variables; make variables categorical (ordinal/dichotomous); adapt the analysis method?
In the case of missing data: should one neglect or impute the missing data; which imputation technique should be used?
In the case of outliers: should one use robust analysis techniques?
In case items do not fit the scale: should one adapt the measurement
instrument by omitting items, or rather ensure comparability with other
(uses of the) measurement instrument(s)?
In the case of (too) small subgroups: should one drop the hypothesis
about inter-group differences, or use small sample techniques, like
exact tests or bootstrapping?
In case the randomization procedure seems to be defective: can and should one calculate propensity scores and include them as covariates in the main analyses?
Analysis
Several analyses can be used during the initial data analysis phase:
Univariate statistics (single variable);
Bivariate associations (correlations);
Graphical techniques (scatter plots).
It is important to take the measurement levels of the variables into
account for the analyses, as special statistical techniques are
available for each level:
Nominal and ordinal variables
Frequency counts (numbers and percentages);
Associations
circumambulations (crosstabulations);
hierarchical loglinear analysis (restricted to a maximum of 8 variables);
loglinear analysis (to identify relevant/important variables and possible confounders);
Exact tests or bootstrapping (in case subgroups are small);
In
the main analysis phase analyses aimed at answering the research
question are performed as well as any other relevant analysis needed to
write the first draft of the research report.
Exploratory and confirmatory approaches
In
the main analysis phase either an exploratory or confirmatory approach
can be adopted. Usually the approach is decided before data is
collected. In an exploratory analysis no clear hypothesis is stated
before analysing the data, and the data is searched for models that
describe the data well. In a confirmatory analysis clear hypotheses
about the data are tested.
Exploratory data analysis
should be interpreted carefully. When testing multiple models at once
there is a high chance on finding at least one of them to be
significant, but this can be due to a type 1 error. It is important to always adjust the significance level when testing multiple models with, for example, a Bonferroni correction.
Also, one should not follow up an exploratory analysis with a
confirmatory analysis in the same dataset. An exploratory analysis is
used to find ideas for a theory, but not to test that theory as well.
When a model is found exploratory in a dataset, then following up that
analysis with a confirmatory analysis in the same dataset could simply
mean that the results of the confirmatory analysis are due to the same type 1 error
that resulted in the exploratory model in the first place. The
confirmatory analysis therefore will not be more informative than the
original exploratory analysis.
Stability of results
It is important to obtain some indication about how generalizable the results are.
While this is hard to check, one can look at the stability of the
results. Are the results reliable and reproducible? There are two main
ways of doing this:
Cross-validation:
By splitting the data in multiple parts we can check if an analysis
(like a fitted model) based on one part of the data generalizes to
another part of the data as well;
Sensitivity analysis:
A procedure to study the behavior of a system or model when global
parameters are (systematically) varied. One way to do this is with
bootstrapping.
Statistical methods
Many statistical methods have been used for statistical analyses. A very brief list of four of the more popular methods is:
General linear model: A widely used model on which various methods are based (e.g. t test, ANOVA, ANCOVA, MANOVA). Usable for assessing the effect of several predictors on one or more continuous dependent variables;
Generalized linear model: An extension of the general linear model for discrete dependent variables;
PAST – free software for scientific data analysis;
PAW – FORTRAN/C data analysis framework developed at CERN;
R – a programming language and software environment for statistical computing and graphics;
ROOT – C++ data analysis framework developed at CERN;
SciPy and Pandas – Python libraries for data analysis.
International data analysis contests
Different
companies or organizations hold a data analysis contests to encourage
researchers utilize their data or to solve a particular question using
data analysis. A few examples of well-known international data analysis
contests are as follows.
Quality assurance (QA)
is a way of preventing mistakes and defects in manufactured products
and avoiding problems when delivering solutions or services to
customers; which ISO 9000 defines as "part of quality management focused on providing confidence that quality requirements will be fulfilled". This defect prevention in quality assurance differs subtly from defect detection and rejection in quality control, and has been referred to as a shift left as it focuses on quality earlier in the process i.e. to the left of a linear process diagram reading left to right.
The terms "quality assurance" and "quality control" are often
used interchangeably to refer to ways of ensuring the quality of a
service or product. For instance, the term "assurance" is often used as follows: Implementation
of inspection and structured testing as a measure of quality assurance
in a television set software project at Philips Semiconductors is
described.
The term "control", however, is used to describe the fifth phase of the
Define, Measure, Analyze, Improve, Control (DMAIC) model. DMAIC is a
data-driven quality strategy used to improve processes.
Quality assurance comprises administrative and procedural activities implemented in a quality system so that requirements and goals for a product, service or activity will be fulfilled.
It is the systematic measurement, comparison with a standard,
monitoring of processes and an associated feedback loop that confers
error prevention. This can be contrasted with quality control, which is focused on process output.
Quality assurance includes two principles: "Fit for purpose" (the
product should be suitable for the intended purpose); and "right first
time" (mistakes should be eliminated). QA includes management of the quality of raw materials, assemblies, products and components, services related to production, and management, production and inspection processes.
The two principles also manifest before the background of developing
(engineering) a novel technical product: The task of engineering is to
make it work once, while the task of quality assurance is to make it
work all the time.
Historically, defining what suitable product or service quality
means has been a more difficult process, determined in many ways, from
the subjective user-based approach that contains "the different weights
that individuals normally attach to quality characteristics," to the
value-based approach which finds consumers linking quality to price and
making overall conclusions of quality based on such a relationship.
History
Initial efforts to control the quality of production
During the Middle Ages, guilds
adopted responsibility for the quality of goods and services offered by
their members, setting and maintaining certain standards for guild
membership.
Royal governments purchasing material were interested in quality control as customers. For this reason, King John of England appointed William de Wrotham to report about the construction and repair of ships. Centuries later, Samuel Pepys, Secretary to the British Admiralty, appointed multiple such overseers to standardize sea rations and naval training.
Prior to the extensive division of labor and mechanization resulting from the Industrial Revolution,
it was possible for workers to control the quality of their own
products. The Industrial Revolution led to a system in which large
groups of people performing a specialized type of work were grouped
together under the supervision of a foreman who was appointed to control
the quality of work manufactured.
Wartime production
During the time of the First World War,
manufacturing processes typically became more complex, with larger
numbers of workers being supervised. This period saw the widespread
introduction of mass production and piece work, which created problems as workmen could now earn more money by the production of extra products, which in turn occasionally led to poor quality workmanship being passed on to the assembly lines.
Pioneers such as Frederick Winslow Taylor and Henry Ford recognized the
limitations of the methods being used in mass production at the time
and the subsequent varying quality of output. Taylor, utilizing the
concept of scientific management, helped separate production tasks into
many simple steps (the assembly line) and limited quality control to a
few specific individuals, limiting complexity.
Ford emphasized standardization of design and component standards to
ensure a standard product was produced, while quality was the
responsibility of machine inspectors, "placed in each department to
cover all operations ... at frequent intervals, so that no faulty
operation shall proceed for any great length of time."
Out of this also came statistical process control (SPC), which was pioneered by Walter A. Shewhart
at Bell Laboratories in the early 1920s. Shewhart developed the control
chart in 1924 and the concept of a state of statistical control.
Statistical control is equivalent to the concept of exchangeability developed by logician William Ernest Johnson also in 1924 in his book Logic, Part III: The Logical Foundations of Science. Along with a team at AT&T that included Harold Dodge and Harry Romig, he worked to put sampling
inspection on a rational statistical basis as well. Shewhart consulted
with Colonel Leslie E. Simon in the application of control charts to
munitions manufacture at the Army's Picatinny Arsenal in 1934.
That successful application helped convince Army Ordnance to engage
AT&T's George Edwards to consult on the use of statistical quality
control among its divisions and contractors at the outbreak of World War
II.
Postwar
In the
period following World War II, many countries' manufacturing
capabilities that had been destroyed during the war were rebuilt. General Douglas MacArthur oversaw the re-building of Japan. During this time, General MacArthur involved two key individuals in the development of modern quality concepts: W. Edwards Deming and Joseph Juran.
Both individuals, as well as others, promoted the collaborative
concepts of quality to Japanese business and technical groups, and these
groups utilized these concepts in the redevelopment of the Japanese
economy.
Although there were many individuals trying to lead United States
industries towards a more comprehensive approach to quality, the U.S.
continued to apply the Quality Control (QC) concepts of inspection and
sampling to remove defective product from production lines, essentially
unaware of or ignoring advances in QA for decades.
Approaches
Failure testing
A valuable process to perform on a whole consumer product is failure testing or stress testing. In mechanical terms this is the operation of a product until it fails, often under stresses such as increasing vibration, temperature, and humidity. This exposes many unanticipated weaknesses
in a product, and the data is used to drive engineering and
manufacturing process improvements. Often quite simple changes can
dramatically improve product service, such as changing to mold-resistant paint or adding lock-washer placement to the training for new assembly personnel.
Statistical control
Statistical control is based on analyses of objective and subjective data. Many organizations use statistical process control as a tool in any quality improvement effort
to track quality data. Any product can be statistically charted as long
as they have a common cause variance or special cause variance to
track.
Walter Shewart of Bell Telephone Laboratories recognized that
when a product is made, data can be taken from scrutinized areas of a
sample lot of the part and statistical variances are then analyzed and
charted. Control can then be implemented on the part in the form of
rework or scrap, or control can be implemented on the process that made
the part, ideally eliminating the defect before more parts can be made
like it.
Total quality management
The quality of products is dependent upon that of the participating constituents,
some of which are sustainable and effectively controlled while others
are not. The process(es) which are managed with QA pertain to Total Quality Management.
If the specification does not reflect the true quality
requirements, the product's quality cannot be guaranteed. For instance,
the parameters for a pressure vessel should cover not only the material
and dimensions but operating, environmental, safety, reliability and maintainability requirements.
Models and standards
ISO 17025 is an international standard that specifies the general requirements for the competence to carry out tests and or calibrations.
There are 15 management requirements and 10 technical requirements.
These requirements outline what a laboratory must do to become
accredited. Management system refers to the organization's structure for managing
its processes or activities that transform inputs of resources into a
product or service which meets
the organization's objectives, such as satisfying the customer's quality
requirements, complying with regulations, or meeting environmental
objectives. WHO has developed several tools and offers training courses
for quality assurance in public health laboratories.
The Capability Maturity Model Integration (CMMI)
model is widely used to implement Process and Product Quality Assurance
(PPQA) in an organization. The CMMI maturity levels can be divided into
5 steps, which a company can achieve by performing specific activities
within the organization.
Company quality
During the 1980s, the concept of "company quality" with the focus on management and people came to the fore in the U.S. It was considered that, if all departments approached quality with an open mind, success was possible if management led the quality improvement process.
The company-wide quality approach places an emphasis on four aspects (enshrined in standards such as ISO 9001):
Elements such as controls, job management, adequate processes, performance and integrity criteria and identification of records;
Competence such as knowledge, skills, experiences, qualifications
Infrastructure (as it enhances or limits functionality).
The quality of the outputs is at risk if any of these aspects is deficient.
QA is not limited to manufacturing, and can be applied to any
business or non-business activity, including: design, consulting,
banking, insurance, computer software development, retailing,
investment, transportation, education, and translation.
It comprises a quality improvement process, which is generic in
the sense that it can be applied to any of these activities and it
establishes a behavior pattern, which supports the achievement of quality.
This in turn is supported by quality management practices which can include a number of business systems and which are usually specific to the activities of the business unit concerned.
In manufacturing and construction
activities, these business practices can be equated to the models for
quality assurance defined by the International Standards contained in
the ISO 9000 series and the specified Specifications for quality systems.
In the system of Company Quality, the work being carried out was
shop floor inspection which did not reveal the major quality problems.
This led to quality assurance or total quality control, which has come
into being recently.
In practice
Medical industry
QA
is very important in the medical field because it helps to identify the
standards of medical equipments and services. Hospitals and
laboratories make use of external agencies in order to ensure standards
for equipment such as X-ray machines, Diagnostic Radiology and AERB. QA
is particularly applicable throughout the development and introduction
of new medicines and medical devices. The Research Quality Association
(RQA) supports and promotes the quality of research in life sciences,
through its members and regulatory bodies.
Aerospace industry
The
term product assurance (PA) is often used instead of quality assurance
and is, alongside project management and engineering, one of the three
primary project functions. Quality assurance is seen as one part of
product assurance. Due to the sometimes catastrophic consequences a
single failure can have for human lives, the environment, a device, or a
mission, product assurance plays a particularly important role here. It
has organizational, budgetary and product developmental independence
meaning that it reports to highest management only, has its own budget,
and does not expend labor to help build a product. Product assurance
stands on an equal footing with project management but embraces the
customer's point of view.
Software development
Software Quality Assurance consists of a means of monitoring the software engineering
processes and methods used to ensure quality. The methods by which this
is accomplished are many and varied, and may include ensuring
conformance to one or more standards, such as ISO 9000 or a model such as CMMI. In addition, enterprise quality management software is used to correct issues such as: supply chain disaggregation and regulatory compliance which are vital among medical device manufacturers.