A fossil (from Classical Latin fossilis; literally, "obtained by digging") is any preserved remains, impression, or trace of any once-living thing from a past geological age. Examples include bones, shells, exoskeletons, stone imprints of animals or microbes, objects preserved in amber, hair, petrified wood, oil, coal, and DNA remnants. The totality of fossils is known as the fossil record.
Paleontology is the study of fossils: their age, method of formation, and evolutionary significance. Specimens are usually considered to be fossils if they are over 10,000 years old. The oldest fossils are from around 3.48 billion years old to 4.1 billion years old. The observation in the 19th century that certain fossils were associated with certain rock strata led to the recognition of a geological timescale and the relative ages of different fossils. The development of radiometric dating techniques in the early 20th century allowed scientists to quantitatively measure the absolute ages of rocks and the fossils they host.
There are many processes that lead to fossilization, including permineralization, casts and molds, authigenic mineralization, replacement and recrystallization, adpression, carbonization, and bioimmuration.

Fossil of a Seymouria (extinct)
Fossils vary in size from one micrometer bacteria to dinosaurs and trees, many meters long and weighing many tons. A fossil normally preserves only a portion of the deceased organism, usually that portion that was partially mineralized during life, such as the bones and teeth of vertebrates, or the chitinous or calcareous exoskeletons of invertebrates. Fossils may also consist of the marks left behind by the organism while it was alive, such as animal tracks or feces (coprolites). These types of fossil are called trace fossils or ichnofossils, as opposed to body fossils. Some fossils are biochemical and are called chemofossils or biosignatures.
Fossilization processes
The process of fossilization varies according to tissue type and external conditions.Permineralization

Silicified (replaced with silica) fossils from the Road Canyon Formation (Middle Permian of Texas)
Permineralization is a process of fossilization that occurs when an organism is buried. The empty spaces within an organism (spaces filled with liquid or gas during life) become filled with mineral-rich groundwater. Minerals precipitate from the groundwater, occupying the empty spaces. This process can occur in very small spaces, such as within the cell wall of a plant cell. Small scale permineralization can produce very detailed fossils. For permineralization to occur, the organism must become covered by sediment soon after death or soon after the initial decay process. The degree to which the remains are decayed when covered determines the later details of the fossil. Some fossils consist only of skeletal remains or teeth; other fossils contain traces of skin, feathers or even soft tissues. This is a form of diagenesis.
Casts and molds

In some cases the original remains of the organism completely dissolve or are otherwise destroyed. The remaining organism-shaped hole in the rock is called an external mold. If this hole is later filled with other minerals, it is a cast. An endocast or internal mold is formed when sediments or minerals fill the internal cavity of an organism, such as the inside of a bivalve or snail or the hollow of a skull.
Authigenic mineralization
This is a special form of cast and mold formation. If the chemistry is right, the organism (or fragment of organism) can act as a nucleus for the precipitation of minerals such as siderite, resulting in a nodule forming around it. If this happens rapidly before significant decay to the organic tissue, very fine three-dimensional morphological detail can be preserved. Nodules from the Carboniferous Mazon Creek fossil beds of Illinois, USA, are among the best documented examples of such mineralization.Replacement and recrystallization

Recrystallized scleractinian coral (aragonite to calcite) from the Jurassic of southern Israel
Replacement occurs when the shell, bone or other tissue is replaced with another mineral. In some cases mineral replacement of the original shell occurs so gradually and at such fine scales that microstructural features are preserved despite the total loss of original material. A shell is said to be recrystallized when the original skeletal compounds are still present but in a different crystal form, as from aragonite to calcite.
Adpression (compression-impression)
Compression fossils, such as those of fossil ferns, are the result of chemical reduction of the complex organic molecules composing the organism's tissues. In this case the fossil consists of original material, albeit in a geochemically altered state. This chemical change is an expression of diagenesis. Often what remains is a carbonaceous film known as a phytoleim, in which case the fossil is known as a compression. Often, however, the phytoleim is lost and all that remains is an impression of the organism in the rock—an impression fossil. In many cases, however, compressions and impressions occur together. For instance, when the rock is broken open, the phytoleim will often be attached to one part (compression), whereas the counterpart will just be an impression. For this reason, one term covers the two modes of preservation: adpression.Soft tissue, cell and molecular preservation
Because of their antiquity, an unexpected exception to the alteration of an organism's tissues by chemical reduction of the complex organic molecules during fossilization has been the discovery of soft tissue in dinosaur fossils, including blood vessels, and the isolation of proteins and evidence for DNA fragments. In 2014, Mary Schweitzer and her colleagues reported the presence of iron particles (goethite-aFeO(OH)) associated with soft tissues recovered from dinosaur fossils. Based on various experiments that studied the interaction of iron in haemoglobin with blood vessel tissue they proposed that solution hypoxia coupled with iron chelation enhances the stability and preservation of soft tissue and provides the basis for an explanation for the unforeseen preservation of fossil soft tissues. However, a slightly older study based on eight taxa ranging in time from the Devonian to the Jurassic found that reasonably well-preserved fibrils that probably represent collagen were preserved in all these fossils, and that the quality of preservation depended mostly on the arrangement of the collagen fibers, with tight packing favoring good preservation. There seemed to be no correlation between geological age and quality of preservation, within that timeframe.Carbonization
Carbonaceous films are thin coatings which consist predominantly of the chemical element carbon. The soft tissues of organisms are made largely of organic carbon compounds and during diagenesis under reducing conditions only a thin film of carbon residue is left which forms a silhouette of the original organism.Bioimmuration

The star-shaped holes (Catellocaula vallata) in this Upper Ordovician bryozoan represent a soft-bodied organism preserved by bioimmuration in the bryozoan skeleton.
Dating
Estimating dates
Paleontology seeks to map out how life evolved across geologic time. A substantial hurdle is the difficulty of working out fossil ages. Beds that preserve fossils typically lack the radioactive elements needed for radiometric dating. This technique is our only means of giving rocks greater than about 50 million years old an absolute age, and can be accurate to within 0.5% or better. Although radiometric dating requires careful laboratory work, its basic principle is simple: the rates at which various radioactive elements decay are known, and so the ratio of the radioactive element to its decay products shows how long ago the radioactive element was incorporated into the rock. Radioactive elements are common only in rocks with a volcanic origin, and so the only fossil-bearing rocks that can be dated radiometrically are volcanic ash layers, which may provide termini for the intervening sediments.Stratigraphy
Consequently, palaeontologists rely on stratigraphy to date fossils. Stratigraphy is the science of deciphering the "layer-cake" that is the sedimentary record. Rocks normally form relatively horizontal layers, with each layer younger than the one underneath it. If a fossil is found between two layers whose ages are known, the fossil's age is claimed to lie between the two known ages. Because rock sequences are not continuous, but may be broken up by faults or periods of erosion, it is very difficult to match up rock beds that are not directly adjacent. However, fossils of species that survived for a relatively short time can be used to match isolated rocks: this technique is called biostratigraphy. For instance, the conodont Eoplacognathus pseudoplanus has a short range in the Middle Ordovician period. If rocks of unknown age have traces of E. pseudoplanus, they have a mid-Ordovician age. Such index fossils must be distinctive, be globally distributed and occupy a short time range to be useful. Misleading results are produced if the index fossils are incorrectly dated. Stratigraphy and biostratigraphy can in general provide only relative dating (A was before B), which is often sufficient for studying evolution. However, this is difficult for some time periods, because of the problems involved in matching rocks of the same age across continents. Family-tree relationships also help to narrow down the date when lineages first appeared. For instance, if fossils of B or C date to X million years ago and the calculated "family tree" says A was an ancestor of B and C, then A must have evolved earlier.It is also possible to estimate how long ago two living clades diverged, in other words approximately how long ago their last common ancestor must have lived, by assuming that DNA mutations accumulate at a constant rate. These "molecular clocks", however, are fallible, and provide only approximate timing: for example, they are not sufficiently precise and reliable for estimating when the groups that feature in the Cambrian explosion first evolved, and estimates produced by different techniques may vary by a factor of two.
Limitations

Some of the most remarkable gaps in the fossil record (as of October 2013) show slanting toward organisms with hard parts.
Organisms are only rarely preserved as fossils in the best of circumstances, and only a fraction of such fossils have been discovered. This is illustrated by the fact that the number of species known through the fossil record is less than 5% of the number of known living species, suggesting that the number of species known through fossils must be far less than 1% of all the species that have ever lived. Because of the specialized and rare circumstances required for a biological structure to fossilize, only a small percentage of life-forms can be expected to be represented in discoveries, and each discovery represents only a snapshot of the process of evolution. The transition itself can only be illustrated and corroborated by transitional fossils, which will never demonstrate an exact half-way point.
The fossil record is strongly biased toward organisms with hard-parts, leaving most groups of soft-bodied organisms with little to no role. It is replete with the mollusks, the vertebrates, the echinoderms, the brachiopods and some groups of arthropods.
Sites
Lagerstätten
Fossil sites with exceptional preservation—sometimes including preserved soft tissues—are known as Lagerstätten - German for "storage places". These formations may have resulted from carcass burial in an anoxic environment with minimal bacteria, thus slowing decomposition. Lagerstätten span geological time from the Cambrian period to the present. Worldwide, some of the best examples of near-perfect fossilization are the Cambrian Maotianshan shales and Burgess Shale, the Devonian Hunsrück Slates, the Jurassic Solnhofen limestone, and the Carboniferous Mazon Creek localities.Stromatolites

Lower Proterozoic stromatolites from Bolivia, South America
Stromatolites are layered accretionary structures formed in shallow water by the trapping, binding and cementation of sedimentary grains by biofilms of microorganisms, especially cyanobacteria. Stromatolites provide some of the most ancient fossil records of life on Earth, dating back more than 3.5 billion years ago.
Stromatolites were much more abundant in Precambrian times. While older, Archean fossil remains are presumed to be colonies of cyanobacteria, younger (that is, Proterozoic) fossils may be primordial forms of the eukaryote chlorophytes (that is, green algae). One genus of stromatolite very common in the geologic record is Collenia. The earliest stromatolite of confirmed microbial origin dates to 2.724 billion years ago.
A 2009 discovery provides strong evidence of microbial stromatolites extending as far back as 3.45 billion years ago.
Stromatolites are a major constituent of the fossil record for life's first 3.5 billion years, peaking about 1.25 billion years ago. They subsequently declined in abundance and diversity, which by the start of the Cambrian had fallen to 20% of their peak. The most widely supported explanation is that stromatolite builders fell victims to grazing creatures (the Cambrian substrate revolution), implying that sufficiently complex organisms were common over 1 billion years ago.
The connection between grazer and stromatolite abundance is well documented in the younger Ordovician evolutionary radiation; stromatolite abundance also increased after the end-Ordovician and end-Permian extinctions decimated marine animals, falling back to earlier levels as marine animals recovered. Fluctuations in metazoan population and diversity may not have been the only factor in the reduction in stromatolite abundance. Factors such as the chemistry of the environment may have been responsible for changes.
While prokaryotic cyanobacteria themselves reproduce asexually through cell division, they were instrumental in priming the environment for the evolutionary development of more complex eukaryotic organisms. Cyanobacteria (as well as extremophile Gammaproteobacteria) are thought to be largely responsible for increasing the amount of oxygen in the primeval earth's atmosphere through their continuing photosynthesis. Cyanobacteria use water, carbon dioxide and sunlight to create their food. A layer of mucus often forms over mats of cyanobacterial cells. In modern microbial mats, debris from the surrounding habitat can become trapped within the mucus, which can be cemented by the calcium carbonate to grow thin laminations of limestone. These laminations can accrete over time, resulting in the banded pattern common to stromatolites. The domal morphology of biological stromatolites is the result of the vertical growth necessary for the continued infiltration of sunlight to the organisms for photosynthesis. Layered spherical growth structures termed oncolites are similar to stromatolites and are also known from the fossil record. Thrombolites are poorly laminated or non-laminated clotted structures formed by cyanobacteria common in the fossil record and in modern sediments.
The Zebra River Canyon area of the Kubis platform in the deeply dissected Zaris Mountains of southwestern Namibia provides an extremely well exposed example of the thrombolite-stromatolite-metazoan reefs that developed during the Proterozoic period, the stromatolites here being better developed in updip locations under conditions of higher current velocities and greater sediment influx.
Types
Index

Examples of index fossils
Index fossils (also known as guide fossils, indicator fossils or zone fossils) are fossils used to define and identify geologic periods (or faunal stages). They work on the premise that, although different sediments may look different depending on the conditions under which they were deposited, they may include the remains of the same species of fossil. The shorter the species' time range, the more precisely different sediments can be correlated, and so rapidly evolving species' fossils are particularly valuable. The best index fossils are common, easy to identify at species level and have a broad distribution—otherwise the likelihood of finding and recognizing one in the two sediments is poor.
Trace


A coprolite of a carnivorous dinosaur found in southwestern Saskatchewan
Trace fossils consist mainly of tracks and burrows, but also include coprolites (fossil feces) and marks left by feeding. Trace fossils are particularly significant because they represent a data source that is not limited to animals with easily fossilized hard parts, and they reflect animal behaviours. Many traces date from significantly earlier than the body fossils of animals that are thought to have been capable of making them. Whilst exact assignment of trace fossils to their makers is generally impossible, traces may for example provide the earliest physical evidence of the appearance of moderately complex animals (comparable to earthworms).
Coprolites are classified as trace fossils as opposed to body fossils, as they give evidence for the animal's behaviour (in this case, diet) rather than morphology. They were first described by William Buckland in 1829. Prior to this they were known as "fossil fir cones" and "bezoar stones." They serve a valuable purpose in paleontology because they provide direct evidence of the predation and diet of extinct organisms. Coprolites may range in size from a few millimetres to over 60 centimetres.
Transitional
A transitional fossil is any fossilized remains of a life form that exhibits traits common to both an ancestral group and its derived descendant group. This is especially important where the descendant group is sharply differentiated by gross anatomy and mode of living from the ancestral group. Because of the incompleteness of the fossil record, there is usually no way to know exactly how close a transitional fossil is to the point of divergence. These fossils serve as a reminder that taxonomic divisions are human constructs that have been imposed in hindsight on a continuum of variation.Microfossils

Microfossils about 1 mm
Microfossil is a descriptive term applied to fossilized plants and animals whose size is just at or below the level at which the fossil can be analyzed by the naked eye. A commonly applied cutoff point between "micro" and "macro" fossils is 1 mm. Microfossils may either be complete (or near-complete) organisms in themselves (such as the marine plankters foraminifera and coccolithophores) or component parts (such as small teeth or spores) of larger animals or plants. Microfossils are of critical importance as a reservoir of paleoclimate information, and are also commonly used by biostratigraphers to assist in the correlation of rock units.
Resin
_rotated.JPG)
Leptofoenus pittfieldae trapped in Dominican amber, from 20 to 16 million years ago
Fossil resin (colloquially called amber) is a natural polymer found in many types of strata throughout the world, even the Arctic. The oldest fossil resin dates to the Triassic, though most dates to the Cenozoic. The excretion of the resin by certain plants is thought to be an evolutionary adaptation for protection from insects and to seal wounds. Fossil resin often contains other fossils called inclusions that were captured by the sticky resin. These include bacteria, fungi, other plants, and animals. Animal inclusions are usually small invertebrates, predominantly arthropods such as insects and spiders, and only extremely rarely a vertebrate such as a small lizard. Preservation of inclusions can be exquisite, including small fragments of DNA.
Derived

Eroded Jurassic plesiosaur vertebral centrum found in the Lower Cretaceous Faringdon Sponge Gravels in Faringdon, England. An example of a remanié fossil
A derived, reworked or remanié fossil is a fossil found in rock that accumulated significantly later than when the fossilized animal or plant died. Reworked fossils are created by erosion exhuming (freeing) fossils from the rock formation in which they were originally deposited and their redeposition in an younger sedimentary deposit.
Wood

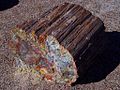
Petrified wood. The internal structure of the tree and bark are maintained in the permineralization process

Polished section of petrified wood showing annual rings
Fossil wood is wood that is preserved in the fossil record. Wood is usually the part of a plant that is best preserved (and most easily found). Fossil wood may or may not be petrified. The fossil wood may be the only part of the plant that has been preserved: therefore such wood may get a special kind of botanical name. This will usually include "xylon" and a term indicating its presumed affinity, such as Araucarioxylon (wood of Araucaria or some related genus), Palmoxylon (wood of an indeterminate palm), or Castanoxylon (wood of an indeterminate chinkapin).
Subfossil

A subfossil dodo skeleton
The term subfossil can be used to refer to remains, such as bones, nests, or defecations, whose fossilization process is not complete, either because the length of time since the animal involved was living is too short (less than 10,000 years) or because the conditions in which the remains were buried were not optimal for fossilization. Subfossils are often found in caves or other shelters where they can be preserved for thousands of years. The main importance of subfossil vs. fossil remains is that the former contain organic material, which can be used for radiocarbon dating or extraction and sequencing of DNA, protein, or other biomolecules. Additionally, isotope ratios can provide much information about the ecological conditions under which extinct animals lived. Subfossils are useful for studying the evolutionary history of an environment and can be important to studies in paleoclimatology.
Subfossils are often found in depositionary environments, such as lake sediments, oceanic sediments, and soils. Once deposited, physical and chemical weathering can alter the state of preservation.
Chemical fossils
Chemical fossils, or chemofossils, are chemicals found in rocks and fossil fuels (petroleum, coal, and natural gas) that provide an organic signature for ancient life. Molecular fossils and isotope ratios represent two types of chemical fossils. The oldest traces of life on Earth are fossils of this type, including carbon isotope anomalies found in zircons that imply the existence of life as early as 4.1 billion years ago.Astrobiology
It has been suggested that biominerals could be important indicators of extraterrestrial life and thus could play an important role in the search for past or present life on the planet Mars. Furthermore, organic components (biosignatures) that are often associated with biominerals are believed to play crucial roles in both pre-biotic and biotic reactions.On 24 January 2014, NASA reported that current studies by the Curiosity and Opportunity rovers on Mars will now be searching for evidence of ancient life, including a biosphere based on autotrophic, chemotrophic and/or chemolithoautotrophic microorganisms, as well as ancient water, including fluvio-lacustrine environments (plains related to ancient rivers or lakes) that may have been habitable.[51][52][53][54] The search for evidence of habitability, taphonomy (related to fossils), and organic carbon on the planet Mars is now a primary NASA objective.
Pseudofossils

An example of a pseudofossil: Manganese dendrites on a limestone bedding plane from Solnhofen, Germany; scale in mm
Pseudofossils are visual patterns in rocks that are produced by geologic processes rather than biologic processes. They can easily be mistaken for real fossils. Some pseudofossils, such as dendrites, are formed by naturally occurring fissures in the rock that get filled up by percolating minerals. Other types of pseudofossils are kidney ore (round shapes in iron ore) and moss agates, which look like moss or plant leaves. Concretions, spherical or ovoid-shaped nodules found in some sedimentary strata, were once thought to be dinosaur eggs, and are often mistaken for fossils as well.
History of the study of fossils
Gathering fossils dates at least to the beginning of recorded history. The fossils themselves are referred to as the fossil record. The fossil record was one of the early sources of data underlying the study of evolution and continues to be relevant to the history of life on Earth. Paleontologists examine the fossil record to understand the process of evolution and the way particular species have evolved.Before Darwin
Many early explanations relied on folktales or mythologies. In China the fossil bones of ancient mammals including Homo erectus were often mistaken for "dragon bones" and used as medicine and aphrodisiacs. In addition, some of these fossil bones are collected as "art" by scholars and they left scripts on it, indicating the time they got the collection. One good example is the famous scholar Huang Tingjian of the South Song Dynasty during the 11th century, who kept one seashell fossil with his poem engraved on it. In the West fossilized sea creatures on mountainsides were seen as proof of the biblical deluge.In 1027, the Persian Avicenna explained fossils' stoniness in The Book of Healing:
If what is said concerning the petrifaction of animals and plants is true, the cause of this (phenomenon) is a powerful mineralizing and petrifying virtue which arises in certain stony spots, or emanates suddenly from the earth during earthquake and subsidences, and petrifies whatever comes into contact with it. As a matter of fact, the petrifaction of the bodies of plants and animals is not more extraordinary than the transformation of waters.The Greek scholar Aristotle realized that fossil seashells from rocks were similar to those found on the beach, indicating the fossils were once living animals. Aristotle previously explained it in terms of vaporous exhalations, which Avicenna modified into the theory of petrifying fluids (succus lapidificatus), later elaborated by Albert of Saxony in the 14th century and accepted in some form by most naturalists by the 16th century.
More scientific views of fossils emerged during the Renaissance. Leonardo da Vinci concurred with Aristotle's view that fossils were the remains of ancient life. For example, da Vinci noticed discrepancies with the biblical flood narrative as an explanation for fossil origins:
If the Deluge had carried the shells for distances of three and four hundred miles from the sea it would have carried them mixed with various other natural objects all heaped up together; but even at such distances from the sea we see the oysters all together and also the shellfish and the cuttlefish and all the other shells which congregate together, found all together dead; and the solitary shells are found apart from one another as we see them every day on the sea-shores.
And we find oysters together in very large families, among which some may be seen with their shells still joined together, indicating that they were left there by the sea and that they were still living when the strait of Gibraltar was cut through. In the mountains of Parma and Piacenza multitudes of shells and corals with holes may be seen still sticking to the rocks...."

Ichthyosaurus and Plesiosaurus from the 1834 Czech edition of Cuvier's Discours sur les revolutions de la surface du globe
Robert Hooke (1635-1703) included micrographs of fossils in his Micrographia and was among the first to observe fossil forams. His observations on fossils, which he stated to be the petrified remains of creatures some of which no longer existed, were published posthumously in 1705.
William Smith (1769–1839), an English canal engineer, observed that rocks of different ages (based on the law of superposition) preserved different assemblages of fossils, and that these assemblages succeeded one another in a regular and determinable order. He observed that rocks from distant locations could be correlated based on the fossils they contained. He termed this the principle of faunal succession. This principle became one of Darwin's chief pieces of evidence that biological evolution was real.
Georges Cuvier came to believe that most if not all the animal fossils he examined were remains of extinct species. This led Cuvier to become an active proponent of the geological school of thought called catastrophism. Near the end of his 1796 paper on living and fossil elephants he said:
- All of these facts, consistent among themselves, and not opposed by any report, seem to me to prove the existence of a world previous to ours, destroyed by some kind of catastrophe.
Linnaeus and Darwin
Early naturalists well understood the similarities and differences of living species leading Linnaeus to develop a hierarchical classification system still in use today. Darwin and his contemporaries first linked the hierarchical structure of the tree of life with the then very sparse fossil record. Darwin eloquently described a process of descent with modification, or evolution, whereby organisms either adapt to natural and changing environmental pressures, or they perish.When Darwin wrote On the Origin of Species by Means of Natural Selection, or the Preservation of Favoured Races in the Struggle for Life, the oldest animal fossils were those from the Cambrian Period, now known to be about 540 million years old. He worried about the absence of older fossils because of the implications on the validity of his theories, but he expressed hope that such fossils would be found, noting that: "only a small portion of the world is known with accuracy." Darwin also pondered the sudden appearance of many groups (i.e. phyla) in the oldest known Cambrian fossiliferous strata.
After Darwin
Since Darwin's time, the fossil record has been extended to between 2.3 and 3.5 billion years. Most of these Precambrian fossils are microscopic bacteria or microfossils. However, macroscopic fossils are now known from the late Proterozoic. The Ediacara biota (also called Vendian biota) dating from 575 million years ago collectively constitutes a richly diverse assembly of early multicellular eukaryotes.The fossil record and faunal succession form the basis of the science of biostratigraphy or determining the age of rocks based on embedded fossils. For the first 150 years of geology, biostratigraphy and superposition were the only means for determining the relative age of rocks. The geologic time scale was developed based on the relative ages of rock strata as determined by the early paleontologists and stratigraphers.
Since the early years of the twentieth century, absolute dating methods, such as radiometric dating (including potassium/argon, argon/argon, uranium series, and, for very recent fossils, radiocarbon dating) have been used to verify the relative ages obtained by fossils and to provide absolute ages for many fossils. Radiometric dating has shown that the earliest known stromatolites are over 3.4 billion years old.
Modern era
The fossil record is
life's evolutionary epic that unfolded over four billion years as
environmental conditions and genetic potential interacted in accordance
with natural selection.
The Virtual Fossil Museum
Paleontology has joined with evolutionary biology to share the interdisciplinary task of outlining the tree of life, which inevitably leads backwards in time to Precambrian microscopic life when cell structure and functions evolved. Earth's deep time in the Proterozoic and deeper still in the Archean is only "recounted by microscopic fossils and subtle chemical signals." Molecular biologists, using phylogenetics, can compare protein amino acid or nucleotide sequence homology (i.e., similarity) to evaluate taxonomy and evolutionary distances among organisms, with limited statistical confidence. The study of fossils, on the other hand, can more specifically pinpoint when and in what organism a mutation first appeared. Phylogenetics and paleontology work together in the clarification of science's still dim view of the appearance of life and its evolution.


Crinoid columnals (Isocrinus nicoleti) from the Middle Jurassic Carmel Formation at Mount Carmel Junction, Utah
Niles Eldredge's study of the Phacops trilobite genus supported the hypothesis that modifications to the arrangement of the trilobite's eye lenses proceeded by fits and starts over millions of years during the Devonian. Eldredge's interpretation of the Phacops fossil record was that the aftermaths of the lens changes, but not the rapidly occurring evolutionary process, were fossilized. This and other data led Stephen Jay Gould and Niles Eldredge to publish their seminal paper on punctuated equilibrium in 1971.
Synchrotron X-ray tomographic analysis of early Cambrian bilaterian embryonic microfossils yielded new insights of metazoan evolution at its earliest stages. The tomography technique provides previously unattainable three-dimensional resolution at the limits of fossilization. Fossils of two enigmatic bilaterians, the worm-like Markuelia and a putative, primitive protostome, Pseudooides, provide a peek at germ layer embryonic development. These 543-million-year-old embryos support the emergence of some aspects of arthropod development earlier than previously thought in the late Proterozoic. The preserved embryos from China and Siberia underwent rapid diagenetic phosphatization resulting in exquisite preservation, including cell structures. This research is a notable example of how knowledge encoded by the fossil record continues to contribute otherwise unattainable information on the emergence and development of life on Earth. For example, the research suggests Markuelia has closest affinity to priapulid worms, and is adjacent to the evolutionary branching of Priapulida, Nematoda and Arthropoda.
Trading and collecting
Fossil trading is the practice of buying and selling fossils. This is many times done illegally with artifacts stolen from research sites, costing many important scientific specimens each year. The problem is quite pronounced in China, where many specimens have been stolen.Fossil collecting (sometimes, in a non-scientific sense, fossil hunting) is the collection of fossils for scientific study, hobby, or profit. Fossil collecting, as practiced by amateurs, is the predecessor of modern paleontology and many still collect fossils and study fossils as amateurs. Professionals and amateurs alike collect fossils for their scientific value.
Gallery
 Three small ammonite fossils, each approximately 1.5 cm across

 Petrified wood in Petrified Forest National Park, Arizona
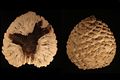 Petrified cone of Araucaria mirabilis from Patagonia, Argentina dating from the Jurassic Period (approx. 210 Ma)

 Eocene fossil flower from Florissant, Colorado
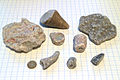 Fossils from beaches of the Baltic Sea island of Gotland, placed on paper with 7 mm (0.28 inch) squares


