Search This Blog

Sunday, September 8, 2019

Human genetic variation

From Wikipedia, the free encyclopedia
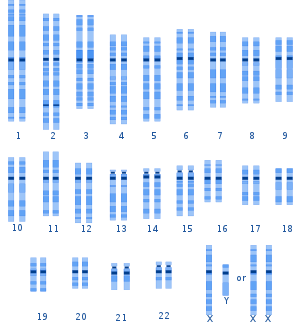
A graphical representation of the typical human karyotype.
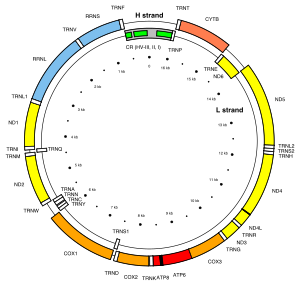
The human mitochondrial DNA.
Human genetic variation is the genetic differences in and among populations. There may be multiple variants of any given gene in the human population (alleles), a situation called polymorphism

No two humans are genetically identical. Even monozygotic twins (who develop from one zygote) have infrequent genetic differences due to mutations occurring during development and gene copy-number variation. Differences between individuals, even closely related individuals, are the key to techniques such as genetic fingerprinting. As of 2017, there are a total of 324 million known variants from sequenced human genomes.[2] As of 2015, the typical difference between the genomes of two individuals was estimated at 20 million base pairs (or 0.6% of the total of 3.2 billion base pairs).

Alleles occur at different frequencies in different human populations. Populations that are more geographically and ancestrally remote tend to differ more. The differences between populations represent a small proportion of overall human genetic variation. Populations also differ in the quantity of variation among their members. The greatest divergence between populations is found in sub-Saharan Africa, consistent with the recent African origin of non-African populations. Populations also vary in the proportion and locus of introgressed genes they received by archaic admixture both inside and outside of Africa.

The study of human genetic variation has evolutionary significance and medical applications. It can help scientists understand ancient human population migrations as well as how human groups are biologically related to one another. For medicine, study of human genetic variation may be important because some disease-causing alleles occur more often in people from specific geographic regions. New findings show that each human has on average 60 new mutations compared to their parents.

Causes of variation

Causes of differences between individuals include independent assortment, the exchange of genes (crossing over and recombination) during reproduction (through meiosis) and various mutational events.

There are at least three reasons why genetic variation exists between populations. Natural selection may confer an adaptive advantage to individuals in a specific environment if an allele provides a competitive advantage. Alleles under selection are likely to occur only in those geographic regions where they confer an advantage. A second important process is genetic drift, which is the effect of random changes in the gene pool, under conditions where most mutations are neutral (that is, they do not appear to have any positive or negative selective effect on the organism). Finally, small migrant populations have statistical differences called the founder effect—from the overall populations where they originated; when these migrants settle new areas, their descendant population typically differs from their population of origin: different genes predominate and it is less genetically diverse.

In humans, the main cause is genetic drift. Serial founder effects and past small population size (increasing the likelihood of genetic drift) may have had an important influence in neutral differences between populations. The second main cause of genetic variation is due to the high degree of neutrality of most mutations. A small, but significant number of genes appear to have undergone recent natural selection, and these selective pressures are sometimes specific to one region.

Measures of variation

Genetic variation among humans occurs on many scales, from gross alterations in the human karyotype to single nucleotide changes. Chromosome abnormalities are detected in 1 of 160 live human births. Apart from sex chromosome disorders, most cases of aneuploidy result in death of the developing fetus (miscarriage); the most common extra autosomal chromosomes among live births are 21, 18 and 13.

Nucleotide diversity is the average proportion of nucleotides that differ between two individuals. As of 2004, the human nucleotide diversity was estimated to be 0.1% to 0.4% of base pairs. In 2015, the 1000 Genomes Project, which sequenced one thousand individuals from 26 human populations, found that "a typical [individual] genome differs from the reference human genome at 4.1 million to 5.0 million sites … affecting 20 million bases of sequence"; the latter figure corresponds to 0.6% of total number of base pairs. Nearly all (>99.9%) of these sites are small differences, either single nucleotide polymorphisms or brief insertions or deletions (indels) in the genetic sequence, but structural variations account for a greater number of base-pairs than the SNPs and indels.

As of 2017, the Single Nucleotide Polymorphism Database (dbSNP), which lists SNP and other variants, listed 324 million variants found in sequenced human genomes.

Single nucleotide polymorphisms

DNA molecule 1 differs from DNA molecule 2 at a single base-pair location (a C/T polymorphism).

A single nucleotide polymorphism (SNP) is a difference in a single nucleotide between members of one species that occurs in at least 1% of the population. The 2,504 individuals characterized by the 1000 Genomes Project had 84.7 million SNPs among them. SNPs are the most common type of sequence variation, estimated in 1998 to account for 90% of all sequence variants. Other sequence variations are single base exchanges, deletions and insertions. SNPs occur on average about every 100 to 300 bases and so are the major source of heterogeneity. 

A functional, or non-synonymous, SNP is one that affects some factor such as gene splicing or messenger RNA, and so causes a phenotypic difference between members of the species. About 3% to 5% of human SNPs are functional (see International HapMap Project). Neutral, or synonymous SNPs are still useful as genetic markers in genome-wide association studies, because of their sheer number and the stable inheritance over generations.

A coding SNP is one that occurs inside a gene. There are 105 Human Reference SNPs that result in premature stop codons in 103 genes. This corresponds to 0.5% of coding SNPs. They occur due to segmental duplication in the genome. These SNPs result in loss of protein, yet all these SNP alleles are common and are not purified in negative selection.

Structural variation

Structural variation is the variation in structure of an organism's chromosome. Structural variations, such as copy-number variation and deletions, inversions, insertions and duplications, account for much more human genetic variation than single nucleotide diversity. This was concluded in 2007 from analysis of the diploid full sequences of the genomes of two humans: Craig Venter and James D. Watson. This added to the two haploid sequences which were amalgamations of sequences from many individuals, published by the Human Genome Project and Celera Genomics respectively.

According to the 1000 Genomes Project, a typical human has 2,100 to 2,500 structural variations, which include approximately 1,000 large deletions, 160 copy-number variants, 915 Alu insertions, 128 L1 insertions, 51 SVA insertions, 4 NUMTs, and 10 inversions.

Copy number variation

A copy-number variation (CNV) is a difference in the genome due to deleting or duplicating large regions of DNA on some chromosome. It is estimated that 0.4% of the genomes of unrelated humans differ with respect to copy number. When copy number variation is included, human-to-human genetic variation is estimated to be at least 0.5% (99.5% similarity). Copy number variations are inherited but can also arise during development.

A visual map with the regions with high genomic variation of the modern-human reference assembly relatively to a Neanderthal of 50k  has been built by Pratas et al.

Epigenetics

Epigenetic variation is variation in the chemical tags that attach to DNA and affect how genes get read. The tags, "called epigenetic markings, act as switches that control how genes can be read." At some alleles, the epigenetic state of the DNA, and associated phenotype, can be inherited across generations of individuals.

Genetic variability

Genetic variability is a measure of the tendency of individual genotypes in a population to vary (become different) from one another. Variability is different from genetic diversity, which is the amount of variation seen in a particular population. The variability of a trait is how much that trait tends to vary in response to environmental and genetic influences.

Clines

In biology, a cline is a continuum of species, populations, races, varieties, or forms of organisms that exhibit gradual phenotypic and/or genetic differences over a geographical area, typically as a result of environmental heterogeneity. In the scientific study of human genetic variation, a gene cline can be rigorously defined and subjected to quantitative metrics.

Haplogroups

In the study of molecular evolution, a haplogroup is a group of similar haplotypes that share a common ancestor with a single nucleotide polymorphism (SNP) mutation. Haplogroups pertain to deep ancestral origins dating back thousands of years.

The most commonly studied human haplogroups are Y-chromosome (Y-DNA) haplogroups and mitochondrial DNA (mtDNA) haplogroups, both of which can be used to define genetic populations. Y-DNA is passed solely along the patrilineal line, from father to son, while mtDNA is passed down the matrilineal line, from mother to both daughter or son. The Y-DNA and mtDNA may change by chance mutation at each generation.

Variable number tandem repeats

A variable number tandem repeat (VNTR) is the variation of length of a tandem repeat. A tandem repeat is the adjacent repetition of a short nucleotide sequence. Tandem repeats exist on many chromosomes, and their length varies between individuals. Each variant acts as an inherited allele, so they are used for personal or parental identification. Their analysis is useful in genetics and biology research, forensics, and DNA fingerprinting

Short tandem repeats (about 5 base pairs) are called microsatellites, while longer ones are called minisatellites.

History and geographic distribution

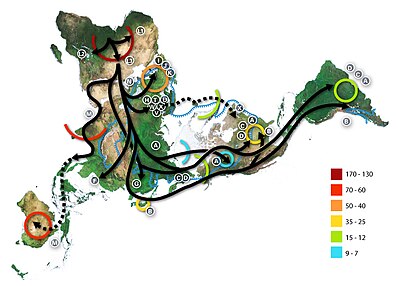
Map of the migration of modern humans out of Africa, based on mitochondrial DNA. Colored rings indicate thousand years before present.
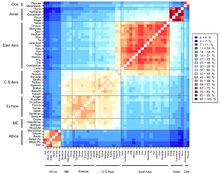
Genetic distance map by Magalhães et al. (2012)

Recent African origin of modern humans

The recent African origin of modern humans paradigm assumes the dispersal of non-African populations of anatomically modern humans after 70,000 years ago. Dispersal within Africa occurred significantly earlier, at least 130,000 years ago. The "out of Africa" theory originates in the 19th century, as a tentative suggestion in Charles Darwin's Descent of Man, but remained speculative until the 1980s when it was supported by study of present-day mitochondrial DNA, combined with evidence from physical anthropology of archaic specimens

According to a 2000 study of Y-chromosome sequence variation, human Y-chromosomes trace ancestry to Africa, and the descendants of the derived lineage left Africa and eventually were replaced by archaic human Y-chromosomes in Eurasia. The study also shows that a minority of contemporary populations in East Africa and the Khoisan are the descendants of the most ancestral patrilineages of anatomically modern humans that left Africa 35,000 to 89,000 years ago. Other evidence supporting the theory is that variations in skull measurements decrease with distance from Africa at the same rate as the decrease in genetic diversity. Human genetic diversity decreases in native populations with migratory distance from Africa, and this is thought to be due to bottlenecks during human migration, which are events that temporarily reduce population size.

A 2009 genetic clustering study, which genotyped 1327 polymorphic markers in various African populations, identified six ancestral clusters. The clustering corresponded closely with ethnicity, culture and language. A 2018 whole genome sequencing study of the world's populations observed similar clusters among the populations in Africa. At K=9, distinct ancestral components defined the Afroasiatic-speaking populations inhabiting North Africa and Northeast Africa; the Nilo-Saharan-speaking populations in Northeast Africa and East Africa; the Ari populations in Northeast Africa; the Niger-Congo-speaking populations in West-Central Africa, West Africa, East Africa and Southern Africa; the Pygmy populations in Central Africa; and the Khoisan populations in Southern Africa.

Population genetics

Because of the common ancestry of all humans, only a small number of variants have large differences in frequency between populations. However, some rare variants in the world's human population are much more frequent in at least one population (more than 5%).

Genetic variation
It is commonly assumed that early humans left Africa, and thus must have passed through a population bottleneck before their African-Eurasian divergence around 100,000 years ago (ca. 3,000 generations). The rapid expansion of a previously small population has two important effects on the distribution of genetic variation. First, the so-called founder effect occurs when founder populations bring only a subset of the genetic variation from their ancestral population. Second, as founders become more geographically separated, the probability that two individuals from different founder populations will mate becomes smaller. The effect of this assortative mating is to reduce gene flow between geographical groups and to increase the genetic distance between groups.

The expansion of humans from Africa affected the distribution of genetic variation in two other ways. First, smaller (founder) populations experience greater genetic drift because of increased fluctuations in neutral polymorphisms. Second, new polymorphisms that arose in one group were less likely to be transmitted to other groups as gene flow was restricted.

Populations in Africa tend to have lower amounts of linkage disequilibrium than do populations outside Africa, partly because of the larger size of human populations in Africa over the course of human history and partly because the number of modern humans who left Africa to colonize the rest of the world appears to have been relatively low. In contrast, populations that have undergone dramatic size reductions or rapid expansions in the past and populations formed by the mixture of previously separate ancestral groups can have unusually high levels of linkage disequilibrium

Distribution of variation

Human genetic variation calculated from genetic data representing 346 microsatellite loci taken from 1484 individuals in 78 human populations. The upper graph illustrates that as populations are further from East Africa, they have declining genetic diversity as measured in average number of microsatellite repeats at each of the loci. The bottom chart illustrates isolation by distance. Populations with a greater distance between them are more dissimilar (as measured by the Fst statistic) than those which are geographically close to one another. The horizontal axis of both charts is geographic distance as measured along likely routes of human migration. (Chart from Kanitz et al. 2018)

The distribution of genetic variants within and among human populations are impossible to describe succinctly because of the difficulty of defining a "population," the clinal nature of variation, and heterogeneity across the genome (Long and Kittles 2003). In general, however, an average of 85% of genetic variation exists within local populations, ~7% is between local populations within the same continent, and ~8% of variation occurs between large groups living on different continents. The recent African origin theory for humans would predict that in Africa there exists a great deal more diversity than elsewhere and that diversity should decrease the further from Africa a population is sampled.

Phenotypic variation

Sub-Saharan Africa has the most human genetic diversity and the same has been shown to hold true for phenotypic variation in skull form. Phenotype is connected to genotype through gene expression. Genetic diversity decreases smoothly with migratory distance from that region, which many scientists believe to be the origin of modern humans, and that decrease is mirrored by a decrease in phenotypic variation. Skull measurements are an example of a physical attribute whose within-population variation decreases with distance from Africa.

The distribution of many physical traits resembles the distribution of genetic variation within and between human populations (American Association of Physical Anthropologists 1996; Keita and Kittles 1997). For example, ~90% of the variation in human head shapes occurs within continental groups, and ~10% separates groups, with a greater variability of head shape among individuals with recent African ancestors (Relethford 2002).

A prominent exception to the common distribution of physical characteristics within and among groups is skin color. Approximately 10% of the variance in skin color occurs within groups, and ~90% occurs between groups (Relethford 2002). This distribution of skin color and its geographic patterning — with people whose ancestors lived predominantly near the equator having darker skin than those with ancestors who lived predominantly in higher latitudes — indicate that this attribute has been under strong selective pressure. Darker skin appears to be strongly selected for in equatorial regions to prevent sunburn, skin cancer, the photolysis of folate, and damage to sweat glands.

Understanding how genetic diversity in the human population impacts various levels of gene expression is an active area of research. While earlier studies focused on the relationship between DNA variation and RNA expression, more recent efforts are characterizing the genetic control of various aspects of gene expression including chromatin states, translation, and protein levels. A study published in 2007 found that 25% of genes showed different levels of gene expression between populations of European and Asian descent. The primary cause of this difference in gene expression was thought to be SNPs in gene regulatory regions of DNA. Another study published in 2007 found that approximately 83% of genes were expressed at different levels among individuals and about 17% between populations of European and African descent.
Wright's Fixation index as measure of variation
The population geneticist Sewall Wright developed the fixation index (often abbreviated to FST) as a way of measuring genetic differences between populations. This statistic is often used in taxonomy to compare differences between any two given populations by measuring the genetic differences among and between populations for individual genes, or for many genes simultaneously. It is often stated that the fixation index for humans is about 0.15. This translates to an estimated 85% of the variation measured in the overall human population is found within individuals of the same population, and about 15% of the variation occurs between populations. These estimates imply that any two individuals from different populations are almost as likely to be more similar to each other than either is to a member of their own group.

"The shared evolutionary history of living humans has resulted in a high relatedness among all living people, as indicated for example by the very low fixation index (FST) among living human populations."
Richard Lewontin, who affirmed these ratios, thus concluded neither "race" nor "subspecies" were appropriate or useful ways to describe human populations.

Wright himself believed that values >0.25 represent very great genetic variation and that an FST of 0.15–0.25 represented great variation. However, about 5% of human variation occurs between populations within continents, therefore FST values between continental groups of humans (or races) of as low as 0.1 (or possibly lower) have been found in some studies, suggesting more moderate levels of genetic variation. Graves (1996) has countered that FST should not be used as a marker of subspecies status, as the statistic is used to measure the degree of differentiation between populations, although see also Wright (1978).

Jeffrey Long and Rick Kittles give a long critique of the application of FST to human populations in their 2003 paper "Human Genetic Diversity and the Nonexistence of Biological Races". They find that the figure of 85% is misleading because it implies that all human populations contain on average 85% of all genetic diversity. They argue the underlying statistical model incorrectly assumes equal and independent histories of variation for each large human population. A more realistic approach is to understand that some human groups are parental to other groups and that these groups represent paraphyletic groups to their descent groups. For example, under the recent African origin theory the human population in Africa is paraphyletic to all other human groups because it represents the ancestral group from which all non-African populations derive, but more than that, non-African groups only derive from a small non-representative sample of this African population. This means that all non-African groups are more closely related to each other and to some African groups (probably east Africans) than they are to others, and further that the migration out of Africa represented a genetic bottleneck, with much of the diversity that existed in Africa not being carried out of Africa by the emigrating groups. Under this scenario, human populations do not have equal amounts of local variability, but rather diminished amounts of diversity the further from Africa any population lives. Long and Kittles find that rather than 85% of human genetic diversity existing in all human populations, about 100% of human diversity exists in a single African population, whereas only about 70% of human genetic diversity exists in a population derived from New Guinea. Long and Kittles argued that this still produces a global human population that is genetically homogeneous compared to other mammalian populations.

Archaic admixture

There is a hypothesis that anatomically modern humans interbred with Neanderthals during the Middle Paleolithic. In May 2010, the Neanderthal Genome Project presented genetic evidence that interbreeding did likely take place and that a small but significant portion of Neanderthal admixture is present in the DNA of modern Eurasians and Oceanians, and nearly absent in sub-Saharan African populations.

Between 4% and 6% of the genome of Melanesians (represented by the Papua New Guinean and Bougainville Islander) are thought to derive from Denisova hominins – a previously unknown species which shares a common origin with Neanderthals. It was possibly introduced during the early migration of the ancestors of Melanesians into Southeast Asia. This history of interaction suggests that Denisovans once ranged widely over eastern Asia.

Thus, Melanesians emerge as the most archaic-admixed population, having Denisovan/Neanderthal-related admixture of ~8%.

In a study published in 2013, Jeffrey Wall from University of California studied whole sequence-genome data and found higher rates of introgression in Asians compared to Europeans. Hammer et al. tested the hypothesis that contemporary African genomes have signatures of gene flow with archaic human ancestors and found evidence of archaic admixture in African genomes, suggesting that modest amounts of gene flow were widespread throughout time and space during the evolution of anatomically modern humans.

Categorization of the world population

Chart showing human genetic clustering.

New data on human genetic variation has reignited the debate about a possible biological basis for categorization of humans into races. Most of the controversy surrounds the question of how to interpret the genetic data and whether conclusions based on it are sound. Some researchers argue that self-identified race can be used as an indicator of geographic ancestry for certain health risks and medications.

Although the genetic differences among human groups are relatively small, these differences in certain genes such as duffy, ABCC11, SLC24A5, called ancestry-informative markers (AIMs) nevertheless can be used to reliably situate many individuals within broad, geographically based groupings. For example, computer analyses of hundreds of polymorphic loci sampled in globally distributed populations have revealed the existence of genetic clustering that roughly is associated with groups that historically have occupied large continental and subcontinental regions (Rosenberg et al. 2002; Bamshad et al. 2003).

Some commentators have argued that these patterns of variation provide a biological justification for the use of traditional racial categories. They argue that the continental clusterings correspond roughly with the division of human beings into sub-Saharan Africans; Europeans, Western Asians, Central Asians, Southern Asians and Northern Africans; Eastern Asians, Southeast Asians, Polynesians and Native Americans; and other inhabitants of Oceania (Melanesians, Micronesians & Australian Aborigines) (Risch et al. 2002). Other observers disagree, saying that the same data undercut traditional notions of racial groups (King and Motulsky 2002; Calafell 2003; Tishkoff and Kidd 2004). They point out, for example, that major populations considered races or subgroups within races do not necessarily form their own clusters.

Furthermore, because human genetic variation is clinal, many individuals affiliate with two or more continental groups. Thus, the genetically based "biogeographical ancestry" assigned to any given person generally will be broadly distributed and will be accompanied by sizable uncertainties (Pfaff et al. 2004).

In many parts of the world, groups have mixed in such a way that many individuals have relatively recent ancestors from widely separated regions. Although genetic analyses of large numbers of loci can produce estimates of the percentage of a person's ancestors coming from various continental populations (Shriver et al. 2003; Bamshad et al. 2004), these estimates may assume a false distinctiveness of the parental populations, since human groups have exchanged mates from local to continental scales throughout history (Cavalli-Sforza et al. 1994; Hoerder 2002). Even with large numbers of markers, information for estimating admixture proportions of individuals or groups is limited, and estimates typically will have wide confidence intervals (Pfaff et al. 2004).

Genetic clustering

Genetic data can be used to infer population structure and assign individuals to groups that often correspond with their self-identified geographical ancestry. Jorde and Wooding (2004) argued that "Analysis of many loci now yields reasonably accurate estimates of genetic similarity among individuals, rather than populations. Clustering of individuals is correlated with geographic origin or ancestry." However, identification by geographic origin may quickly break down when considering historical ancestry shared between individuals back in time.

An analysis of autosomal SNP data from the International HapMap Project (Phase II) and CEPH Human Genome Diversity Panel samples was published in 2009. The study of 53 populations taken from the HapMap and CEPH data (1138 unrelated individuals) suggested that natural selection may shape the human genome much more slowly than previously thought, with factors such as migration within and among continents more heavily influencing the distribution of genetic variations. A similar study published in 2010 found strong genome-wide evidence for selection due to changes in ecoregion, diet, and subsistence particularly in connection with polar ecoregions, with foraging, and with a diet rich in roots and tubers. In a 2016 study, principal component analysis of genome-wide data was capable of recovering previously-known targets for positive selection (without prior definition of populations) as well as a number of new candidate genes.

Forensic anthropology

Forensic anthropologists can determine aspects of geographic ancestry (i.e. Asian, African, or European) from skeletal remains with a high degree of accuracy by analyzing skeletal measurements. According to some studies, individual test methods such as mid-facial measurements and femur traits can identify the geographic ancestry and by extension the racial category to which an individual would have been assigned during their lifetime, with over 80% accuracy, and in combination can be even more accurate. However, the skeletons of people who have recent ancestry in different geographical regions can exhibit characteristics of more than one ancestral group and, hence, cannot be identified as belonging to any single ancestral group.

Triangle plot shows average admixture of five North American ethnic groups. Individuals that self-identify with each group can be found at many locations on the map, but on average groups tend to cluster differently.

Gene flow and admixture

Gene flow between two populations reduces the average genetic distance between the populations, only totally isolated human populations experience no gene flow and most populations have continuous gene flow with other neighboring populations which create the clinal distribution observed for moth genetic variation. When gene flow takes place between well-differentiated genetic populations the result is referred to as "genetic admixture".

Admixture mapping is a technique used to study how genetic variants cause differences in disease rates between population. Recent admixture populations that trace their ancestry to multiple continents are well suited for identifying genes for traits and diseases that differ in prevalence between parental populations. African-American populations have been the focus of numerous population genetic and admixture mapping studies, including studies of complex genetic traits such as white cell count, body-mass index, prostate cancer and renal disease.

An analysis of phenotypic and genetic variation including skin color and socio-economic status was carried out in the population of Cape Verde which has a well documented history of contact between Europeans and Africans. The studies showed that pattern of admixture in this population has been sex-biased and there is a significant interactions between socio economic status and skin color independent of the skin color and ancestry. Another study shows an increased risk of graft-versus-host disease complications after transplantation due to genetic variants in human leukocyte antigen (HLA) and non-HLA proteins.

Health

Differences in allele frequencies contribute to group differences in the incidence of some monogenic diseases, and they may contribute to differences in the incidence of some common diseases. For the monogenic diseases, the frequency of causative alleles usually correlates best with ancestry, whether familial (for example, Ellis-van Creveld syndrome among the Pennsylvania Amish), ethnic (Tay–Sachs disease among Ashkenazi Jewish populations), or geographical (hemoglobinopathies among people with ancestors who lived in malarial regions). To the extent that ancestry corresponds with racial or ethnic groups or subgroups, the incidence of monogenic diseases can differ between groups categorized by race or ethnicity, and health-care professionals typically take these patterns into account in making diagnoses.

Even with common diseases involving numerous genetic variants and environmental factors, investigators point to evidence suggesting the involvement of differentially distributed alleles with small to moderate effects. Frequently cited examples include hypertension (Douglas et al. 1996), diabetes (Gower et al. 2003), obesity (Fernandez et al. 2003), and prostate cancer (Platz et al. 2000). However, in none of these cases has allelic variation in a susceptibility gene been shown to account for a significant fraction of the difference in disease prevalence among groups, and the role of genetic factors in generating these differences remains uncertain (Mountain and Risch 2004).

Some other variations on the other hand are beneficial to human, as they prevent certain diseases and increase the chance to adapt to the environment. For example, mutation in CCR5 gene that protects against AIDS. CCR5 gene is absent on the surface of cell due to mutation. Without CCR5 gene on the surface, there is nothing for HIV viruses to grab on and bind into. Therefore the mutation on CCR5 gene decreases the chance of an individual’s risk with AIDS. The mutation in CCR5 is also quite popular in certain areas, with more than 14% of the population carry the mutation in Europe and about 6–10% in Asia and North Africa.

HIV attachment

Apart from mutations, many genes that may have aided humans in ancient times plague humans today. For example, it is suspected that genes that allow humans to more efficiently process food are those that make people susceptible to obesity and diabetes today.

Neil Risch of Stanford University has proposed that self-identified race/ethnic group could be a valid means of categorization in the USA for public health and policy considerations. A 2002 paper by Noah Rosenberg's group makes a similar claim: "The structure of human populations is relevant in various epidemiological contexts. As a result of variation in frequencies of both genetic and nongenetic risk factors, rates of disease and of such phenotypes as adverse drug response vary across populations. Further, information about a patient’s population of origin might provide health care practitioners with information about risk when direct causes of disease are unknown."

Genome projects

Human genome projects are scientific endeavors that determine or study the structure of the human genome. The Human Genome Project was a landmark genome project.
Quantum entanglement

From Wikipedia, the free encyclopedia
 
Spontaneous parametric down-conversion process can split photons into type II photon pairs with mutually perpendicular polarization.
 
Quantum entanglement is a physical phenomenon that occurs when pairs or groups of particles are generated, interact, or share spatial proximity in ways such that the quantum state of each particle cannot be described independently of the state of the others, even when the particles are separated by a large distance. 

Measurements of physical properties such as position, momentum, spin, and polarization, performed on entangled particles are found to be perfectly correlated. For example, if a pair of particles is generated in such a way that their total spin is known to be zero, and one particle is found to have clockwise spin on a certain axis, the spin of the other particle, measured on the same axis, will be found to be counterclockwise, as is to be expected due to their entanglement. However, this behavior gives rise to seemingly paradoxical effects: any measurement of a property of a particle performs an irreversible collapse on that particle and will change the original quantum state. In the case of entangled particles, such a measurement will be on the entangled system as a whole.

Such phenomena were the subject of a 1935 paper by Albert Einstein, Boris Podolsky, and Nathan Rosen, and several papers by Erwin Schrödinger shortly thereafter, describing what came to be known as the EPR paradox. Einstein and others considered such behavior to be impossible, as it violated the local realism view of causality (Einstein referring to it as "spooky action at a distance") and argued that the accepted formulation of quantum mechanics must therefore be incomplete.

Later, however, the counterintuitive predictions of quantum mechanics were verified experimentally in tests where the polarization or spin of entangled particles were measured at separate locations, statistically violating Bell's inequality. In earlier tests it couldn't be absolutely ruled out that the test result at one point could have been subtly transmitted to the remote point, affecting the outcome at the second location. However so-called "loophole-free" Bell tests have been performed in which the locations were separated such that communications at the speed of light would have taken longer—in one case 10,000 times longer—than the interval between the measurements.

According to some interpretations of quantum mechanics, the effect of one measurement occurs instantly. Other interpretations which don't recognize wavefunction collapse dispute that there is any "effect" at all. However, all interpretations agree that entanglement produces correlation between the measurements and that the mutual information between the entangled particles can be exploited, but that any transmission of information at faster-than-light speeds is impossible.

Quantum entanglement has been demonstrated experimentally with photons, neutrinos, electrons, molecules as large as buckyballs, and even small diamonds. On 13 July 2019, scientists from the University of Glasgow reported taking the first ever photo of a strong form of quantum entanglement known as Bell entanglement. The utilization of entanglement in communication and computation is a very active area of research.

History

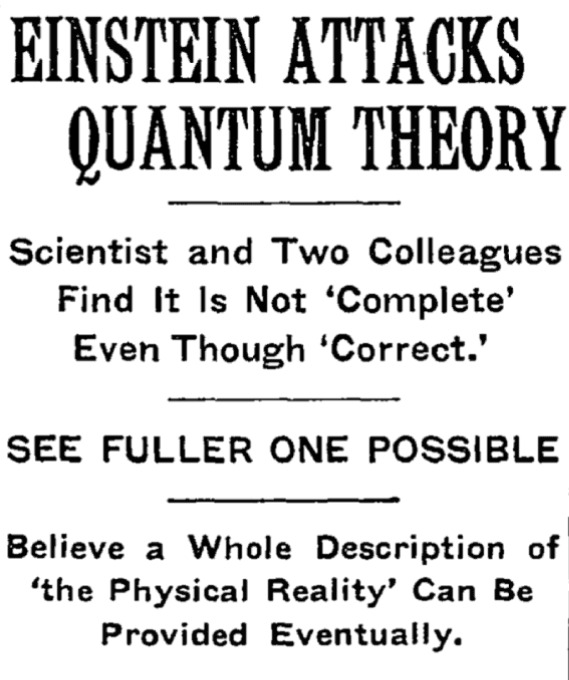
Article headline regarding the Einstein–Podolsky–Rosen paradox (EPR paradox) paper, in the May 4, 1935 issue of The New York Times.
 
The counterintuitive predictions of quantum mechanics about strongly correlated systems were first discussed by Albert Einstein in 1935, in a joint paper with Boris Podolsky and Nathan Rosen. In this study, the three formulated the Einstein–Podolsky–Rosen paradox (EPR paradox), a thought experiment that attempted to show that quantum mechanical theory was incomplete. They wrote: "We are thus forced to conclude that the quantum-mechanical description of physical reality given by wave functions is not complete."

However, the three scientists did not coin the word entanglement, nor did they generalize the special properties of the state they considered. Following the EPR paper, Erwin Schrödinger wrote a letter to Einstein in German in which he used the word Verschränkung (translated by himself as entanglement) "to describe the correlations between two particles that interact and then separate, as in the EPR experiment."

Schrödinger shortly thereafter published a seminal paper defining and discussing the notion of "entanglement." In the paper he recognized the importance of the concept, and stated: "I would not call [entanglement] one but rather the characteristic trait of quantum mechanics, the one that enforces its entire departure from classical lines of thought." 

Like Einstein, Schrödinger was dissatisfied with the concept of entanglement, because it seemed to violate the speed limit on the transmission of information implicit in the theory of relativity. Einstein later famously derided entanglement as "spukhafte Fernwirkung" or "spooky action at a distance." 

The EPR paper generated significant interest among physicists which inspired much discussion about the foundations of quantum mechanics (perhaps most famously Bohm's interpretation of quantum mechanics), but produced relatively little other published work. Despite the interest, the weak point in EPR's argument was not discovered until 1964, when John Stewart Bell proved that one of their key assumptions, the principle of locality, as applied to the kind of hidden variables interpretation hoped for by EPR, was mathematically inconsistent with the predictions of quantum theory. 

Specifically, Bell demonstrated an upper limit, seen in Bell's inequality, regarding the strength of correlations that can be produced in any theory obeying local realism, and showed that quantum theory predicts violations of this limit for certain entangled systems. His inequality is experimentally testable, and there have been numerous relevant experiments, starting with the pioneering work of Stuart Freedman and John Clauser in 1972 and Alain Aspect's experiments in 1982, all of which have shown agreement with quantum mechanics rather than the principle of local realism.

For decades, each had left open at least one loophole by which it was possible to question the validity of the results. However, in 2015 an experiment was performed that simultaneously closed both the detection and locality loopholes, and was heralded as "loophole-free"; this experiment ruled out a large class of local realism theories with certainty. Alain Aspect notes that the "setting-independence loophole" – which he refers to as "far-fetched", yet, a "residual loophole" that "cannot be ignored" – has yet to be closed, and the free-will / superdeterminism loophole is unclosable; saying "no experiment, as ideal as it is, can be said to be totally loophole-free."

A minority opinion holds that although quantum mechanics is correct, there is no superluminal instantaneous action-at-a-distance between entangled particles once the particles are separated.

Bell's work raised the possibility of using these super-strong correlations as a resource for communication. It led to the 1984 discovery of quantum key distribution protocols, most famously BB84 by Charles H. Bennett and Gilles Brassard and E91 by Artur Ekert. Although BB84 does not use entanglement, Ekert's protocol uses the violation of a Bell's inequality as a proof of security.

In October 2018, physicists reported that quantum behavior can be explained with classical physics for a single particle, but not for multiple particles as in quantum entanglement and related nonlocality phenomena.

In July 2019 physicists reported, for the first time, capturing an image of quantum entanglement.

Concept

Meaning of entanglement

An entangled system is defined to be one whose quantum state cannot be factored as a product of states of its local constituents; that is to say, they are not individual particles but are an inseparable whole. In entanglement, one constituent cannot be fully described without considering the other(s). The state of a composite system is always expressible as a sum, or superposition, of products of states of local constituents; it is entangled if this sum necessarily has more than one term.

Quantum systems can become entangled through various types of interactions. For some ways in which entanglement may be achieved for experimental purposes, see the section below on methods. Entanglement is broken when the entangled particles decohere through interaction with the environment; for example, when a measurement is made.

As an example of entanglement: a subatomic particle decays into an entangled pair of other particles. The decay events obey the various conservation laws, and as a result, the measurement outcomes of one daughter particle must be highly correlated with the measurement outcomes of the other daughter particle (so that the total momenta, angular momenta, energy, and so forth remains roughly the same before and after this process). For instance, a spin-zero particle could decay into a pair of spin-½ particles. Since the total spin before and after this decay must be zero (conservation of angular momentum), whenever the first particle is measured to be spin up on some axis, the other, when measured on the same axis, is always found to be spin down. (This is called the spin anti-correlated case; and if the prior probabilities for measuring each spin are equal, the pair is said to be in the singlet state.) 

The special property of entanglement can be better observed if we separate the said two particles. Let's put one of them in the White House in Washington and the other in Buckingham Palace (think about this as a thought experiment, not an actual one). Now, if we measure a particular characteristic of one of these particles (say, for example, spin), get a result, and then measure the other particle using the same criterion (spin along the same axis), we find that the result of the measurement of the second particle will match (in a complementary sense) the result of the measurement of the first particle, in that they will be opposite in their values.

The above result may or may not be perceived as surprising. A classical system would display the same property, and a hidden variable theory (see below) would certainly be required to do so, based on conservation of angular momentum in classical and quantum mechanics alike. The difference is that a classical system has definite values for all the observables all along, while the quantum system does not. In a sense to be discussed below, the quantum system considered here seems to acquire a probability distribution for the outcome of a measurement of the spin along any axis of the other particle upon measurement of the first particle. This probability distribution is in general different from what it would be without measurement of the first particle. This may certainly be perceived as surprising in the case of spatially separated entangled particles.

Paradox

The paradox is that a measurement made on either of the particles apparently collapses the state of the entire entangled system—and does so instantaneously, before any information about the measurement result could have been communicated to the other particle (assuming that information cannot travel faster than light) and hence assured the "proper" outcome of the measurement of the other part of the entangled pair. In the Copenhagen interpretation, the result of a spin measurement on one of the particles is a collapse into a state in which each particle has a definite spin (either up or down) along the axis of measurement. The outcome is taken to be random, with each possibility having a probability of 50%. However, if both spins are measured along the same axis, they are found to be anti-correlated. This means that the random outcome of the measurement made on one particle seems to have been transmitted to the other, so that it can make the "right choice" when it too is measured.

The distance and timing of the measurements can be chosen so as to make the interval between the two measurements spacelike, hence, any causal effect connecting the events would have to travel faster than light. According to the principles of special relativity, it is not possible for any information to travel between two such measuring events. It is not even possible to say which of the measurements came first. For two spacelike separated events x1 and x2 there are inertial frames in which x1 is first and others in which x2 is first. Therefore, the correlation between the two measurements cannot be explained as one measurement determining the other: different observers would disagree about the role of cause and effect.

(In fact similar paradoxes can arise even without entanglement: the position of a single particle is spread out over space, and two widely separated detectors attempting to detect the particle in two different places must instantaneously attain appropriate correlation, so that they do not both detect the particle.)

Hidden variables theory

A possible resolution to the paradox is to assume that quantum theory is incomplete, and the result of measurements depends on predetermined "hidden variables". The state of the particles being measured contains some hidden variables, whose values effectively determine, right from the moment of separation, what the outcomes of the spin measurements are going to be. This would mean that each particle carries all the required information with it, and nothing needs to be transmitted from one particle to the other at the time of measurement. Einstein and others (see the previous section) originally believed this was the only way out of the paradox, and the accepted quantum mechanical description (with a random measurement outcome) must be incomplete.

Violations of Bell's inequality

The hidden variables theory fails, however, when measurements of the spin of entangled particles along different axes are considered (e.g., along any of three axes that make angles of 120 degrees). If a large number of pairs of such measurements are made (on a large number of pairs of entangled particles), then statistically, if the local realist or hidden variables view were correct, the results would always satisfy Bell's inequality. A number of experiments have shown in practice that Bell's inequality is not satisfied. However, prior to 2015, all of these had loophole problems that were considered the most important by the community of physicists. When measurements of the entangled particles are made in moving relativistic reference frames, in which each measurement (in its own relativistic time frame) occurs before the other, the measurement results remain correlated.

The fundamental issue about measuring spin along different axes is that these measurements cannot have definite values at the same time―they are incompatible in the sense that these measurements' maximum simultaneous precision is constrained by the uncertainty principle. This is contrary to what is found in classical physics, where any number of properties can be measured simultaneously with arbitrary accuracy. It has been proven mathematically that compatible measurements cannot show Bell-inequality-violating correlations, and thus entanglement is a fundamentally non-classical phenomenon.

Other types of experiments

In experiments in 2012 and 2013, polarization correlation was created between photons that never coexisted in time. The authors claimed that this result was achieved by entanglement swapping between two pairs of entangled photons after measuring the polarization of one photon of the early pair, and that it proves that quantum non-locality applies not only to space but also to time.

In three independent experiments in 2013 it was shown that classically-communicated separable quantum states can be used to carry entangled states. The first loophole-free Bell test was held in TU Delft in 2015 confirming the violation of Bell inequality.

In August 2014, Brazilian researcher Gabriela Barreto Lemos and team were able to "take pictures" of objects using photons that had not interacted with the subjects, but were entangled with photons that did interact with such objects. Lemos, from the University of Vienna, is confident that this new quantum imaging technique could find application where low light imaging is imperative, in fields like biological or medical imaging.

In 2015, Markus Greiner's group at Harvard performed a direct measurement of Renyi entanglement in a system of ultracold bosonic atoms.

From 2016 various companies like IBM, Microsoft etc. have successfully created quantum computers and allowed developers and tech enthusiasts to openly experiment with concepts of quantum mechanics including quantum entanglement.

Mystery of time

There have been suggestions to look at the concept of time as an emergent phenomenon that is a side effect of quantum entanglement. In other words, time is an entanglement phenomenon, which places all equal clock readings (of correctly prepared clocks, or of any objects usable as clocks) into the same history. This was first fully theorized by Don Page and William Wootters in 1983. The Wheeler–DeWitt equation that combines general relativity and quantum mechanics – by leaving out time altogether – was introduced in the 1960s and it was taken up again in 1983, when Page and Wootters made a solution based on quantum entanglement. Page and Wootters argued that entanglement can be used to measure time.

In 2013, at the Istituto Nazionale di Ricerca Metrologica (INRIM) in Turin, Italy, researchers performed the first experimental test of Page and Wootters' ideas. Their result has been interpreted to confirm that time is an emergent phenomenon for internal observers but absent for external observers of the universe just as the Wheeler-DeWitt equation predicts.

Source for the arrow of time

Physicist Seth Lloyd says that quantum uncertainty gives rise to entanglement, the putative source of the arrow of time. According to Lloyd; "The arrow of time is an arrow of increasing correlations." The approach to entanglement would be from the perspective of the causal arrow of time, with the assumption that the cause of the measurement of one particle determines the effect of the result of the other particle's measurement.

Emergent gravity

Based on AdS/CFT correspondence, Mark Van Raamsdonk suggested that spacetime arises as an emergent phenomenon of the quantum degrees of freedom that are entangled and live in the boundary of the space-time. Induced gravity can emerge from the entanglement first law.

Non-locality and entanglement

In the media and popular science, quantum non-locality is often portrayed as being equivalent to entanglement. While this is true for pure bipartite quantum states, in general entanglement is only necessary for non-local correlations, but there exist mixed entangled states that do not produce such correlations. A well-known example is the Werner states that are entangled for certain values of , but can always be described using local hidden variables. Moreover, it was shown that, for arbitrary numbers of parties, there exist states that are genuinely entangled but admit a local model. The mentioned proofs about the existence of local models assume that there is only one copy of the quantum state available at a time. If the parties are allowed to perform local measurements on many copies of such states, then many apparently local states (e.g., the qubit Werner states) can no longer be described by a local model. This is, in particular, true for all distillable states. However, it remains an open question whether all entangled states become non-local given sufficiently many copies.

In short, entanglement of a state shared by two parties is necessary but not sufficient for that state to be non-local. It is important to recognize that entanglement is more commonly viewed as an algebraic concept, noted for being a prerequisite to non-locality as well as to quantum teleportation and to superdense coding, whereas non-locality is defined according to experimental statistics and is much more involved with the foundations and interpretations of quantum mechanics.

Climate effects of particulates and aerosols

From Wikipedia, the free encyclopedia

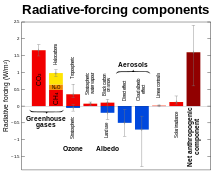
2005 radiative forcings and uncertainties as estimated by the IPCC.
 
Atmospheric aerosols affect the climate of the earth by changing the amount of incoming solar radiation and outgoing terrestrial longwave radiation retained in the earth's system. This occurs through several distinct mechanisms which are split into direct, indirect and semi-direct aerosol effects. The aerosol climate effects are the biggest source of uncertainty in future climate predictions. The Intergovernmental Panel on Climate Change, Third Assessment Report, says: While the radiative forcing due to greenhouse gases may be determined to a reasonably high degree of accuracy... the uncertainties relating to aerosol radiative forcings remain large, and rely to a large extent on the estimates from global modelling studies that are difficult to verify at the present time.

Aerosol radiative effects

Global aerosol optical thickness. The aerosol scale (yellow to dark reddish-brown) indicates the relative amount of particles that absorb sunlight.

Direct effect

Particulates in the air causing shades of grey and pink in Mumbai during sunset
 
The direct aerosol effect consists of any direct interaction of radiation with atmospheric aerosols, such as absorption or scattering. It affects both short and longwave radiation to produce a net negative radiative forcing. The magnitude of the resultant radiative forcing due to the direct effect of an aerosol is dependent on the albedo of the underlying surface, as this affects the net amount of radiation absorbed or scattered to space. e.g. if a highly scattering aerosol is above a surface of low albedo it has a greater radiative forcing than if it was above a surface of high albedo. The converse is true of absorbing aerosol, with the greatest radiative forcing arising from a highly absorbing aerosol over a surface of high albedo. The direct aerosol effect is a first order effect and is therefore classified as a radiative forcing by the IPCC. The interaction of an aerosol with radiation is quantified by the single-scattering albedo (SSA), the ratio of scattering alone to scattering plus absorption (extinction) of radiation by a particle. The SSA tends to unity if scattering dominates, with relatively little absorption, and decreases as absorption increases, becoming zero for infinite absorption. For example, the sea-salt aerosol has an SSA of 1, as a sea-salt particle only scatters, whereas soot has an SSA of 0.23, showing that it is a major atmospheric aerosol absorber.

Indirect effect

The Indirect aerosol effect consists of any change to the earth's radiative budget due to the modification of clouds by atmospheric aerosols, and consists of several distinct effects. Cloud droplets form onto pre-existing aerosol particles, known as cloud condensation nuclei (CCN). 

For any given meteorological conditions, an increase in CCN leads to an increase in the number of cloud droplets. This leads to more scattering of shortwave radiation i.e. an increase in the albedo of the cloud, known as the Cloud albedo effect, First indirect effect or Twomey effect. Evidence supporting the cloud albedo effect has been observed from the effects of ship exhaust plumes and biomass burning on cloud albedo compared to ambient clouds. The Cloud albedo aerosol effect is a first order effect and therefore classified as a radiative forcing by the IPCC.

An increase in cloud droplet number due to the introduction of aerosol acts to reduce the cloud droplet size, as the same amount of water is divided into more droplets. This has the effect of suppressing precipitation, increasing the cloud lifetime, known as the cloud lifetime aerosol effect, second indirect effect or Albrecht effect. This has been observed as the suppression of drizzle in ship exhaust plume compared to ambient clouds, and inhibited precipitation in biomass burning plumes. This cloud lifetime effect is classified as a climate feedback (rather than a radiative forcing) by the IPCC due to the interdependence between it and the hydrological cycle. However, it has previously been classified as a negative radiative forcing.

Semi-direct effect

The Semi-direct effect concerns any radiative effect caused by absorbing atmospheric aerosol such as soot, apart from direct scattering and absorption, which is classified as the direct effect. It encompasses many individual mechanisms, and in general is more poorly defined and understood than the direct and indirect aerosol effects. For instance, if absorbing aerosols are present in a layer aloft in the atmosphere, they can heat surrounding air which inhibits the condensation of water vapour, resulting in less cloud formation. Additionally, heating a layer of the atmosphere relative to the surface results in a more stable atmosphere due to the inhibition of atmospheric convection. This inhibits the convective uplift of moisture, which in turn reduces cloud formation. The heating of the atmosphere aloft also leads to a cooling of the surface, resulting in less evaporation of surface water. The effects described here all lead to a reduction in cloud cover i.e. an increase in planetary albedo. The semi-direct effect classified as a climate feedback) by the IPCC due to the interdependence between it and the hydrological cycle. However, it has previously been classified as a negative radiative forcing.

Roles of different aerosol species

Sulfate aerosol

Sulfate aerosol has two main effects, direct and indirect. The direct effect, via albedo, is a cooling effect that slows the overall rate of global warming: the IPCC's best estimate of the radiative forcing is −0.4 watts per square meter with a range of −0.2 to −0.8 W/m² but there are substantial uncertainties. The effect varies strongly geographically, with most cooling believed to be at and downwind of major industrial centres. Modern climate models addressing the attribution of recent climate change take into account sulfate forcing, which appears to account (at least partly) for the slight drop in global temperature in the middle of the 20th century. The indirect effect (via the aerosol acting as cloud condensation nuclei, CCN, and thereby modifying the cloud properties -albedo and lifetime-) is more uncertain but is believed to be a cooling.

Black carbon

Black carbon (BC), or carbon black, or elemental carbon (EC), often called soot, is composed of pure carbon clusters, skeleton balls and buckyballs, and is one of the most important absorbing aerosol species in the atmosphere. It should be distinguished from organic carbon (OC): clustered or aggregated organic molecules on their own or permeating an EC buckyball. BC from fossil fuels is estimated by the IPCC in the Fourth Assessment Report of the IPCC, 4AR, to contribute a global mean radiative forcing of +0.2 W/m² (was +0.1 W/m² in the Second Assessment Report of the IPCC, SAR), with a range +0.1 to +0.4 W/m². Bond et al., however, states that "the best estimate for the industrial-era (1750 to 2005) direct radiative forcing of atmospheric black carbon is +0.71 W/m² with 90% uncertainty bounds of (+0.08, +1.27) W/m²" with "total direct forcing by all black carbon sources, without subtracting the preindustrial background, is estimated as +0.88 (+0.17, +1.48) W/m²"

Instances of aerosol affecting climate

Solar radiation reduction due to volcanic eruptions
 
Volcanoes are a large natural source of aerosol and have been linked to changes in the earth's climate often with consequences for the human population. Eruptions linked to changes in climate include the 1600 eruption of Huaynaputina which was linked to the Russian famine of 1601 - 1603, leading to the deaths of two million, and the 1991 eruption of Mount Pinatubo which caused a global cooling of approximately 0.5 °C lasting several years. Research tracking the effect of light-scattering aerosols in the stratosphere during 2000 and 2010 and comparing its pattern to volcanic activity show a close correlation. Simulations of the effect of anthropogenic particles showed little influence at present levels.

Aerosols are also thought to affect weather and climate on a regional scale. The failure of the Indian Monsoon has been linked to the suppression of evaporation of water from the Indian Ocean due to the semi-direct effect of anthropogenic aerosol.

Recent studies of the Sahel drought and major increases since 1967 in rainfall over the Northern Territory, Kimberley, Pilbara and around the Nullarbor Plain have led some scientists to conclude that the aerosol haze over South and East Asia has been steadily shifting tropical rainfall in both hemispheres southward.

The latest studies of severe rainfall decline over southern Australia since 1997 have led climatologists there to consider the possibility that these Asian aerosols have shifted not only tropical but also midlatitude systems southward.

Saturday, September 7, 2019

SN 1987A

From Wikipedia, the free encyclopedia
 
SN 1987A
Eso0708a.jpg
Supernova 1987A is the bright star at the centre of the image, near the Tarantula nebula.
Other designationsSN 1987A, AAVSO 0534-69
Event typeSupernova edit this on wikidata
Spectral classType II (peculiar)
DateFebruary 24, 1987 (23:00 UTC) Las Campanas Observatory
ConstellationDorado
Right ascension 05h 35m 28.03s
Declination−69° 16′ 11.79″
EpochJ2000
Galactic coordinatesG279.7-31.9
Distance51.4 kpc (168,000 ly)
HostLarge Magellanic Cloud
ProgenitorSanduleak -69 202
Progenitor typeB3 supergiant
Colour (B-V)+0.085
Notable featuresClosest recorded supernova since invention of telescope
Peak apparent magnitude+2.9

SN 1987A was a type II supernova in the Large Magellanic Cloud, a dwarf galaxy satellite of the Milky Way. It occurred approximately 51.4 kiloparsecs (168,000 light-years) from Earth and was the closest observed supernova since Kepler's Supernova, visible from earth in 1604. 1987A's light reached Earth on February 23, 1987, and as the earliest supernova discovered that year, was labeled "1987A". Its brightness peaked in May, with an apparent magnitude of about 3.

It was the first supernova that modern astronomers were able to study in great detail, and its observations have provided much insight into core-collapse supernovae.

SN 1987A provided the first opportunity to confirm by direct observation the radioactive source of the energy for visible light emissions, by detecting predicted gamma-ray line radiation from two of its abundant radioactive nuclei. This proved the radioactive nature of the long-duration post-explosion glow of supernovae.

Discovery

SN 1987A within the Large Magellanic Cloud
 
SN 1987A was discovered independently by Ian Shelton and Oscar Duhalde at the Las Campanas Observatory in Chile on February 24, 1987, and within the same 24 hours by Albert Jones in New Zealand. On March 4–12, 1987, it was observed from space by Astron, the largest ultraviolet space telescope of that time.

Progenitor

The remnant of SN 1987A

Four days after the event was recorded, the progenitor star was tentatively identified as Sanduleak −69 202 (Sk -69 202), a blue supergiant. After the supernova faded, that identification was definitely confirmed by Sk −69 202 having disappeared. This was an unexpected identification, because models of high mass stellar evolution at the time did not predict that blue supergiants are susceptible to a supernova event. 

Some models of the progenitor attributed the color to its chemical composition rather than its evolutionary state, particularly the low levels of heavy elements, among other factors. There was some speculation that the star might have merged with a companion star before the supernova. However, it is now widely understood that blue supergiants are natural progenitors of some supernovae, although there is still speculation that the evolution of such stars could require mass loss involving a binary companion.

Neutrino emissions

Remnant of SN 1987A seen in light overlays of different spectra. ALMA data (radio, in red) shows newly formed dust in the center of the remnant. Hubble (visible, in green) and Chandra (X-ray, in blue) data show the expanding shock wave.
 
Approximately two to three hours before the visible light from SN 1987A reached Earth, a burst of neutrinos was observed at three neutrino observatories. This was likely due to neutrino emission, which occurs simultaneously with core collapse, but before visible light was emitted. Visible light is transmitted only after the shock wave reaches the stellar surface. At 07:35 UT, Kamiokande II detected 12 antineutrinos; IMB, 8 antineutrinos; and Baksan, 5 antineutrinos; in a burst lasting less than 13 seconds. Approximately three hours earlier, the Mont Blanc liquid scintillator detected a five-neutrino burst, but this is generally not believed to be associated with SN 1987A.

The Kamiokande II detection, which at 12 neutrinos had the largest sample population, showed the neutrinos arriving in two distinct pulses. The first pulse started at 07:35:35 and comprised 9 neutrinos, all of which arrived over a period of 1.915 seconds. A second pulse of three neutrinos arrived between 9.219 and 12.439 seconds after the first neutrino was detected, for a pulse duration of 3.220 seconds.

Although only 25 neutrinos were detected during the event, it was a significant increase from the previously observed background level. This was the first time neutrinos known to be emitted from a supernova had been observed directly, which marked the beginning of neutrino astronomy. The observations were consistent with theoretical supernova models in which 99% of the energy of the collapse is radiated away in the form of neutrinos. The observations are also consistent with the models' estimates of a total neutrino count of 1058 with a total energy of 1046 joules, i.e. a mean value of some dozens of MeV per neutrino.

The neutrino measurements allowed upper bounds on neutrino mass and charge, as well as the number of flavors of neutrinos and other properties. For example, the data show that within 5% confidence, the rest mass of the electron neutrino is at most 16 eV/c2, 1/30,000 the mass of an electron. The data suggest that the total number of neutrino flavors is at most 8 but other observations and experiments give tighter estimates. Many of these results have since been confirmed or tightened by other neutrino experiments such as more careful analysis of solar neutrinos and atmospheric neutrinos as well as experiments with artificial neutrino sources.

Missing neutron star

The bright ring around the central region of the exploded star is composed of ejected material.
 
SN 1987A appears to be a core-collapse supernova, which should result in a neutron star given the size of the original star. The neutrino data indicate that a compact object did form at the star's core. However, since the supernova first became visible, astronomers have been searching for the collapsed core but have not detected it. The Hubble Space Telescope has taken images of the supernova regularly since August 1990, but, so far, the images have shown no evidence of a neutron star. A number of possibilities for the 'missing' neutron star are being considered. The first is that the neutron star is enshrouded in dense dust clouds so that it cannot be seen. Another is that a pulsar was formed, but with either an unusually large or small magnetic field. It is also possible that large amounts of material fell back on the neutron star, so that it further collapsed into a black hole. Neutron stars and black holes often give off light as material falls onto them. If there is a compact object in the supernova remnant, but no material to fall onto it, it would be very dim and could therefore avoid detection. Other scenarios have also been considered, such as whether the collapsed core became a quark star.

Light curve

Much of the light curve, or graph of luminosity as a function of time, after the explosion of a type II supernova such as SN 1987A is provided its energy by radioactive decay. Although the luminous emission consists of optical photons, it is the radioactive power absorbed that keeps the remnant hot enough to radiate light. Without radioactive heat it would quickly dim. The radioactive decay of 56Ni through its daughters 56Co to 56Fe produces gamma-ray photons that are absorbed and dominate the heating and thus the luminosity of the ejecta at intermediate times (several weeks) to late times (several months). Energy for the peak of the light curve of SN1987A was provided by the decay of 56Ni to 56Co (half life of 6 days) while energy for the later light curve in particular fit very closely with the 77.3-day half-life of 56Co decaying to 56Fe. Later measurements by space gamma-ray telescopes of the small fraction of the 56Co and 57Co gamma rays that escaped the SN1987A remnant without absorption confirmed earlier predictions that those two radioactive nuclei were the power source.

Because the 56Co in SN1987A has now completely decayed, it no longer supports the luminosity of the SN 1987A ejecta. That is currently powered by the radioactive decay of 44Ti with a half life of about 60 years. With this change, X-rays produced by the ring interactions of the ejecta began to contribute significantly to the total light curve. This was noticed by the Hubble Space Telescope as a steady increase in luminosity 10,000 days after the event in the blue and red spectral bands. X-ray lines 44Ti observed by the INTEGRAL space X-ray telescope showed that the total mass of radioactive 44Ti synthesized during the explosion was 3.1 ± 0.8×10⁻⁴ M.

Observations of the radioactive power from their decays in the 1987A light curve have measured accurate total masses of the 56Ni, 57Ni, and 44Ti created in the explosion, which agree with the masses measured by gamma-ray line space telescopes and provides nucleosynthesis constraints on the computed supernova model.

Interaction with circumstellar material

The expanding ring-shaped remnant of SN 1987A and its interaction with its surroundings, seen in X-ray and visible light.
 
Sequence of HST images from 1994 to 2009, showing the collision of the expanding remnant with a ring of material ejected by the progenitor 20,000 years before the supernova
 
The three bright rings around SN 1987A that were visible after a few months in images by the Hubble Space Telescope are material from the stellar wind of the progenitor. These rings were ionized by the ultraviolet flash from the supernova explosion, and consequently began emitting in various emission lines. These rings did not "turn on" until several months after the supernova; the turn-on process can be very accurately studied through spectroscopy. The rings are large enough that their angular size can be measured accurately: the inner ring is 0.808 arcseconds in radius. The time light traveled to light up the inner ring gives its radius of 0.66 (ly) light years. Using this as the base of a right angle triangle and the angular size as seen from the Earth for the local angle, one can use basic trigonometry to calculate the distance to SN 1987A, which is about 168,000 light-years. The material from the explosion is catching up with the material expelled during both its red and blue supergiant phases and heating it, so we observe ring structures about the star.

Around 2001, the expanding (>7000 km/s) supernova ejecta collided with the inner ring. This caused its heating and the generation of x-rays—the x-ray flux from the ring increased by a factor of three between 2001 and 2009. A part of the x-ray radiation, which is absorbed by the dense ejecta close to the center, is responsible for a comparable increase in the optical flux from the supernova remnant in 2001–2009. This increase of the brightness of the remnant reversed the trend observed before 2001, when the optical flux was decreasing due to the decaying of 44Ti isotope.

A study reported in June 2015, using images from the Hubble Space Telescope and the Very Large Telescope taken between 1994 and 2014, shows that the emissions from the clumps of matter making up the rings are fading as the clumps are destroyed by the shock wave. It is predicted the ring will fade away between 2020 and 2030. These findings are also supported by the results of a three-dimensional hydrodynamic model which describes the interaction of the blast wave with the circumstellar nebula. The model also shows that X-ray emission from ejecta heated up by the shock will be dominant very soon, after the ring will fade away. As the shock wave passes the circumstellar ring it will trace the history of mass loss of the supernova's progenitor and provide useful information for discriminating among various models for the progenitor of SN 1987A.

In 2018, radio observations from the interaction between the circumstellar ring of dust and the shockwave has confirmed the shockwave has now left the circumstellar material. It also shows that the speed of the shockwave, which slowed down to 2,300 km/s while interacting with the dust in the ring, has now re-accelerated to 3,600 km/s.

Condensation of warm dust in the ejecta

Images of the SN 1987A debris obtained with the instruments T-ReCS at the 8-m Gemini telescope and VISIR at one of the four VLT. Dates are indicated. An HST image is inserted at the bottom right (credits Patrice Bouchet, CEA-Saclay)
 
Soon after the SN 1987A outburst, three major groups embarked in a photometric monitoring of the supernova: SAAO, CTIO, and ESO. In particular, the ESO team reported an infrared excess which became apparent beginning less than one month after the explosion (March 11, 1987). Three possible interpretations for it were discussed in this work: the infrared echo hypothesis was discarded, and thermal emission from dust that could have condensed in the ejecta was favoured (in which case the estimated temperature at that epoch was ~ 1250 K, and the dust mass was approximately 6.6×10⁻⁷ M). The possibility that the IR excess could be produced by optically thick free-free emission seemed unlikely because the luminosity in UV photons needed to keep the envelope ionized was much larger than what was available, but it was not ruled out in view of the eventuality of electron scattering, which had not been considered. 

However, none of these three groups had sufficiently convincing proofs to claim for a dusty ejecta on the basis of an IR excess alone. 

Distribution of the dust inside the SN 1987A ejecta, as from the Lucy et al.'s model built at ESO
 
An independent Australian team advanced several argument in favour of an echo interpretation. This seemingly straightforward interpretation of the nature of the IR emission was challenged by the ESO group and definitively ruled out after presenting optical evidence for the presence of dust in the SN ejecta. To discriminate between the two interpretations, they considered the implication of the presence of an echoing dust cloud on the optical light curve, and on the existence of diffuse optical emission around the SN. They concluded that the expected optical echo from the cloud should be resolvable, and could be very bright with an integrated visual brightness of magnitude 10.3 around day 650. However, further optical observations, as expressed in SN light curve, showed no inflection in the light curve at the predicted level. Finally, the ESO team presented a convincing clumpy model for dust condensation in the ejecta.

Although it had been thought more than 50 years ago that dust could form in the ejecta of a core-collapse supernova, which in particular could explain the origin of the dust seen in young galaxies, that was the first time that such a condensation was observed. If SN 1987A is a typical representative of its class then the derived mass of the warm dust formed in the debris of core collapse supernovae is not sufficient to account for all the dust observed in the early universe. However, a much larger reservoir of ~0.25 solar mass of colder dust (at ~26 K) in the ejecta of SN 1987A was found with the Hershel infrared space telescope in 2011 and confirmed by ALMA later on (in 2014).

ALMA observations

Following the confirmation of a large amount of cold dust in the ejecta, ALMA has continued observing SN 1987A. Synchrotron radiation due to shock interaction in the equatorial ring has been measured. Cold (20–100K) carbon monoxide (CO) and silicate molecules (SiO) were observed. The data show that CO and SiO distributions are clumpy, and that different nucleosynthesis products (C, O and Si) are located in different places of the ejecta, indicating the footprints of the stellar interior at the time of the explosion.

Significant other

From Wikipedia, the free encyclopedia https://en.wikipedia.org/wiki/Sig...