A water molecule,
a commonly used example of polarity. Two charges are present with a
negative charge in the middle (red shade), and a positive charge at the
ends (blue shade).
Polar molecules must contain polar bonds due to a difference in electronegativity between the bonded atoms. A polar molecule with two or more polar bonds must have a geometry which is asymmetric in at least one direction, so that the bond dipoles do not cancel each other.
In a molecule of hydrogen fluoride (HF), the more electronegative atom (fluorine)
is shown in yellow. Because the electrons spend more time by the
fluorine atom in the H−F bond, the red represents partially negatively
charged regions, while blue represents partially positively charged
regions.
Not all atoms attract electrons with the same force. The amount of "pull" an atom exerts on its electrons is called its electronegativity. Atoms with high electronegativities – such as fluorine, oxygen, and nitrogen – exert a greater pull on electrons than atoms with lower electronegativities such as alkali metals and alkaline earth metals.
In a bond, this leads to unequal sharing of electrons between the
atoms, as electrons will be drawn closer to the atom with the higher
electronegativity.
Because electrons have a negative charge, the unequal sharing of electrons within a bond leads to the formation of an electric dipole:
a separation of positive and negative electric charge. Because the
amount of charge separated in such dipoles is usually smaller than a fundamental charge, they are called partial charges, denoted as δ+ (delta plus) and δ− (delta minus). These symbols were introduced by Sir Christopher Ingold and Dr. Edith Hilda (Usherwood) Ingold in 1926. The bond dipole moment is calculated by multiplying the amount of charge separated and the distance between the charges.
Bonds
can fall between one of two extremes – being completely nonpolar or
completely polar. A completely nonpolar bond occurs when the
electronegativities are identical and therefore possess a difference of
zero. A completely polar bond is more correctly called an ionic bond,
and occurs when the difference between electronegativities is large
enough that one atom actually takes an electron from the other. The
terms "polar" and "nonpolar" are usually applied to covalent bonds,
that is, bonds where the polarity is not complete. To determine the
polarity of a covalent bond using numerical means, the difference
between the electronegativity of the atoms is used.
Bond polarity is typically divided into three groups that are
loosely based on the difference in electronegativity between the two
bonded atoms. According to the Pauling scale:
Nonpolar bonds generally occur when the difference in electronegativity between the two atoms is less than 0.5
Polar bonds generally occur when the difference in electronegativity between the two atoms is roughly between 0.5 and 2.0
Ionic bonds generally occur when the difference in electronegativity between the two atoms is greater than 2.0
Pauling based this classification scheme on the partial ionic character
of a bond, which is an approximate function of the difference in
electronegativity between the two bonded atoms. He estimated that a
difference of 1.7 corresponds to 50% ionic character, so that a greater
difference corresponds to a bond which is predominantly ionic.
As a quantum-mechanical description, Pauling proposed that the wave function for a polar molecule AB is a linear combination of wave functions for covalent and ionic molecules: ψ = aψ(A:B) + bψ(A+B−). The amount of covalent and ionic character depends on the values of the squared coefficients a2 and b2.
Polarity of molecules
While the molecules can be described as "polar covalent", "nonpolar
covalent", or "ionic", this is often a relative term, with one molecule
simply being more polar or more nonpolar than another. However, the following properties are typical of such molecules.
A molecule is composed of one or more chemical bonds between molecular orbitals of different atoms. A molecule may be polar either as a result of polar bonds due to differences in electronegativity
as described above, or as a result of an asymmetric arrangement of
nonpolar covalent bonds and non-bonding pairs of electrons known as a
full molecular orbital.
Polar molecules
The
water molecule is made up of oxygen and hydrogen, with respective
electronegativities of 3.44 and 2.20. The electronegativity difference
polarizes each H–O bond, shifting its electrons towards the oxygen
(illustrated by red arrows). These effects add as vectors to make the
overall molecule polar.
A polar molecule has a net dipole
as a result of the opposing charges (i.e. having partial positive and
partial negative charges) from polar bonds arranged asymmetrically. Water (H2O)
is an example of a polar molecule since it has a slight positive charge
on one side and a slight negative charge on the other. The dipoles do
not cancel out, resulting in a net dipole. Due to the polar nature of
the water molecule itself, other polar molecules are generally able to
dissolve in water. In liquid water, molecules possess a distribution of
dipole moments (range ≈ 1.9 - 3.1 D (Debye)) due to the variety of hydrogen-bonded environments. Other examples include sugars (like sucrose), which have many polar oxygen–hydrogen (−OH) groups and are overall highly polar.
If the bond dipole moments of the molecule do not cancel, the molecule is polar. For example, the water molecule (H2O) contains two polar O−H bonds in a bent (nonlinear) geometry. The bond dipole moments do not cancel, so that the molecule forms a molecular dipole
with its negative pole at the oxygen and its positive pole midway
between the two hydrogen atoms. In the figure each bond joins the
central O atom with a negative charge (red) to an H atom with a positive
charge (blue).
The hydrogen fluoride,
HF, molecule is polar by virtue of polar covalent bonds – in the
covalent bond electrons are displaced toward the more electronegative
fluorine atom.
The ammonia molecule, NH3, is polar as a result of its molecular geometry. The red represents partially negatively charged regions.
Ammonia, NH3,
molecule the three N−H bonds have only a slight polarity (toward the
more electronegative nitrogen atom). The molecule has two lone
electrons in an orbital, that points towards the fourth apex of the
approximate tetrahedron, (VSEPR).
This orbital is not participating in covalent bonding; it is
electron-rich, which results in a powerful dipole across the whole
ammonia molecule.
In ozone (O3)
molecules, the two O−O bonds are nonpolar (there is no
electronegativity difference between atoms of the same element).
However, the distribution of other electrons is uneven – since the
central atom has to share electrons with two other atoms, but each of
the outer atoms has to share electrons with only one other atom, the
central atom is more deprived of electrons than the others (the central
atom has a formal charge of +1, while the outer atoms each have a formal charge of −1⁄2). Since the molecule has a bent geometry, the result is a dipole across the whole ozone molecule.
When comparing a polar and nonpolar molecule with similar molar
masses, the polar molecule in general has a higher boiling point,
because the dipole–dipole interaction between polar molecules results in
stronger intermolecular attractions. One common form of polar
interaction is the hydrogen bond,
which is also known as the H-bond. For example, water forms H-bonds and
has a molar mass M = 18 and a boiling point of +100 °C, compared to
nonpolar methane with M = 16 and a boiling point of –161 °C.
Nonpolar molecules
A
molecule may be nonpolar either when there is an equal sharing of
electrons between the two atoms of a diatomic molecule or because of the
symmetrical arrangement of polar bonds in a more complex molecule. For
example, boron trifluoride (BF3) has a trigonal planar arrangement of three polar bonds at 120°. This results in no overall dipole in the molecule.
In a molecule of boron trifluoride, the trigonal planar arrangement of three polar bonds results in no overall dipole.
Carbon dioxide has two polar C-O bonds in a linear geometry.
Carbon dioxide (CO2) has two polar C=O bonds, but the geometry of CO2 is linear so that the two bond dipole moments cancel and there is no net molecular dipole moment; the molecule is nonpolar.
In methane, the bonds are arranged symmetrically (in a tetrahedral arrangement) so there is no overall dipole.
Examples of household nonpolar compounds include fats, oil, and petrol/gasoline. Most nonpolar molecules are water-insoluble (hydrophobic) at room temperature. Many nonpolar organic solvents, such as turpentine, are able to dissolve non-polar substances.
In the methane molecule (CH4)
the four C−H bonds are arranged tetrahedrally around the carbon atom.
Each bond has polarity (though not very strong). The bonds are arranged
symmetrically so there is no overall dipole in the molecule. The
diatomic oxygen molecule (O2) does not have polarity in the covalent bond because of equal electronegativity, hence there is no polarity in the molecule.
Amphiphilic molecules
Large molecules that have one end with polar groups attached and another end with nonpolar groups are described as amphiphiles or amphiphilic molecules. They are good surfactants
and can aid in the formation of stable emulsions, or blends, of water
and fats. Surfactants reduce the interfacial tension between oil and
water by adsorbing at the liquid–liquid interface.
This amphiphilic molecule has several polar groups (hydrophilic, water-loving) on the right side and a long nonpolar chain (lipophilic, fat-loving) at the left side. This gives it surfactant properties
A micelle – the lipophilic ends of the surfactant molecules dissolve in the oil, while the hydrophilic charged ends remain outside in the water phase, shielding the rest of the hydrophobic micelle. In this way, the small oil droplet becomes water-soluble.
Phospholipids are effective natural surfactants that have important biological functions
Cross section view of the structures that can be formed by phospholipids. They can form a micelle and are vital in forming cell membranes
Determining the point group
is a useful way to predict polarity of a molecule. In general, a
molecule will not possess dipole moment if the individual bond dipole
moments of the molecule cancel each other out. This is because dipole
moments are euclidean vector quantities with magnitude and direction, and a two equal vectors who oppose each other will cancel out.
Any molecule with a centre of inversion ("i") or a horizontal mirror plane ("σh") will not possess dipole moments.
Likewise, a molecule with more than one Cn axis of rotation will not possess a dipole moment because dipole moments cannot lie in more than one dimension. As a consequence of that constraint, all molecules with dihedral symmetry (Dn) will not have a dipole moment because, by definition, D point groups have two or multiple Cn axes.
Since C1, Cs,C∞h Cn and Cnvpoint groups do not have a centre of inversion, horizontal mirror planes or multiple Cn axis, molecules in one of those point groups will have dipole moment.
Electrical deflection of water
Contrary
to popular misconception, the electrical deflection of a stream of
water from a charged object is not based on polarity. The deflection
occurs because of electrically charged droplets in the stream, which the
charged object induces. A stream of water can also be deflected in a
uniform electrical field, which cannot exert force on polar molecules.
Additionally, after a stream of water is grounded, it can no longer be
deflected. Weak deflection is even possible for nonpolar liquids.
Tracks of North Atlantic tropical cyclones (1851–2012)
An Atlantic hurricane or tropical storm is a tropical cyclone that forms in the Atlantic Ocean, usually between the months of June and November. A hurricane differs from a cyclone or typhoon only on the basis of location. A hurricane is a storm that occurs in the Atlantic Ocean and northeastern Pacific Ocean, a typhoon occurs in the northwestern Pacific Ocean, and a cyclone occurs in the south Pacific or Indian Ocean.
Tropical cyclones can be categorized by intensity. Tropical storms have one-minute maximum sustained winds of at least 39 mph (34 knots, 17 m/s, 63 km/h), while hurricanes have one-minute maximum sustained winds exceeding 74 mph (64 knots, 33 m/s, 119 km/h). Most North Atlantic tropical storms and hurricanes form between June 1 and November 30. The United StatesNational Hurricane Center monitors the basin and issues reports, watches, and warnings about tropical weather systems for the North Atlantic Basin as one of the Regional Specialized Meteorological Centers for tropical cyclones, as defined by the World Meteorological Organization.
In recent times, tropical disturbances that reach tropical storm intensity are named from a predetermined list. Hurricanes that result in significant damage or casualties may have their names retired from the list at the request of the affected nations in order to prevent confusion should a subsequent storm be given the same name.
On average, in the North Atlantic basin (from 1966 to 2009) 11.3 named
storms occur each season, with an average of 6.2 becoming hurricanes
and 2.3 becoming major hurricanes (Category 3 or greater). The climatological peak of activity is around September 10 each season.
In March 2004, Catarina was the first hurricane-intensity tropical cyclone ever recorded in the Southern Atlantic Ocean. Since 2011, the Brazilian Navy Hydrographic Center
has started to use the same scale of the North Atlantic Ocean for
tropical cyclones in the South Atlantic Ocean and assign names to those
which reach 35 kn (65 km/h; 40 mph).
Steering factors
The
subtropical ridge (in the Pacific) shows up as a large area of black
(dryness) on this water vapor satellite image from September 2000
Tropical cyclones are steered by the surrounding flow throughout the depth of the troposphere (the atmosphere from the surface to about eight miles (12 km) high). Neil Frank, former director of the United StatesNational Hurricane Center,
used the analogies such as "a leaf carried along in a stream" or a
"brick moving through a river of air" to describe the way atmospheric
flow affects the path of a hurricane across the ocean. Specifically, air
flow around high pressure systems and toward low pressure areas influences hurricane tracks.
In the tropical latitudes, tropical storms and hurricanes generally move westward with a slight tendency toward the north, under the influence of the subtropical ridge, a high pressure system that usually extends east-west across the subtropics.
South of the subtropical ridge, surface easterly winds (blowing from
east to west) prevail. If the subtropical ridge is weakened by an upper
trough, a tropical cyclone may turn poleward and then recurve,
or curve back toward the northeast into the main belt of the
Westerlies. Poleward (north) of the subtropical ridge, westerly winds
prevail and generally steer tropical cyclones that reach northern
latitudes toward the east. The westerlies also steer extratropical cyclones with their cold and warm fronts from west to east.
Generally speaking, the intensity of a tropical cyclone is determined by either the storm's maximum sustained winds or lowest barometric pressure.
The following table lists the most intense Atlantic hurricanes in terms
of their lowest barometric pressure. In terms of wind speed, Hurricane Allen (in 1980)
was the strongest Atlantic tropical cyclone on record, with maximum
sustained winds of 190 mph (305 km/h). However, these measurements are
suspect since instrumentation used to document wind speeds at the time
would likely succumb to winds of such intensity. Nonetheless, their central pressures are low enough to rank them among the strongest recorded Atlantic hurricanes.
Owing to their intensity, the strongest Atlantic hurricanes have all attained Category 5 classification. Hurricane Opal, the strongest Category 4 hurricane recorded, intensified to reach a minimum pressure of 916 mbar (hPa; 27.05 inHg), a pressure typical of Category 5 hurricanes. Nonetheless, the pressure remains too high to list Opal as one of the ten strongest Atlantic tropical cyclones. Presently, Hurricane Wilma is the strongest Atlantic hurricane ever recorded, after reaching an intensity of 882 mbar (hPa; 26.05 inHg) in October 2005; this also made Wilma the strongest tropical cyclone worldwide outside of the West Pacific, where seven tropical cyclones have been recorded to intensify to lower pressures. However, this was later superseded by Hurricane Patricia in 2015 in the east Pacific, which had a pressure reading of 872 mbar. Preceding Wilma is Hurricane Gilbert, which had also held the record for most intense Atlantic hurricane for 17 years. The 1935 Labor Day hurricane,
with a pressure of 892 mbar (hPa; 26.34 inHg), is the third strongest
Atlantic hurricane and the strongest documented tropical cyclone prior
to 1950. Since the measurements taken during Wilma and Gilbert were documented using dropsonde, this pressure remains the lowest measured over land.
Hurricane Rita
is the fourth strongest Atlantic hurricane in terms of barometric
pressure and one of three tropical cyclones from 2005 on the list, with
the others being Wilma and Katrina at first and seventh respectively. However, with a barometric pressure of 895 mbar (hPa; 26.43 inHg), Rita is the strongest tropical cyclone ever recorded in the Gulf of Mexico. Mitch and Dean share intensities for the eighth strongest Atlantic hurricane at 905 mbar (hPa; 26.73 inHg). The tenth place for most intense Atlantic tropical cyclone is Hurricane Maria listed to have deepened to a pressure as low as 908 mbar (hPa; 26.81 inHg).
Many of the strongest recorded tropical cyclones weakened prior to their eventual landfall
or demise. However, three of the storms remained intense enough at
landfall to be considered some of the strongest landfalling hurricanes –
three of the eleven hurricanes on the list constitute the three most
intense Atlantic landfalls in recorded history. The 1935 Labor Day
hurricane made landfall at peak intensity, making it the most intense
Atlantic landfall. Though it weakened slightly before its eventual
landfall on the Yucatán Peninsula,
Hurricane Gilbert maintained a pressure of 900 mbar (hPa; 26.58 inHg)
at landfall, as did Camille, making their landfalls tied as the second
strongest. Similarly, Hurricane Dean made landfall on the peninsula,
though it did so at peak intensity and with a higher barometric
pressure; its landfall marked the fourth strongest in Atlantic hurricane
history.
Climatology
Total and Average Number of Tropical Storms by Month (1851–2017)
Month
Total
Average per year
January — April
7
<0 .05="" font="">
May
22
0.1
June
92
0.5
July
120
0.7
August
389
2.3
September
584
3.5
October
341
2.0
November
91
0.5
December
17
0.1
Source: NOAA FAQ
Climatology
does serve to characterize the general properties of an average season
and can be used as one of many other tools for making forecasts. Most
storms form in warm waters several hundred miles north of the equator near the Intertropical convergence zone from tropical waves. The Coriolis force is usually too weak to initiate sufficient rotation near the equator. Storms frequently form in the warm waters of the Gulf of Mexico, the Caribbean Sea, and the tropical Atlantic Ocean as far east as the Cape Verde Islands, the origin of strong and long-lasting Cape Verde-type hurricanes. Systems may also strengthen over the Gulf Stream off the coast of the eastern United States, wherever water temperatures exceed 26.5 °C (79.7 °F).
Although most storms are found within tropical latitudes,
occasionally storms will form further north and east from disturbances
other than tropical waves such as cold fronts and upper-level lows. These are known as baroclinically induced tropical cyclones. There is a strong correlation between Atlantic hurricane activity in the tropics and the presence of an El Niño or La Niña in the Pacific Ocean.
El Niño events increase the wind shear over the Atlantic, producing a
less-favorable environment for formation and decreasing tropical
activity in the Atlantic basin. Conversely, La Niña causes an increase
in activity due to a decrease in wind shear.
According to the Azores High hypothesis by Kam-biu Liu, an anti-phase pattern is expected to exist between the Gulf of Mexico coast and the North American Atlantic coast.
During the quiescent periods (3000–1400 BC, and 1000 AD to present), a
more northeasterly position of the Azores High would result in more
hurricanes being steered toward the Atlantic coast. During the
hyperactive period (1400 BC to 1000 AD), more hurricanes were steered
towards the Gulf coast as the Azores High was shifted to a more
southwesterly position near the Caribbean.
Such a displacement of the Azores High is consistent with paleoclimatic
evidence that shows an abrupt onset of a drier climate in Haiti around 3200 14C years BP, and a change towards more humid conditions in the Great Plains during the late-Holocene as more moisture was pumped up the Mississippi Valley
through the Gulf coast. Preliminary data from the northern Atlantic
coast seem to support the Azores High hypothesis. A 3000-year proxy
record from a coastal lake in Cape Cod
suggests that hurricane activity has increased significantly during the
past 500–1000 years, just as the Gulf coast was amid a quiescent period
of the last millennium.
Seasonal variation
Climatologically speaking, approximately 97 percent of tropical cyclones that form in the North Atlantic develop
between the dates of June 1 and November 30 – dates which delimit the
modern-day Atlantic hurricane season. Though the beginning of the annual
hurricane season has historically remained the same, the official end
of the hurricane season has shifted from its initial date of October 31.
Regardless, on average once every few years a tropical cyclone develops
outside the limits of the season;
as of January 2016 there have been 68 tropical cyclones in the
off-season, with the most recent being Subtropical Storm Andrea in 2019. The first tropical cyclone of the 1938 Atlantic hurricane season, which formed on January 3, became the earliest forming tropical storm and hurricane after reanalysis concluded on the storm in December 2012.
Hurricane Able in 1951 was initially thought to be the earliest forming major hurricane – a tropical cyclone with winds exceeding 115 mph (185 km/h) – however following post-storm analysis it was determined that Able only reached Category 1 strength which made Hurricane Alma of 1966 the new record holder; as it became a major hurricane on June 8. Though it developed within the bounds of the Atlantic hurricane season, Hurricane Audrey in 1957 became the earliest developing Category 4 hurricane on record after it reached the intensity on June 27.
However, reanalysis from 1956 to 1960 by NOAA downgraded Audrey to a
Category 3, making Hurricane Dennis of 2005 the earliest Category 4 on
record on July 8, 2005. The earliest-forming Category 5 hurricane, Emily, reached the highest intensity on the Saffir–Simpson hurricane wind scale on July 17, 2005.
Though the official end of the Atlantic hurricane season occurs
on November 30, the dates of October 31 and November 15 have also
historically marked the official end date for the hurricane season. December, the only month of the year after the hurricane season, has featured the cyclogenesis of fourteen tropical cyclones. Tropical Storm Zeta in 2005 was the latest tropical cyclone to attain tropical storm intensity as it did so on December 30. However, the second Hurricane Alice in 1954
was the latest forming tropical cyclone to attain hurricane intensity.
Both Zeta and Alice were the only two storms to exist in two calendar
years – the former from 1954 to 1955 and the latter from 2005 to 2006. No storms have been recorded to exceed Category 1 hurricane intensity in December. In 1999, Hurricane Lenny
reached Category 4 intensity on November 17 as it took an unprecedented
west to east track across the Caribbean; its intensity made it the
latest developing Category 4 hurricane, though this was well within the
bounds of the hurricane season. Hurricane Hattie (October 27 – November 1, 1961) was initially thought to have been the latest forming Category 5 hurricane ever documented, though reanalysis indicated that a devastating hurricane in 1932 reached such an intensity at a later date.
Consequently, this made the hurricane the latest developing tropical
cyclone to reach all four Saffir–Simpson hurricane wind scale
classifications past Category 1 intensity.
June
Typical locations and tracks of tropical systems in June; blue is likely, green more likely, and orange most likely
The beginning of the hurricane season is most closely related to the timing of increases in sea surface temperatures, convective instability, and other thermodynamic factors.
Although June marks the beginning of the hurricane season, generally
little activity occurs during the month with an average of 1 tropical cyclone every 2 years. Tropical systems usually form in the Gulf of Mexico or off the east coast of the United States.
Since 1851, a total of 81 tropical storms and hurricanes formed
in the month of June. During this period, two of these systems developed
in the deep tropics east of the Lesser Antilles. Since 1870, three major hurricanes have formed during June, most notably Hurricane Audrey in 1957.
Audrey attained an intensity greater than that of any Atlantic tropical
cyclone during June or July until Hurricanes Dennis and Emily of 2005. The easternmost forming storm during June, Tropical Storm Ana in 1979, formed at 45°W.
July
Typical locations and tracks in July
Not much tropical activity occurs during the month of July, but the majority of hurricane seasons see the formation of one tropical cyclone
during July. From an average of Atlantic tropical cyclone seasons from
1944 to 1996, the first tropical storm in half of the seasons occurred
by 11 July, and a second formed by 8 August.
Formation usually occurs in the eastern Caribbean Sea around the Lesser Antilles, in the northern and eastern parts of the Gulf of Mexico, in the vicinity of the northern Bahamas, and off the coast of The Carolinas and Virginia over the Gulf Stream. Storms travel westward through the Caribbean and then either move towards the north and curve near the eastern coast of the United States or stay on a north-westward track and enter the Gulf of Mexico.
Since 1851, a total of 105 tropical storms have formed during the month of July. Since 1870, ten of these storms reached major hurricane intensity. Only Hurricane Emily of 2005,
the strongest July tropical cyclone in the Atlantic basin, attained
Category 5 hurricane status during July, making it the earliest Category
5 hurricane on record. The easternmost forming storm and longest lived during the month of July, Hurricane Bertha in 2008, formed at 22.9°W and lasted 17 days.
August
Typical locations and tracks in August
Decrease in wind shear from July to August contributes to a significant increase of tropical activity.
An average of 2.8 Atlantic tropical storms develop annually in August.
On average, four named tropical storms, including one hurricane, occur
by August 30, and the first intense hurricane develops by 4 September.
September
Typical locations and tracks in September
The peak of the hurricane season occurs in September and corresponds with low wind shear and the warmest sea surface temperatures.
The month of September sees an average of 3 storms a year. By 24
September, the average Atlantic season features 7 named tropical storms,
including 4 hurricanes. In addition, two major hurricanes occur on
average by 28 September. Relatively few tropical cyclones make landfall
at these intensities.
October
Typical locations and tracks in October.
The favorable conditions found during September begin to decay in
October. The main reason for the decrease in activity is increasing wind shear, although sea surface temperatures are also cooler than in September. Activity falls markedly with 1.8 cyclones developing on average despite a climatological secondary peak around 20 October.
By 21 October, the average season features 9 named storms with 5
hurricanes. A third major hurricane occurs after 28 September in half of
all Atlantic tropical cyclone seasons.
In contrast to mid-season activity, the mean locus of formation shifts
westward to the Caribbean and Gulf of Mexico, reversing the eastward
progression of June through August.
November
Typical locations and tracks in November.
Wind shear from westerlies increases substantially through November, generally preventing cyclone formation.
On average, one tropical storm forms during every other November. On
rare occasions, a major hurricane occurs. The few intense hurricanes in
November include Hurricane "Cuba" in late October and early November 1932 (the strongest November hurricane on record peaking as a Category 5 hurricane), Hurricane Lenny in mid-November 1999, Hurricane Kate in late November 1985 which was the latest major hurricane formation on record until Hurricane Otto (a category 3 storm) of the 2016 hurricane season. Hurricane Paloma was a very potent category 4 storm that made landfall in Cuba in early November 2008.
December to May
Probability of a tropical cyclone of tropical storm or hurricane strength at a specific date, expressed as systems per 100 years
Although the hurricane season is defined as beginning on June 1 and
ending on November 30, there have been several off-season storms.
Since 1870, there have been 32 off-season cyclones, 18 of which
occurred in May. In the same time span, nine storms formed in December,
two in April, and one each in January, February and March. During four years (1887, 1953, 2003, and 2007), tropical cyclones formed in the North Atlantic Ocean both during or before May and during December. In 1887, four storms occurred outside the season, the most in a single year. High vertical wind shear and low sea surface temperatures generally preclude tropical cyclone formation during the off-season.
Tropical cyclones have formed in all months.
Four tropical cyclones existed during the month of January, two of
which formed during late December: the second Hurricane Alice in
1954/1955, and Tropical Storm Zeta in 2005/2006. The only two hurricanes to form in January are a Category 1 hurricane in the 1938 season, and Hurricane Alex in the 2016 season. A subtropical storm in January also began the 1978 Atlantic hurricane season. No major hurricanes have occurred in the off-season.
Extremes
Hurricane Katrina was the costliest and one of the five deadliest hurricanes in the history of the United States.
Hurricane Harvey was also the costliest hurricane in the history of the United States, causing historic and catastrophic flooding in Texas.
The season in which the most tropical storms formed on record was the 2005 Atlantic hurricane season (28). That season was also the one in which the most hurricanes formed on record (15).
The least active season on record since 1946 (when the database is considered more reliable) was the 1983 Atlantic hurricane season, with four tropical storms, two hurricanes, and one major hurricane. Overall, the 1914 Atlantic hurricane season remains the least active, with only one documented storm.
The most intense hurricane (by barometric pressure) on record in the North Atlantic basin was Hurricane Wilma (2005) (882 mbar).
The largest hurricane (in gale diameter) on record to form in the North Atlantic was Hurricane Sandy (2012) with a gale diameter of 1,100 miles (1,800 km).
The longest-lasting hurricane was the 1899 San Ciriaco hurricane, which lasted for 27 days and 18 hours as a tropical cyclone.
The longest-tracked hurricane was Hurricane Faith, which traveled for 6,850 miles (11,020 km) as a tropical cyclone. Faith is also the northernmost moving tropical cyclone in the Atlantic basin.
The deadliest hurricane to make landfall on the continental United States was the Galveston Hurricane in 1900 which may have killed up to 12,000 people.
The most damaging hurricane was both Hurricane Katrina and Hurricane Harvey of the 2005 and 2017 seasons, respectively, both of which caused $125 billion in damages in their respective years. However, when adjusted for inflation, Katrina is the costliest with $161 billion.
The quickest forming hurricane was Hurricane Humberto
in 2007. It was a minimal hurricane that formed and intensified faster
than any other tropical cyclone on record before landfall. Developing on
September 12, 2007, in the northwestern Gulf of Mexico, the cyclone
rapidly strengthened and struck High Island, Texas, with winds of about
90 mph (150 km/h) early on September 13.
While the number of storms in the Atlantic has increased since 1995,
there is no obvious global trend. The annual number of tropical cyclones
worldwide remains about 87 ± 10. However, the ability of climatologists
to make long-term data analysis in certain basins is limited by the
lack of reliable historical data in some basins, primarily in the
Southern Hemisphere. In spite of that, there is some evidence that the intensity of hurricanes is increasing. In 2006, Kerry Emanuel
stated, "Records of hurricane activity worldwide show an upswing of
both the maximum wind speed in and the duration of hurricanes. The
energy released by the average hurricane (again considering all
hurricanes worldwide) seems to have increased by around 70% in the past
30 years or so, corresponding to about a 15% increase in the maximum
wind speed and a 60% increase in storm lifetime."
At the time, Emanuel theorized that increased heat from global warming
was driving this trend, however, some argue that Emanuel's own research
in 2008 refuted this theory. Others contend that the trend does not
exist at all, but instead is a figment created by faulty readings from
primitive 1970s-era measurement equipment.
Vecchi and Knutson (2008) found a weakly positive, although not
statistically-significant trend in the number of North Atlantic tropical
cyclones for 1878–2006, but also a surprisingly strong decrease in
cyclone duration over this period.
On May 15, 2014, the journal Nature
published a peer-reviewed submission from October 2013 by James P.
Kossin, Kerry A. Emanuel, and Gabriel A. Vecchi that suggests that a
poleward migration exists for the paths of maximum intensity of tropical
cyclone activity in the Atlantic.
The focus of the report is on the latitude at which recent tropical
cyclones in the Atlantic are reaching maximum intensity. Their data
indicates that during the past thirty years, the peak intensity of these
storms has shifted poleward in both hemispheres at a rate of
approximately 60 km per decade, amounting to approximately one degree of
latitude per decade.
Atlantic storms are becoming more destructive financially, since five of the ten most expensive storms in United States history have occurred since 1990. According to the World Meteorological Organization,
“recent increase in societal impact from tropical cyclones has largely
been caused by rising concentrations of population and infrastructure in
coastal regions.” Pielke et al.
(2008) normalized mainland U.S. hurricane damage from 1900–2005 to 2005
values and found no remaining trend of increasing absolute damage. The
1970s and 1980s were notable because of the extremely low amounts of
damage compared to other decades. The decade 1996–2005 has the second
most damage among the past 11 decades, with only the decade 1926–1935
surpassing its costs. The most damaging single storm is the 1926 Miami hurricane, with $157 billion of normalized damage.
Often in part because of the threat of hurricanes, many coastal
regions had sparse population between major ports until the advent of
automobile tourism; therefore, the most severe portions of hurricanes
striking the coast may have gone unmeasured in some instances. The
combined effects of ship destruction and remote landfall severely limit
the number of intense hurricanes in the official record before the era
of hurricane reconnaissance aircraft and satellite meteorology. Although
the record shows a distinct increase in the number and strength of
intense hurricanes, therefore, experts regard the early data as suspect. Christopher Landseaet al.
estimated an undercount bias of zero to six tropical cyclones per year
between 1851 and 1885 and zero to four per year between 1886 and 1910.
These undercounts roughly take into account the typical size of tropical
cyclones, the density of shipping tracks over the Atlantic basin, and
the amount of populated coastline.
The number and strength of Atlantic hurricanes may undergo a 50–70 year cycle, also known as the Atlantic Multidecadal Oscillation. Nyberg et al.
reconstructed Atlantic major hurricane activity back to the early
eighteenth century and found five periods averaging 3–5 major hurricanes
per year and lasting 40–60 years, and six other averaging 1.5–2.5 major
hurricanes per year and lasting 10–20 years. These periods are
associated with the Atlantic multidecadal oscillation. Throughout, a
decadal oscillation related to solar irradiance was responsible for
enhancing/dampening the number of major hurricanes by 1–2 per year.
Although more uncommon since 1995, few above-normal hurricane seasons occurred during 1970–94.
Destructive hurricanes struck frequently from 1926–60, including many
major New England hurricanes. Twenty-one Atlantic tropical storms formed
in 1933, a record only recently exceeded in 2005,
which saw 28 storms. Tropical hurricanes occurred infrequently during
the seasons of 1900–25; however, many intense storms formed during
1870–99. During the 1887 season,
19 tropical storms formed, of which a record 4 occurred after November 1
and 11 strengthened into hurricanes. Few hurricanes occurred in the
1840s to 1860s; however, many struck in the early 19th century,
including an 1821 storm that made a direct hit on New York City. Some historical weather experts say these storms may have been as high as Category 4 in strength.
These active hurricane seasons predated satellite coverage of the
Atlantic basin. Before the satellite era began in 1960, tropical storms
or hurricanes went undetected unless a reconnaissance aircraft
encountered one, a ship reported a voyage through the storm, or a storm
landed in a populated area.
The official record, therefore, could miss storms in which no ship
experienced gale-force winds, recognized it as a tropical storm (as
opposed to a high-latitude extra-tropical cyclone, a tropical wave, or a
brief squall), returned to port, and reported the experience.
Proxy records based on paleotempestological research have revealed that major hurricane activity along the Gulf of Mexico coast varies on timescales of centuries to millennia.
Few major hurricanes struck the Gulf coast during 3000–1400 BC and
again during the most recent millennium. These quiescent intervals were
separated by a hyperactive period during 1400 BC and 1000 AD, when the
Gulf coast was struck frequently by catastrophic hurricanes and their
landfall probabilities increased by 3–5 times. This millennial-scale
variability has been attributed to long-term shifts in the position of
the Azores High, which may also be linked to changes in the strength of the North Atlantic Oscillation.
According to the Azores High hypothesis, an anti-phase pattern is
expected to exist between the Gulf of Mexico coast and the Atlantic
coast. During the quiescent periods, a more northeasterly position of
the Azores High would result in more hurricanes being steered towards
the Atlantic coast. During the hyperactive period, more hurricanes were
steered towards the Gulf coast as the Azores High was shifted to a more
southwesterly position near the Caribbean. Such a displacement of the
Azores High is consistent with paleoclimatic evidence that shows an
abrupt onset of a drier climate in Haiti around 3200 14C years BP, and a change towards more humid conditions in the Great Plains during the late-Holocene as more moisture was pumped up the Mississippi Valley
through the Gulf coast. Preliminary data from the northern Atlantic
coast seem to support the Azores High hypothesis. A 3,000-year proxy
record from a coastal lake in Cape Cod
suggests that hurricane activity increased significantly during the
past 500–1000 years, just as the Gulf Coast was amid a quiescent period
during the last millennium. Evidence also shows that the average
latitude of hurricane impacts has been steadily shifting northward,
towards the Eastern Seaboard over the past few centuries. This change has been sped up in modern times due to the Arctic Ocean heating up especially much from fossil fuel-caused global warming.


 This amphiphilic molecule has several polar groups (hydrophilic, water-loving) on the right side and a long nonpolar chain (lipophilic, fat-loving) at the left side. This gives it surfactant properties
 A micelle – the lipophilic ends of the surfactant molecules dissolve in the oil, while the hydrophilic charged ends remain outside in the water phase, shielding the rest of the hydrophobic micelle. In this way, the small oil droplet becomes water-soluble.
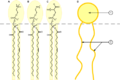 Phospholipids are effective natural surfactants that have important biological functions
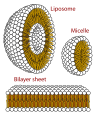 Cross section view of the structures that can be formed by phospholipids. They can form a micelle and are vital in forming cell membranes


