
United States projected Köppen climate classification map for 2071 to 2100
_(PNG).png)
U.S. temperature record from 1950 to 2009 according to the National Oceanic and Atmospheric Administration (NOAA)
Climate change in the United States refers to historical changes in the climate of the United States, as well as the regional climactic, economic, and cultural responses to global warming.
The current effects of global warming in the United States are
widespread and varied. In 2012, the United States experienced its
warmest year on record. As of 2012, the thirteen warmest years for the entire planet have all occurred since 1998, transcending those from 1880. Different regions experience widely different climatic changes. Changes in climate in the regions of the United States appear significant. For example, drought conditions appear to be worsening in the southwest while improving in the northeast. Some research has warned against possible problems due to American climate changes such as the spread of invasive species and possibilities of floods as well as droughts.[4] Climate change is seen as a national security threat to the United States.
The United States is among the most significant emitters of greenhouse gasses in the world. In terms of both total and per capita emissions, it is among the largest contributors.
As of April 2019, 69% of Americans think that climate change is happening and 55% think that it is mostly human caused.
In 2015, according to The New York Times and others, oil companies knew that burning oil and gas could cause global warming since the 1970s but, nonetheless, funded deniers for years. 2016 was a historic year for billion-dollar weather and climate disasters in U.S.
Greenhouse gas emissions by the United States
The United States emitted 5.4 billion metric tons carbon dioxide equivalent of greenhouse gas in 2018, the second largest in the world after greenhouse gas emissions by China. This is over 15 tonnes per person and, amongst the top ten emitters, is the second highest country by greenhouse gas emissions per person after Canada. Because coal-fired power stations are gradually shutting down, in the 2010s emissions from electricity generation fell to second place behind transportation.
Current and potential effects of climate change in the United States
The United States Environmental Protection Agency's (EPA) website provides information on climate change: EPA Climate Change.
Climate change is a problem that is affecting people and the
environment. Human-induced climate change has, e.g., the potential to
alter the prevalence and severity of extreme weathers such as heat waves, cold waves, storms, floods and droughts.[] A report released in March 2012 by the Intergovernmental Panel on Climate Change
(IPCC) confirmed that a strong body of evidence links global warming to
an increase in heat waves, a rise in episodes of heavy rainfall and
other precipitation, and more frequent coastal flooding.[15][16] The U.S. had its warmest March–May on record in 2012.[17] (See March 2012 North American heat wave)
According to the American government's Climate Change Science Program,
"With continued global warming, heat waves and heavy downpours are very
likely to further increase in frequency and intensity. Substantial
areas of North America are likely to have more frequent droughts of
greater severity. Hurricane wind speeds, rainfall intensity, and storm
surge levels are likely to increase. The strongest cold season storms
are likely to become more frequent, with stronger winds and more extreme
wave heights."[18]
National temperature, sea level, and precipitation

This
graph shows average drought conditions in the contiguous 48 states,
according to the EPA, with yearly data going from 1895 to 2011. The
curve is a nine-year weighted average.
The general effect of climate changes has been found in the journal Nature Climate Change to have caused increased likelihood of heat waves and extensive downpours.[19] Concerns exist that, as stated by a National Institutes of Health
(NIH) study in 2003, increasing "heat and humidity, at least partially
related to anthropogenic climate change, suggest that a long-term
increase in heat-related mortality could occur." However, the report
found that, in general, "over the past 35 years, the U.S. populace has
become systematically less affected by hot and humid weather conditions"
while "mortality during heat stress events has declined despite
increasingly stressful weather conditions in many urban and suburban
areas." Thus, as stated in the study, "there is no simple association
between increased heat wave duration or intensity and higher mortality
rates" with current death rates being largely preventable, the NIH
deeply urging American public health officials and physicians to inform patients about mitigating heat-related weather and climate effects on their bodies.[20]
In terms of U.S. droughts, a study published in Geophysical Research Letters
in 2006 about the U.S. reported, "Droughts have, for the most part,
become shorter, less frequent, and cover a smaller portion of the
country over the last century." It also stated that the "main exception
is the Southwest and parts of the interior of the West" where "drought
duration and severity... have increased."[3]
Sea level rise has taken place in the U.S. for decades, going back to the 19th century. As stated in research published by the Proceedings of the National Academy of Sciences,
west coast sea levels have increased by an average of 2.1 millimeters
annually. In English notation, that equates to 0.083 inches per year and
0.83 inches per decade.[21]
As shown in the adjacent image, wet and rainy conditions versus
moments of drought in the U.S. have varied significantly over the past
several decades. Average conditions for the 48 contiguous states flashed
into extreme drought in the mid-1930s 'dust bowl'
era as well as during the turn of the 20th century. In comparison, the
mid-2000s decade and mid-1890s experienced only slight drought and had
mitigating rainy periods.[22]
The National Drought Mitigation Center has reported that financial
assistance from the government alone in the 1930s dry period may have
been as high as $1 billion (in 1930s dollars) by the end of the drought.[23]
Climate scientists have hypothesized that the stratospheric polar vortex jet stream will gradually weaken as a result of global warming and thus influence U.S. conditions.[24][25][26] This trend could possibly cause changes in the future such as increasing frost in certain areas. The magazine Scientific American noted in December 2014 that ice cover on the Great Lakes had recently "reached its second-greatest extent on record", showing climate variability.[25]
In July 2012, the National Oceanic and Atmospheric Administration
(NOAA) reported that the 12-month period July 2011 to June 2012 was the
warmest 12-month period on record in the continental United States,
with average temperature 3.23 °F above the average for the 20th century.[27]
Earlier it was reported that exceptionally warm months between January
and May 2012 had made the 12 month previous to June 2012 the warmest
12-month block since record keeping began,[28]
but this record was exceeded by the July 2011 to June 2012 period. NOAA
stated that the odds of the July 2011 to June 2012 high temperatures
occurring randomly was 1 in 1,594,323.[27]
Other effects of both general climatic change and man-made
climate change combine with the temperature precipitation effects of
climate change to exacerbate conditions.
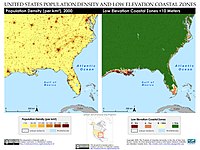
Locations in the US with low altitude above sealevel
 Western United States
 San Francisco
 Southeastern United States
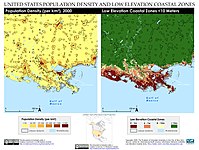 New Orleans
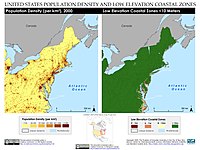 Northeastern United States
 Washington D.C.
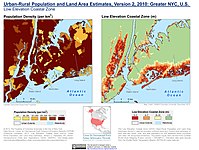 New York City
 Boston
.jpg)
.jpg)
.jpg)
.jpg)
.jpg)
.jpg)
.jpg)
.jpg)
Extreme weather events

Warmer
air can contain more water vapor than cooler air. Global analyses show
that the amount of water vapor in the atmosphere has in fact increased
due to human-caused warming. This extra moisture is available to storm
systems, resulting in heavier rainfalls.
The number and severity of high-cost extreme weather events has
increased in the 21st century in the United States. By August 2011
alone, the NOAA had registered nine distinct extreme weather
disasters for that year, each totalling $1 billion or more in economic
losses. Total losses for 2011 were evaluated as more than $35 billion
before Hurricane Irene.[29]
Though the costs and frequency of cyclones have increased on the
east coast, it remains unclear whether these effects have been driven
primarily by climate change.[19][30] When correcting for this, a comprehensive 2006 article in Geophysical Research Letters
found "no significant change in global net tropical cyclone activity"
during past decades, a period when considerable warming of ocean water
temperatures occurred. However, the study found major regional shifts,
including a general rise of activity in the North Atlantic area, including on the U.S. eastern coast.[31]
From 1898 through 1913, there have been 27 cold waves
which totalled 58 days. Between 1970 and 1989, there were about 12 such
events. From 1989 until January 6, 2014, there were none. The one on
the latter date caused consternation because of decreased frequency of
such experiences.[32]
Looking at the lack of certainty as to the causes of the 1995 to
present increase in Atlantic extreme storm activity, a 2007 article in Nature
used proxy records of vertical wind shear and sea surface temperature
to create a long-term model. The authors found that "the average
frequency of major hurricanes decreased gradually from the 1760s until
the early 1990s, reaching anomalously low values during the 1970s and
1980s." As well, they also found that "hurricane activity since 1995 is
not unusual compared to other periods of high hurricane activity in the
record and thus appears to represent a recovery to normal hurricane
activity, rather than a direct response to increasing sea surface
temperature." The researches stated that future evaluations of climate
change effects should focus on the magnitude of vertical wind shear for
answers.[33]
The frequency of tornadoes in the U.S. have increased, and some
of this trend takes place due to climatological changes though other
factors such as better detection technologies also play large roles.
According to a 2003 study in Climate Research, the total tornado
hazards resulting in injury, death, or economic loss "shows a steady
decline since the 1980s". As well, the authors reported that tornado
"deaths and injuries decreased over the past fifty years". They state
that addition research must look into regional and temporal variability
in the future.[34]
Human effects: health, economy and agriculture
The 2018 the Fourth National Climate Assessment notes that regional economies dominated by agriculture or tourism may have additional vulnerabilities from climate change.[35] Joseph Stiglitz, Nobel prize-winning economist, notes that climate-related disasters in 2017 cost the equivalent of 1.5% of GDP.[36]
Crop and livestock production will be increasingly challenged. Threats to human health will increase.[37]
A 2012 report in Nature Climate Change stated that there
is reason to be concerned that American climate changes could increase
food insecurity by reducing grain yields, with the authors noting as
well that substantial other facts exist influencing food prices as such
as government mandates turning food into fuel
and fluctuating transport costs. The researchers concluded that U.S.
corn price volatility would moderately increase with American warming
with relatively modest rises in food prices assuming that market
competition and integration partly mitigated climate affects. They
warned that biofuels mandates would, if present, widely increase corn price sensitivity to U.S. warming.[38]
Environmental Racism
There is a growing Climate Gap and prevalence of Environmental Racismin
the U.S. Climate change will change the United States' current
systems/opportunities for low paying jobs typically held by BIPOC and
low SES people, such as agriculture and tourism. Job opportunities in
these fields are expected to decrease and become more taxing on workers
due to harsher conditions. Based on a study done on Environmental
inequities in California, people of color and people of low
socioeconomic status populate the cities with the worst air quality in
the state, putting these groups at increased risk for being exposed to
harmful air pollutants. Additionally, many low SES individuals may not
have adequate access to healthcare to rectify their disproportionate
exposure, causing long term health issues. Racialized families spend
higher percentages of their income on basic necessities, and will be
disproportionately challenged by rising food prices and other basic
necessities, further widening the wealth gap between social classes in
the US. One of the most prevalent contributors to health inequity in the food system is climate change.
Higher food prices will continue to contribute to low SES individuals
experiencing an increase in food insecurity, and diets that contribute
to malnutrition and obesity. The food system will also see an increase
in the spread of diseases such as cholera and filariasis.
Based on a study done on California's population, low SES
neighborhoods and neighborhoods occupied by people of color experience
heatwaves more frequently, and they effects there are most harsh due to
being situated in the middle of cities, a phenomenon called the Heat Island Effect.
Additionally, racialized individuals are less likely to have access to
air conditioning and transportation to relief stations, doubling the
African American mortality rate caused by heat waves in Los Angeles.
Policy
Federal, state, and local governments have all debated climate change
policies, but the resulting laws vary considerably. The U.S. Congress
has not adopted a comprehensive greenhouse gas emissions reduction
scheme, but long-standing environmental laws such as the Clean Air Act have been used by the executive branch and litigants in lawsuits to implement regulations and voluntary agreements.
The federal government has the exclusive power to regulate
emissions from motor vehicles, but has granted the state of California a
waiver to adopt more stringent regulations. Other states may choose to
adopt either the federal or California rules. Individual states retain
the power to regulate emissions from electrical generation and
industrial sources, and some have done so. Building codes are
controlled by state and local governments, and in some cases have been
altered to require increased energy efficiency. Governments at all
levels have the option of reducing emissions from their own operations
such as through improvements to buildings, purchasing alternative fuel
vehicles, and reducing waste; and some have done so.
Political opponents to emissions regulations argue that such
measures reduce economic activity in the fossil fuel industry (which is a
substantial extractive industry in the United States), and impose
unwanted costs on drivers, electricity users, and building owners. Some
also argue that stringent environmental regulations infringe on
individual liberty, and that the environmental impact of economic
activity should be driven by the informed choices of consumers.
Regulatory proponents argue that the economy is not a zero-sum game, and
that individual choices have proven insufficient to prevent damaging
and costly levels of global warming. Some states have financed programs
to boost employment in green energy industries, such as production of
wind turbines. Areas heavily dependent on coal production have not
taken such steps and are suffering economic recession due to both
competition from now lower-priced natural gas and environmental rules
that make generation of electricity from coal disadvantageous due to
high emissions of CO2 and other pollutants compared to other fuels.
History of federal policy and international agreements
The United States, although a signatory to the 1997 Kyoto Protocol, under President Clinton, neither ratified nor withdrew from the protocol. In 1997, the U.S. Senate voted unanimously under the Byrd–Hagel Resolution
that it was not the sense of the senate that the United States should
be a signatory to the Kyoto Protocol, and in March 2001, the Bush Administration
announced that it would not implement the treaty, saying it would
create economic setbacks in the U.S. and does not put enough pressure to
limit emissions from developing nations.
In February 2002, Bush announced his alternative to the Kyoto
Protocol, by bringing forth a plan to reduce the intensity of greenhouse
gasses by 18 percent over 10 years. The intensity of greenhouse gasses
specifically is the ratio of greenhouse gas emissions and economic
output, meaning that under this plan, emissions would still continue to
grow, but at a slower pace. Bush stated that this plan would prevent the
release of 500 million metric tons of greenhouse gases, which is about
the equivalent of 70 million cars from the road. This target would
achieve this goal by providing tax credits to businesses that use renewable energy sources.
In 2007, the U.S. Supreme Court ruled in the case Massachusetts v. Environmental Protection Agency that EPA regulation of carbon dioxide is required under the Clean Air Act.
President Barack Obama proposed a cap-and-trade program as part of the 2010 United States federal budget, but this was never adopted by Congress.
President Obama committed in the December 2009 Copenhagen Climate Change Summit
to reduce carbon dioxide emissions in the range of 17% below 2005
levels by 2020, 42% below 2005 levels by 2030, and 83% below 2005 levels
by 2050. Data from an April 2013 report by the Energy Information Administration
(EIA), showed a 12% reduction in the 2005 to 2012 period. Just over
half of this decrease has been attributed to the recession, and the rest
to a variety of factors such as replacing coal-based power generation
with natural gas and increasing energy efficiency of American vehicles
(according to a Council of Economic Advisors analysis). Executive Order 13514
set various requirements for energy efficiency in federal buildings and
operations, including goals for 2015. That year, Executive Order 13693
set requirements for federal operations generally.
In an address to the U.S. Congress
in June 2013, the President detailed a specific action plan to achieve
the 17% carbon emissions cut from 2005 by 2020, including measures such
as shifting from coal-based power generation to solar and natural gas production.
Some Republican and Democratic lawmakers expressed concern at the idea
of imposing new fines and regulations on the coal industry while the
U.S. still tries to recover from the world economic recession, with Speaker of the House John Boehner saying that the proposed rules "will put thousands and thousands of Americans out of work". Christiana Figueres, executive director of the UN's climate secretariat,
praised the plan as providing a vital benchmark that people concerned
with climate change can use as a paragon both at home and abroad.
After not participating in previous climate international treaties, the United States signed the Paris Agreement
on April 22, 2016 during the Obama administration. Though this
agreement does not mandate a specific reduction for any given country,
it sets global goals, asks countries to set their own goals, and
mandates reporting.
The U.S. submitted its action plan in March, 2015, ahead of the treaty signing. Reaffirming the November 2014 announcement it made with China,
the United States declared it would reduce greenhouse gas emissions to
26-28% below 2005 levels by 2025. This is to be accomplished by several
executive actions:
- Clean Power Plan - regulating sources of electricity (put on hold by the Supreme Court in February, 2016, pending the outcome of a lawsuit)
- New emission standards for heavy-duty vehicles, finalized by EPA in March, 2016
- Department of Energy efficiency standards for commercial buildings, appliances, and equipment
- Various actions to reduce emissions of greenhouse gases other than carbon dioxide, including regulation and voluntary efforts related to methane from landfills, agriculture, coal mines; and hydrofluorocarbons (HFCs) reduction through domestic regulation and amendment of the Montreal Protocol
In June 2017, President Donald Trump announced United States withdrawal from the Paris Agreement,
although the exit process specified by the treaty (which Trump said the
U.S. would follow) will last until at least November 4, 2020.
Trump states that dropping out the agreement will create more job
opportunities in the United States, but it may actually have the
opposite effect by stifling the renewable energy industries.
At the same time, Trump administration shut down the United States
Environmental Protection Agency's climate change web pages and removed
mentions of the topic elsewhere on the site.
In April 2018, the Trump administration cancelled NASA's Carbon
Monitoring System (CMS) program, which helped with the monitoring of CO2 emissions and deforestation in the United States and in other countries.
The Trump administration has also moved to increase fossil fuel
consumption and roll back environmental policies that are considered to
be burdensome to businesses.
For offsetting the dismantlement of the Clean Power Plan approximately 10 billion trees would need to be planted. Activists try to plant this number of trees.
In January 2020 Trump announced that the USA would join the Trillion Tree Campaign. Climate activists critiqued the plan for ignoring the root causes of climate change.. House Natural Resources Committee Chairman Raul Grijalva critiqued the plan as “a feel-good participatory gesture” without a broader portfolia of environmental actions surrounding it.
In June 2020, Democrats proposed a plan for climate action in USA
aiming to not sell greenhouse gas emitting cars by 2035, reach zero
emissions from the energy sector by 2040 and reduce to zero all the
greenhouse gas emission of the country by 2050. The plan includes some
actions to improve environmental justice. In 2016, 38% of adults in
United States thought that stopping climate change are a top priority,
in 2020 52% think like that. Many Republicans share this opinion.
Role of the US military
The US military is an unequivocal validator
of climate science, and its current efforts to value true costs and
benefits of energy conservation and increased use of renewables can
serve as drivers of change, according to a 2014 study from the
University of Pennsylvania Legal Studies Department.
A 2014 report described the projected climate change as a “catalyst for conflict”.
The DOD had issued a Fiscal Year 2012 Climate Change Adaptation Roadmap, in which it outlined its vulnerabilities, yet the Government Accountability Office (GAO) found, that installation officials rarely proposed projects with climate change adaptation,
because the processes for approving and funding military construction
do not include climate change adaptation in the ranking criteria for
projects.
State and regional policy
Across the country, regional organizations, states,
and cities are achieving real emissions reductions and gaining valuable
policy experience as they take action on climate change. According to
the report of America's Pledge,
65% of the American population, 51% of the GHG emissions and 68% of the
GDP, are now part of different coalitions that support climate action
and want to fulfill the commitments of USA in the Paris Agreement. The
coalitions include We Are Still In, US Climate Alliance, Climate Mayors and more.
These actions include increasing renewable energy generation, selling agricultural carbon sequestration credits, and encouraging efficient energy use. The U.S. Climate Change Science Program
is a joint program of over twenty U.S. cabinet departments and federal
agencies, all working together to investigate climate change. In June
2008, a report issued by the program stated that weather would become
more extreme, due to climate change.
States and municipalities often function as "policy laboratories",
developing initiatives that serve as models for federal action. This
has been especially true with environmental regulation—most federal
environmental laws have been based on state models. In addition, state
actions can significantly affect emissions, because many individual
states emit high levels of greenhouse gases. Texas, for example, emits
more than France, while California's emissions exceed those of Brazil.
State actions are also important because states have primary
jurisdiction over many areas—such as electric generation, agriculture,
and land use—that are critical to addressing climate change.
Many states are participating in Regional climate change initiatives, such as the Regional Greenhouse Gas Initiative in the northeastern United States, the Western Governors' Association (WGA) Clean and Diversified Energy Initiative, and the Southwest Climate Change Initiative.
Inside the ten northeastern states implementing the Regional Greenhouse Gas Initiative,
carbon dioxide emissions per capita decreased by about 25% from 2000
and 2010, as the state economies continued to grow while enacting
various energy efficiency programs.
Cost and consequences
In
2013 there were 11 weather and climate disaster events with losses over
$1 billion each in the United States. In total these 11 events losses
were over $110 billion. 2013 was the warmest year ever in the contiguous
United States and about one-third of all Americans experienced 10 days
or more of 100-degree heat.
These increasingly common and severe weather events have put
pressure on existing disaster-relief efforts. For instance, the
increasing rate of wildfires, the increasing length of the fire season,
and increasing severity have put pressure on national and international
resources. In the US, federal firefighting efforts surpassed $2 billion a
year for the first time in 2017, and this expense was repeated in 2018.
At the same time, internationally shared capital, such as firefighting
planes, has experienced increasing demand, requiring new investment.
Impact on agriculture
Increasing floods (such as the 2019 Midwestern U.S. floods), heat waves, and droughts have brought economic problems to farmers business and increased product prices.
USDA
research indicates that "climate change is likely to drive down yields
for some crops, harm milk production, and lead to a drop in nutrient
density for key crops like rice and wheat."
Public response
Public opinion about climate change
In April 2019, 69% of Americans thought that climate change is happening and 55% think that it is mostly human caused. In September 2019 approximately 75% thought that climate change is real and man made. In November 2016, 69% of registered voters said that USA should remain in Paris Agreement. 13% said that it should leave the agreement.
Education
At least three US high schools have objected to mention of climate change in 2019 graduation speeches by students.
Political ideologies
Historical support for environmental protection has been relatively non-partisan. Republican Theodore Roosevelt established national parks whereas Democrat Franklin D. Roosevelt established the Soil Conservation Service. This non-partisanship began to change during the 1980s when the Reagan administration stated that environmental protection was an economic burden. Views over global warming began to seriously diverge among Democrats
and Republicans when ratifying the Kyoto Protocol was being debated in
1998. Gaps in opinions among the general public are often amplified
among the political elites, such as members of Congress, who tend to be more polarized. A 2017 study by the Center for American Progress Action Fund of climate change denial in the United States Congress found 180 members who deny the science behind climate change; all were Republicans.
Beyond politicians, there is a variety of views by each political party.
In March 2014, Gallup found that among Democrats, 45% say they worry a
great deal about the quality of the environment while the number drops
to 16% for Republicans.
Political disagreement is also strongly rooted in our potential solutions to addressing climate change. Strategies such as a Cap and Trade system are still a heated argument.
On January 20, 2017, within moments of Donald Trump's
inauguration, all references to climate change were removed from the
White House website. The U.S. has been considered the most authoritative
researcher of this information, and there is concern amongst the
scientific community as to how the Trump administration will prioritize
the issue.
In early indications to news media of the first federal budget
process under Donald Trump's administration, there are signs that most
efforts under the Obama administration to curb U.S. greenhouse gas
emissions would effectively be rolled back.
In July 2018 the Trump Administration released its Draft Environmental Impact Statement from the NHTSA.
In it was the prediction that on our current course the planet will
warm a disastrous seven degrees Fahrenheit (or about 3.9 degrees
Celsius) by the end of this century.
Many pages were created to examine and compare the views of the candidates in the presidential election 2020 on climate change. The League of Conservation Voters create a special site, entirely dedicated to the issue called: "Change the Climate 2020". Similar pages were created in the site of NRDC, Ballotpedia, Boston CBS, the Skimm
Business community
In 2015, according to The New York Times and others, oil companies knew that burning oil and gas could cause global warming since the 1970s but, nonetheless, funded deniers for years.
A review, published in 2016, of academic literature that explores
the potential for greenhouse emissions related liability, calculated
that climate change related liability could reach trillions of dollars
based on lost revenue from nations that would forced to evacuate because
of sea level rise.


