Search This Blog

Friday, February 26, 2021

Societal collapse

From Wikipedia, the free encyclopedia
 
Destruction, from The Course of Empire by Thomas Cole (1836).
 
Desolation, from The Course of Empire by Thomas Cole (1836).

Societal collapse (also known as civilizational collapse) is the fall of a complex human society characterized by the loss of cultural identity and of socioeconomic complexity, the downfall of government, and the rise of violence. Possible causes of a societal collapse include natural catastrophe, war, pestilence, famine, and depopulation. A collapsed society may revert to a more primitive state, be absorbed into a stronger society, or completely disappear.

Virtually all civilizations have suffered this fate regardless of size or complexity. But some revived and transformed, such as China and Egypt, while others never recovered, such as the Mayan Empire and the civilization on Easter Island. Societal collapse is generally a quick process, but rarely abrupt. Yet some have not collapsed but have only gradually faded away, as in the case of the British Empire since 1918.

Anthropologists, (quantitative) historians, and sociologists have proposed a variety of explanations for the collapse of civilizations involving causative factors such as environmental change, depletion of resources, unsustainable complexity, decay of social cohesion, rising inequality, secular decline of cognitive abilities, loss of creativity, and misfortune. However, complete extinction of a culture is rare; in most cases, the new societies that arise from the ashes of the old one are evidently its offspring, despite a dramatic reduction in sophistication. Moreover, the influence of a collapsed society, say that of the (Western) Roman Empire, may linger on long after its death.

The study of societal collapse, collapsology, is a topic for specialists of history, anthropology, sociology, and political science. More recently, they are joined by experts in cliodynamics and study of complex systems.

Concept

Joseph Tainter frames societal collapse in his The Collapse of Complex Societies (1988), which is a seminal and founding work of the academic discipline on societal collapse. He elaborates that 'collapse' is a "broad term," but in the sense of societal collapse he views it as "a political process." He further narrows societal collapse as a rapid process (within "few decades") of "substantial loss of sociopolitical structure," giving the fall of the Western Roman Empire as "the most widely known instance of collapse" in the Western world.

Others, particularly in response to the popular Collapse (2005) by Jared Diamond and more recently, have argued that societies discussed as cases of collapse are better understood through resilience and societal transformation, or "reorganization", especially if collapse is understood as a "complete end" of political systems, which according to Shmuel Eisenstadt has not taken place at any point. Eisenstadt also points out that a clear differentiation between total or partial decline and "possibilities of regeneration" is crucial for the preventive purpose of the study of societal collapse.

Societal longevity

Social scientist Luke Kemp analyzed dozens of civilizations—which he defined as "a society with agriculture, multiple cities, military dominance in its geographical region and a continuous political structure"—from 3000 B.C. to 600 A.D. and calculated that the average life span of a civilization is close to 340 years. Of these, the most durable were the Kushite Kingdom in Northeast Africa (1,150 years), the Aksumite Empire in Africa (1,100 years), and the Vedic Civilization in South Asia and the Olmecs in Mesoamerica (both 1,000 years), while the shortest-lived were the Yuen-Yuen Dynasty (30), the Nanda Empire in India (24), and the Qin Dynasty in China (14).

A statistical analysis of empires by complex systems specialist Samuel Arbesman suggests that collapse is generally a random event and does not depend on age. This is analogous to what evolutionary biologists call the Red Queen Hypothesis, which asserts that for a species in a harsh ecology, extinction is a persistent possibility.

Contemporary discussions about societal collapse are seeking resilience by suggesting societal transformation.

Causes of collapse

Because human societies are complex systems, common factors that may contribute to their decline—economical, environmental, demographic, social and cultural—can cascade into another, building up to the point that could overwhelm any mechanisms that would otherwise maintain stability. Unexpected and abrupt changes, what experts call non-linearities, are some of the danger signs. In some cases a natural disaster (e.g. tsunami, earthquake, pandemic, massive fire or climate change) may precipitate a collapse. Other factors such as a Malthusian catastrophe, overpopulation or resource depletion might be contributory factors of collapse, but studies of past societies seem to suggest they alone were not the causes of collapse. Significant inequity and exposed corruption may combine with lack of loyalty to established political institutions and result in an oppressed lower class rising up and seizing power from a smaller wealthy elite in a revolution. The diversity of forms that societies evolve corresponds to diversity in their failures. Jared Diamond suggests that societies have also collapsed through deforestation, loss of soil fertility, restrictions of trade and/or rising endemic violence.

Any society has periods of prosperity and hardship. But when decline from the height of civilization is so dramatic, one can safely talk about its having collapsed. However, in the case of the Western Roman Empire, some argued that it did not collapse but merely transformed.

Natural disasters and climate change

Archeologists identified signs of a mega-drought for a millennium between 5,000 and 4,000 years ago in Africa and Asia. The drying of the Green Sahara not only turned it into a desert but also disrupted the monsoon seasons in South and Southeast Asia and caused flooding in East Asia, thereby preventing successful harvest and the development of complex culture. It coincided and may have caused the decline and fall of the Akkadian Empire in Mesopotamia and the Indus Valley Civilization. The dramatic shift in climate is known as the 4.2 kiloyear event.

The highly advanced Indus Valley Civilization took roots around 3000 B.C. in what is now Pakistan and collapsed around 1700 B.C. Since the Indus script has yet to be deciphered, the causes of its demise remain a mystery, though there is some evidence pointing to natural disasters. Signs of a gradual decline began to emerge in 1900 B.C., and two centuries later, most of the cities had been abandoned. Archeological evidence suggests an increase in inter-personal violence and in infectious diseases like leprosy and tuberculosis. Historians and archeologists believe that severe and long-lasting drought, and a decline in trade with Egypt and Mesopotamia, caused the collapse of this culture. Evidence for earthquakes has also been discovered. Sea level changes are also found at two possible seaport sites along the Makran coast which are now inland. Earthquakes may have contributed to decline of several sites by direct shaking damage, by sea level change or by change in water supply.

Volcanic eruptions can abruptly influence the climate. During a large eruption, sulfur dioxide (SO2) is expelled into the stratosphere, where it could stay for years and gradually get oxidized into sulfate aerosols. Being highly reflective, sulfate aerosols reduce the incident sunlight and cool the Earth's surface. By drilling into glaciers and ice sheets, scientists can access the archives of the history of atmospheric composition. A team of multidisciplinary researchers led by Joseph McConnell of the Desert Research Institute in Reno, Nevada deduced that a volcanic eruption occurred in 43 B.C., a year after the assassination of Julius Caesar in the Ides of March (March 15) in 44 B.C, which left a power vacuum and led to bloody civil wars. According to historical accounts, this was also a period of poor weather, crop failure, widespread famine, and disease. Analyses of tree rings and cave stalagmites from different parts of the globe provided complementary data. The Northern Hemisphere got drier while the Southern Hemisphere became wetter. Indeed, Greek historian Appian recorded that there was a lack of flooding in Egypt, which also faced famine and pestilence. Rome's interest in Egypt as a source of food intensified, while the aforementioned problems and civil unrest weakened Egypt's ability to resist. It came under Roman rule after Cleopatra's suicide in 30 B.C. While it is difficult to say for certain whether Egypt becoming a Roman province would have happened if Okmok volcano (in modern-day Alaska) had not erupted, the eruption likely hastened the process.

Global average temperatures show that the Little Ice Age was not a distinct planet-wide time period, but the end of a long temperature decline that preceded recent global warming.

More generally, recent research pointed to climate change as a key player in the decline and fall of historical societies in China, the Middle East, Europe, and the Americas. In fact, paleoclimatogical temperature reconstruction suggests that historical periods of social unrest, societal collapse, and population crash and significant climate change often occurred simultaneously. A team of researchers from mainland China and Hong Kong were able to establish a causal connection between climate change and large-scale human crises in pre-industrial times. Short-term crises may be due to social problems, but climate change was the ultimate cause of major crises, starting with economic depressions. Moreover, since agriculture is highly dependent on climate, any changes to the regional climate from the optimum can induce crop failures.

The Mongol conquests corresponded to a period of cooling in the Northern Hemisphere between the thirteenth and fourteenth centuries, when the Medieval Warm Period was giving way to the Little Ice Age, causing ecological stress. In Europe, while the cooling climate did not directly facilitate the Black Death, it did cause wars, mass migration, and famine, making it easier to diseases to spread.

A more recent example is the General Crisis of the Seventeenth Century in Europe, a period of inclement weather, crop failure, economic hardship, extreme inter-group violence, and high mortality. It was due to the Little Ice Age, caused by a period called the Maunder Minimum when sunspots were exceedingly rare. Episodes of social instability track the cooling with a time lap of up to 15 years, and many developed into armed conflicts, such as the Thirty Years' War (1618–1648). It started as a war of succession to the Bohemian throne. Animosity between Protestants and Catholics in the Holy Roman Empire (in modern-day Germany) added fuel to the fire. Soon, it escalated to a huge conflict involving all major European powers that devastated much of Germany. By the war's end, some regions of the Holy Roman Empire saw their population drop by as much as 70%. But not all societies faced crises during this period. Tropical countries with high carrying capacities and trading economies did not suffer much, because changing climate did not induce an economic depression in these places. Moreover, by the mid-eighteenth century, as global temperatures started to rise, the ecological stress faced by Europeans also began to fade. Mortality rates dropped and the level of violence fell, paving the way for a period known as Pax Britannica, which witnessed the emergence of a variety of innovations in technology (which enabled industrialization), medicine (which improved hygiene), and social welfare (such as the world's first welfare programs in Germany), making life even more comfortable.

Foreign invasions and mass migration

A mysterious loose confederation of fierce maritime marauders known as the Sea Peoples was identified as one of the main causes of the Late Bronze Age Collapse in the Eastern Mediterranean. It is possible that the Sea Peoples were themselves victims of the environmental changes that led to widespread famine and precipitated the Collapse. After the Battle of Kadesh against the Egyptians in 1285 B.C., the Hittite Empire began to show signs of decline. Attacks by the Sea Peoples accelerated the process while internal power struggles, crop failures, and famine were contributory factors. The Egyptians, with whom the Hittites signed a peace treaty, supplied them with food in times of famine, but it was not enough. Around 1200 B.C., the Sea Peoples seized a port on the west coast of Asia Minor, cutting off the Hittites from their trade routes from which their supply of grain came. Hattusa the Hittite capital was destroyed. While some Hittite territories survived, these were captured by the Assyrians in the seventh century B.C.

The Minoan Civilization, based on Crete, was based around religious rituals and seaborne trade. In around 1450 B.C., it was absorbed into Mycenaean Greece. Mycenaean Greece itself went into serious decline around 1200 B.C. due to various military conflicts, including the Dorian invasion from the north and attacks from the Sea Peoples.

In the third century B.C., a Eurasian nomadic people called the Xiongnu began threatening China's frontiers, but by the first century B.C., they were completely expelled. They then turned their attention westward and displaced various other tribes in Eastern and Central Europe, leading to a cascade of events. Attila rose to power as leader of the Huns and initiated a campaign of invasions and looting and went as far as Gaul (today's France). Attila's Huns were clashing with the Roman Empire, which had already been divided into two halves for ease of administration: the Eastern Roman Empire and the Western Roman Empire. Despite their decisive victory at the Battle of Chalons in 451 A.D., the Romans were unable to stop Attila from attacking Roman Italy. Northern Italian cities, like Milan, were ravaged. The Huns never posed a threat to the Roman Empire again after Attila's death, but the rise of the Huns also forced the Germanic peoples out of their territories. These groups pressed their way into parts of France, Spain, Italy, and even as far south as North Africa. The city of Rome itself came under attack by the Visigoths in 410 and was plundered by the Vandals in 455. A combination of internal strife, economic weakness, and relentless invasions by the Germanic peoples pushed the Western Roman Empire into terminal decline. The last Western Roman Emperor, Romulus Augustulus, was dethroned in 476 by the German Odoacer, who declared himself King of Italy.

In the eleventh century A.D., North Africa's populous and flourishing civilization collapsed after exhausting its resources in internal fighting and suffering devastation from the invasion of the Bedouin tribes of Banu Sulaym and Banu Hilal. Ibn Khaldun noted that the lands ravaged by Banu Hilal invaders had become completely arid desert.

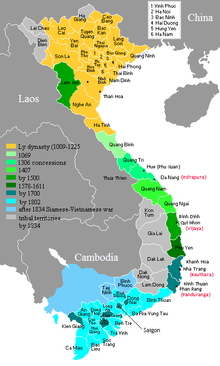
Vietnam under Emperor Minh Mạng, superimposed on modern political maps.

In 1206 a warlord achieved dominance over all Mongols with the title Genghis Khan and began his campaign of territorial expansion. The Mongols' highly flexible and mobile cavalry enabled them to conquer their enemies with efficiency and swiftness. In the brutal pillaging that followed Mongol invasions during the thirteenth and fourteenth centuries, the invaders decimated the populations of China, Russia, the Middle East, and Islamic Central Asia. Later Mongol leaders, such as Timur, destroyed many cities, slaughtered thousands of people and did irreparable damage to the ancient irrigation systems of Mesopotamia. These invasions transformed a settled society to a nomadic one. In China, for example, a combination of war, famine, and pestilence during the Mongol conquests halved the population, a decline of around 55 million people. The Mongols also displaced large numbers of people and created power vacuums. The Khmer Empire went into decline and was replaced by the Thais, who were pushed southward by the Mongols. The Vietnamese, who succeeded in defeating the Mongols, also turned their attention to the south and by 1471, they began subjugating the Chams. When Vietnam's Later Lê Dynasty went into decline in the late 1700s, a bloody civil war erupted between the Trịnh family in the North and the Nguyễn family in the South. More Cham provinces were seized by the Nguyễn warlords. Finally, Nguyễn Ánh emerged victorious and declared himself Emperor of Vietnam (changing the name from Annam) with the title Gia Long and established the Nguyễn Dynasty. The last remaining principality of Champa, Panduranga (modern-day Phan Rang, Vietnam), survived until 1832, when Emperor Minh Mạng (Nguyễn Phúc Đảm) conquered it after the centuries long Cham–Vietnamese wars. Vietnam's policy of assimilation involved the force-feeding of pork to Muslims and beef to Hindus, which fueled resentment. An uprising followed, the first and only war between Vietnam and the jihadists. It was crushed.

Famine, economic depression, and internal strife

In around 1210 B.C., the New Kingdom of Egypt shipped large amounts of grains to the then disintegrating Hittite Empire, meaning there had been a food shortage in Anatolia but not the Nile Valley. But this soon changed. Although Egypt managed to decisively deliver a final defeat to the Sea Peoples at the Battle of Xois, Egypt itself went into steep decline. The collapse of all the other societies of the Eastern Mediterranean disrupted established trade routes and caused widespread economic depression. Government workers went underpaid, which resulted in the first labor dispute in recorded history and undermined royal authority. There was also political infighting between different factions of government. Bad harvest due to reduced flooding at the Nile led to a major famine. Food prices rose up to eight times their normal values, and occasionally even reached twenty-four. Runaway inflation followed. Attacks by the Libyans and Nubians made things even worse. Thus through the course of its rule the Twentieth Dynasty (∼1187–1064 B.C) saw Egypt devolving from a major power in the Mediterranean into a deeply divided and weakened state that later came to be ruled by the Libyans and the Nubians.

The time between 481 B.C. and 221 B.C. was the Period of the Warring States in China, which ended when King Zheng of the Qin Dynasty succeeding in defeating six competing factions, thereby becoming the first Chinese Emperor, titled Qin Shi Huang. A ruthless but efficient ruler, the Emperor raised a disciplined and professional army, and introduced a significant number of reforms, unifying the language, and creating a single currency and system of measurement. In addition, he funded dam constructions and began building the first segment of what was to become the Great Wall of China to defend his realm against northern nomads. However, his empire fell part when he died in 210 B.C. due to internal feuds and rebellions.

In the early fourteenth century A.D., Britain had unusually heavy rainfall, flooding and suffered repeated rounds of crop failures. Much livestock either starved or drowned. Food prices skyrocketed. While King Edward II attempted to rectify the situation by imposing price controls, vendors simply refused to sell at such low prices. In any case, the act was abolished by the Lincoln Parliament in 1316. Soon, people from commoners to nobles were finding themselves short of food. Many resorted to begging, criminality, and eating animals they otherwise would not eat. People in the North of England had to deal with raids from Scotland. There were even reports of cannibalism. In Continental Europe, things were at least just as bad. This Great Famine of 1315–1317 coincided with the end of the Medieval Warm Period and the start of the Little Ice Age. Some historians suspect this change in climate was due to Mount Tarawera in New Zealand erupting in 1314. The Great Famine was, however, only one of the calamities striking Europe that century, as the Hundred Years' War and Black Death were soon to follow. Recent analysis of tree rings complemented historical records: the summers of 1314–16 were some of the wettest on record over a period of 700 years.

Disease outbreaks

The angel of death striking a door during the plague of Rome; engraving by Levasseur after Jules-Elie Delaunay (1828–1891).

Historically, the dawn of agriculture led to the rise of contagious diseases. Compared to their hunting-gathering counterparts, agrarian societies tended to be sedentary and had higher population densities, were in frequent contact with livestock, and were more exposed to contaminated water supplies and higher concentrations of garbage. Poor sanitation, a lack of medical knowledge, superstitions, and sometimes a combination of disasters exacerbated the problem. Journalist Michael Rosenwald wrote, "...history shows that past pandemics have reshaped societies in profound ways. Hundreds of millions of people have died. Empires have fallen. Governments have cracked. Generations have been annihilated."

From the description of symptoms by Greek physician Galen, which included coughing, fever, (blackish) diarrhea, swollen throat, thirstiness, modern experts identified the probable culprits of the Antonine Plague (A.D. 165–180) to be smallpox or measles. The disease likely started in China and spread to the West via the Silk Road. Roman troops first contracted the disease in the East before returning home. Striking a 'virgin population', the Antonine Plague had dreadful mortality rates; between one third to a half of the population, 60 to 70 million people, perished. Roman cities suffered from a combination of overcrowding, poor hygiene, and unhealthy diets. They quickly became epicenters. Soon, the disease reached as far as Gaul and mauled Roman defenses along the Rhine. The ranks of the previously formidable Roman army had to be filled with freed slaves, German mercenaries, criminals, and gladiators. It ultimately failed to prevent the Germanic tribes from crossing the Rhine. On the civilian side, the Antonine Plague created drastic shortages of businessmen, which disrupted trade, and farmers, which led to a food crisis. An economic depression followed and government revenue fell. Some accused Emperor Marcus Aurelius and Co-emperor Lucius Verus, both of whom victims of the disease, of affronting the gods while others blamed Christians. Yet the Antonine Plague strengthened the position of the monotheistic religion of Christianity in a heretofore polytheistic society as Christians won public admiration for their good works. Ultimately it was the Roman army, Roman cities, the size of the empire and its trade routes, without which Roman power and influence would not exist, that facilitated the spread of the disease. The Antonine Plague is considered by some historians as a useful starting point for understanding the decline and fall of the Western Roman Empire. It was followed by the Plague of Cyprian (A.D. 249–262) and the Plague of Justinian (541-542). Together, they cracked the foundations of the Roman Empire.

In the sixth century A.D., while the Western Roman Empire had already succumbed to attacks by the Germanic tribes, the Eastern Empire stood its ground. In fact, thanks to a peace treaty with the Persians, Emperor Justinian the Great was able to concentrate on re-capturing territories belonging to the Western Empire. His generals, Belisarius and Narses, achieved a number of important victories against the Ostrogoths and the Vandals. However, their hope of re-establishing the Roman Empire was dashed by the arrival of what became known as the Plague of Justinian (541-542). According to Byzantine historian Procopius of Caesarea, this epidemic originated in China and Northeastern India and reached the Eastern Roman Empire via trade routes terminating in the Mediterranean. While modern scholarship was able to deduce that it was caused by the bacterium Yersinia pestis, the same one that would later bring the Black Death, the single deadliest pandemic in human history, it remains uncertain how many actually died because of it. Current estimates put the figure between thirty and fifty million people, a significant portion of the human population at that time. The Plague arguably cemented the fate of Rome.

It also devastated the Sassanid Persian Empire. Caliph Abu Bakr seized the opportunity to launch military campaigns that overran the Sassanians and captured Roman-held territories in the Caucasus, the Levant, Egypt, and elsewhere in North Africa. Before the Justinian Plague, the Mediterranean world had been commercially and culturally stable. After the Plague, it fractured into a trio of civilizations battling for power: the Islamic Civilization, the Byzantine Empire, and what became known as Medieval Europe. With so many people dead, the supply of workers, many of whom were slaves, was critically short. Landowners had no choice but to lend pieces of land to serfs who work the land in exchange for military protection and other privileges. Thus sowed the seeds of feudalism.

There is evidence that the Mongol expeditions may have spread the bubonic plague across much of Eurasia, helping to spark the Black Death of the early fourteenth century. Italian historian Gabriele de’ Mussi wrote that the Mongols catapulted the corpses of those who contracted the plague into Caffa (now Feodossia, Crimea) during the siege of that city and how soldiers transported from there brought the plague to Mediterranean ports. However, this account of the origin of the Black Death in Europe remains controversial, though plausible, because the complex epidemiology of the plague. Modern epidemiologists do not believe that the Black Death had a single source of spreading into Europe. Research into the past on this topic is further complicated by politics and the passage of time. It is difficult to distinguish between natural epidemics and biological warfare, both of which are common throughout human history. Biological weapons are economical because they turn an enemy casualty into a delivery system and as such were favored in armed conflicts of the past. Furthermore, more soldiers had died of disease than in combat until recently. In any case, by the 1340s, Europe faced a combination of overpopulation and famine. As a result, many had weakened immune systems, especially those living in squalid conditions. Whatever its origins, the Black Death killed around one third of the population in medieval Europe, or about 200 million people. The widening trade routes in the Late Middle Ages helped the plague spread rapidly. It took the European population more than two centuries to return its level before the pandemic. Consequently, it destabilized most of society, and likely undermined feudalism and the authority of the Church. In parts of England, for example, 80% of the population living in poverty were killed. Economic deprivation and war followed. In England and France, for example, a combination of the plague and the Hundred Years' War killed about half the population.

With labor in short supply, workers' bargaining power increased dramatically. Various inventions that reduced the cost of labor, saved time, and raised productivity–such as the three-field crop rotation system, the iron plow, the use of manure to fertilize the soil, and the water pumps–were widely adopted. Many former serfs, now free from feudal obligations, relocated to the cities and changed profession to crafts and trades. The more successful became the new middle class. Trade flourished as demands for a myriad of consumer goods rose. Society became wealthier and could afford to fund the arts and the sciences. The Black Death marked the end of the Middle Ages in Europe; the Renaissance had begun.

Aztec victims of smallpox, from the Florentine Codex (1540–85)

Encounters between European explorers and the Amerindians exposed the latter to variety of diseases of extraordinary virulence. Having migrated from Northeastern Asia 15,000 years ago, the Amerindians were hitherto not introduced to the plethora of contagious diseases that emerged after the rise of agriculture in the Old World. As such they had immune systems that were ill-equipped to handle the diseases that their counterparts Eurasia had grown resistant to. When the Europeans arrived in the Americas, in short order, the indigenous populations of the Americas found themselves facing smallpox, measles, whooping cough, and the bubonic plague, among others. In tropical areas, malaria, yellow fever, dengue fever, river blindness, and others appeared. Most of these tropical diseases were traced to Africa. Smallpox ravaged Mexico in the 1520s, killing 150,000 in Tenochtitlán alone, including the emperor, and Peru in the 1530s, aiding the European conquerors. A combination of Spanish military attacks and evolutionarily novel diseases finished off the Aztec Empire in the sixteenth century. It is commonly believed that the death of as much as 90% or 95% of the Native American population of the New World was caused by Old World diseases, though new research suggests tuberculosis from seals and sea lions played a significant part.

Similar events took place in Oceania and Madagascar. Smallpox was externally brought to Australia. The first recorded outbreak, in 1789, devastated the Aboriginal population; while the extent of this outbreak is disputed, some sources claim that it killed about 50% of coastal Aboriginal populations on the east coast. There is an ongoing historical debate concerning two rival and irreconcilable theories about how the disease first entered the continent - see History of smallpox. Smallpox continued to be a deadly disease, killing an estimated 300 million people in the twentieth century alone, though a vaccine—the first of any kind—had been available since 1796.

As humans spread around the globe, as human societies flourish and become more dependent on trade, and because urbanization means that people leave sparsely populated rural areas for densely populated neighborhoods, it has become much easier for infectious diseases to spread. Outbreaks are frequent, even in the modern era, though medical advances have been able to alleviate their impacts. In fact, even though the human population grew tremendously in the twentieth century, as did the population of farm animals, from which diseases could jump to humans, in the developed world and increasingly in the developing world, people are presently less likely to fall victim to infectious diseases than ever before. For instance, the advent of antibiotics, starting with penicillin in 1928, saw to it that hundreds of millions of people were rescued from death due to bacterial infections between then and now. But there is no guarantee this would continue because bacteria are becoming increasingly resistant to antibiotics, so much so that doctors and public health experts such as former Chief Medical Officer for England Sally Davies have warned of an incoming "antibiotic apocalypse." The World Health Organization warned in 2019 that the anti-vaccination movement was one of the top threats to global health because it has led to the return of almost forgotten diseases such as measles.

Demographic dynamics

Writing in The Histories, Greek historian Polybius, largely blamed the decline of the Hellenistic world on low fertility rates. He asserted that while protracted wars and deadly epidemics were absent, people were generally more interested in "show and money and the pleasures of an idle life" rather than marrying and raising children. Those who did have children, he said, had no more than one or two, with the express intention of "leaving them well off or bringing them up in extravagant luxury." However, it is difficult to estimate the actual fertility rate of Greece at this time because Polybius did not provide any data for analysis. He only gave a narrative that likely came from his impression of the kinds of Greeks with whom he was familiar, namely the elites rather than the commoners. Otherwise the population drop would have been abrupt. Nevertheless, the Greek case parallels the Roman one.

But since more plenteous honor has come to planes that yield a sterile shade, than to any three, we fruit-bearers (if as a nut tree I am counted among them) have begun to lexuriate in spreading foliage. How apples grow not every year, and injured grapes and injured berries are brought home: now she that would seem beautiful harms her womb, and rare in these days is she who would be a parent.

Ovid, Nux

By around 100 B.C. the notion of romantic love started becoming popular in Rome. In the final years of the Roman Republic, Roman women were well known for divorcing, having extra-marital affairs, and reluctance to bear children. Viewing this as a threat to the social and political order, and believing that the Roman upper-class was becoming increasingly cosmopolitan and individualistic, upon the establishment of the Roman Empire, Caesar Augustus introduced legislation designed to increase the birthrate. Men aged 20 to 60 and women aged 20 to 50 were legally obliged to marry; widowed or divorced individuals within the relevant age range were required to remarry. Exemptions were granted to those who had already had three children in the case of free-born people and four in the case of freed slaves. For political or bureaucratic office, preference was given to those with at least three legitimate children. Diminished inheritance rights awaited those who failed to reproduce. In a speech to Roman nobles, the Emperor expressed his pressing concern over the low birthrates of the Romans elite. He said that freed slaves had been granted citizenship and Roman allies given seats government to increase the power and prosperity of Rome, yet the "original stock" was not replacing themselves, leaving the task to foreigners. Roman poet Ovid shared the same observation.

But Augustan pro-natal policies proved unsuccessful. All they did was fueling nostalgia and disdain for the present; they went no further than reaffirming the past-oriented, rural, and patriarchal values of Imperial Rome. Like their Greek counterparts, Roman elites had access to contraception—though this knowledge was lost to Europe during the Middle Ages and the Early Modern Period—and as such were able to enjoy sexual intercourse without having to rear additional children. In other words, people of high socioeconomic class of the Greco-Roman world were able to control their own fertility. Not only that, this ability likely trickled down to the lower classes. In any case, the result was predictable. Due to the absence of modern medicine, which could extend life expectancy, their numbers started shrinking. Moreover, population decline coincided with people being less religious and more questioning of traditions, both of which contributed to falling fertility as more and more people came to the conclusion that it was up to them, rather than the gods, how many children they had.

Other population imbalances may occur when low fertility rates coincides with high dependency ratios or when there is an unequal distribution of wealth between elites and commoners. Both characterized the Roman Empire.

Several key features of human societal collapse can be related to population dynamics. For example, the native population of Cusco, Peru at the time of the Spanish conquest was stressed by an imbalanced sex ratio.

There is strong evidence that humans also display population cycles. Societies as diverse as those of England and France during the Roman, medieval and early modern eras, of Egypt during Greco-Roman and Ottoman rule, and of various dynasties in China all showed similar patterns of political instability and violence becoming considerably more common after times of relative peace, prosperity, and sustained population growth. Quantitatively, periods of unrest included many times more events of instability per decade and occurred when the population was declining rather than increasing. Pre-industrial agrarian societies typically faced instability after one or two centuries of stability. However, a population approaching its carrying capacity alone is not enough to trigger general decline if the people remained united and the ruling class strong. Other factors had to be involved, such as having more aspirants for positions of the elite than the society could realistically support (elite overproduction), which led to social strife, and chronic inflation, which caused incomes to fall and threatened the fiscal health of the state. In particular, an excess in especially young adult male population predictably led to social unrest and violence, as the third and higher-order parity sons had trouble realizing their economic desires and became more open to extreme ideas and actions. Adults in their 20s are especially prone to radicalization. Most historical periods of social unrest lacking external triggers, such as natural calamities, and most genocides can be readily explained as a result of a built-up youth bulge. As these trends intensified, they jeopardized the social fabric, thereby facilitating the decline.

Theories

Historical analysts have proposed a myriad of theories to explain the rise and fall of civilizations. Such theories have evolved from being purely social and ethical, to ideological and ethnocentric, and finally to where they are today, multidisciplinary studies. They have become much more sophisticated.

Cognitive decline and loss of creativity

Anthropologist Joseph Tainter theorized that collapsed societies essentially exhausted their own designs, and were unable to adapt to natural diminishing returns for what they knew as their method of survival. It matches closely with historian Arnold J. Toynbee's idea that they were confronted with problems they could not solve. For Toynbee, key to civilization is the ability to solve problems and a society declines when its ability to do so stagnates or falls. Philosopher Oswald Spengler argued that a civilization in its "winter" would see a disinclination for abstract thinking. Psychologists David Rand and Jonathan Cohen theorized that people switch between two broad modes of thinking. The first is fast and automatic but rigid while the second is slow and analytical but more flexible. Rand and Cohen believe this explains why people continue with self-destructive behaviors when logical reasoning would have alerted them of the dangers ahead. People switch from the second to the first mode of thinking after the introduction of an invention that dramatically increases the standards of living. Rand and Cohen pointed to the recent examples of the antibiotic overuse leading to resistant bacteria and failure to save for retirement. Tainter noted that according to behavioral economics, the human decision-making process tends to be more irrational than not and that as the rate of innovation declines, as measured by the number of inventions relative to the amount of money spent on research and development, it becomes progressively harder for there to be a technological solution to the problem of societal collapse.

Social scientists Edward Dutton and Michael Woodley of Menie make the case in their book At Our Wits' End (2018) that to the extent that intelligence is heritable, the tendency of the cognitive elite to produce relatively few children, that is, the negative correlation between intelligence and fertility, observed once a society reaches a certain level of development and prosperity precipitates its decline. These authors argue that, in multiple historical societies, such as Ancient Greece, Ancient Rome, Ancient China, and the Islamic Civilization, the more intelligent individuals not only had access to contraception but were also more likely to use it effectively. While measuring the level of general intelligence (the g-factor) in periods for which there is no psychometric data is problematic, the authors suggest that one could estimate it via proxies, such as the number of innovations per century per billion people.

Social and environmental dynamics

During the 9th century AD, the central Maya region suffered major political collapse, marked by the abandonment of cities

What produces modern sedentary life, unlike nomadic hunter-gatherers, is extraordinary modern economic productivity. Tainter argues that exceptional productivity is actually more the sign of hidden weakness, both because of a society's dependence on it, and its potential to undermine its own basis for success by not being self limiting as demonstrated in Western culture's ideal of perpetual growth.

As a population grows and technology makes it easier to exploit depleting resources, the environment's diminishing returns are hidden from view. Societal complexity is then potentially threatened if it develops beyond what is actually sustainable, and a disorderly reorganization were to follow. The scissors model of Malthusian collapse, where the population grows without limit and resources do not, is the idea of great opposing environmental forces cutting into each other.

The complete breakdown of economic, cultural and social institutions with ecological relationships is perhaps the most common feature of collapse. In his book Collapse: How Societies Choose to Fail or Succeed, Jared Diamond proposes five interconnected causes of collapse that may reinforce each other: non-sustainable exploitation of resources, climate changes, diminishing support from friendly societies, hostile neighbors, and inappropriate attitudes for change.

Energy return on investment

Energy has played a crucial role throughout human history. Energy is linked to the birth, growth, and decline of each and every society. Energy surplus is required to the division of labor and the growth of cities. Massive energy surplus is needed for widespread wealth and cultural amenities. Economic prospects fluctuate in tandem with a society's access to cheap and abundant energy.

Thomas Homer-Dixon and Charles Hall proposed an economic model called energy return on investment (EROI), which measures the amount of surplus energy a society gets from using energy to obtain energy. While it is true that energy shortages drive up prices and as such provide an incentive to explore and extract previously uneconomical sources, which may still be plentiful, more energy would be required, in which case the EROI will not be as high as initially thought.

There would be no surplus if EROI approaches 1:1. Hall showed that the real cutoff is well above that, estimated to be 3:1 to sustain the essential overhead energy costs of a modern society. The EROI of the most preferred energy source, petroleum, has fallen in the past century from 100:1 to the range of 10:1 with clear evidence that the natural depletion curves all are downward decay curves. An EROI of more than ~3, then, is what appears necessary to provide the energy for socially important tasks, such as maintaining government, legal and financial institutions, a transportation infrastructure, manufacturing, building construction and maintenance and the life styles all members of a given society.

Social scientist Luke Kemp indicated that alternative sources of energy, such as solar panels, have low EROI because they have low energy density, meaning they require a lot of land, and require substantial amounts of rare earth metals to produce. Charles Hall and his colleagues reached the same conclusion. While there is no on-site pollution, the EROI of renewable energy sources may be too low for them to be considered a viable alternative to fossil fuels, which continue to provide the majority of the energy consumed by humanity (60–65% as of 2014). Moreover, renewable energy is intermittent and requires large and expensive storage facilities in order to be a base-load source for the power grid (20% or more). In that case, its EROI would be even lower. Paradoxically, therefore, expansions of renewable energy require more consumption of fossil fuels. For Hall and his colleagues, whereas human societies in the previous few centuries could solve or at least alleviate many of their problems by making technological innovations and by consuming more energy, contemporary society faces the difficult challenge of declining EROI for its most useful energy source, fossil fuels, and low EROI for alternatives.

Mathematician Safa Motesharrei and his collaborators showed that the use of non-renewable resources such as fossil fuels allows populations to grow to one order of magnitude larger than they would using renewable resources alone and as such is able to postpone societal collapse. However, when collapse finally comes, it is much more dramatic. Tainter warned that in the modern world, if the supply of fossil fuels were somehow cut off, shortages of clean water and food would ensue, and millions would die in a few weeks in the worse-case scenario.

Homer-Dixon asserted that declining EROI was one of the reasons why the Roman Empire declined and fell. Historian Joseph Tainter made the same claim about the Mayan Empire.

Models of societal response

According to Joseph Tainter (1990), too many scholars offer facile explanations of societal collapse by assuming one or more of the following three models in the face of collapse:

  1. The Dinosaur, a large-scale society in which resources are being depleted at an exponential rate and yet nothing is done to rectify the problem because the ruling elite are unwilling or unable to adapt to those resources' reduced availability: In this type of society, rulers tend to oppose any solutions that diverge from their present course of action. They will favor intensification and commit an increasing number of resources to their present plans, projects, and social institutions.
  2. The Runaway Train, a society whose continuing function depends on constant growth (cf. Frederick Jackson Turner's Frontier Thesis): This type of society, based almost exclusively on acquisition (e.g., pillage or exploitation), cannot be sustained indefinitely. The Assyrian, Roman and Mongol Empires, for example, both fractured and collapsed when no new conquests could be achieved.
  3. The House of Cards, a society that has grown to be so large and include so many complex social institutions that it is inherently unstable and prone to collapse. This type of society has been seen with particular frequency among Eastern bloc and other communist nations, in which all social organizations are arms of the government or ruling party, such that the government must either stifle association wholesale (encouraging dissent and subversion) or exercise less authority than it asserts (undermining its legitimacy in the public eye).
    By contrast, as Alexis de Tocqueville observed, when voluntary and private associations are allowed to flourish and gain legitimacy at an institutional level, they complement and often even supplant governmental functions: They provide a "safety valve" for dissent, assist with resource allocation, provide for social experimentation without the need for governmental coercion, and enable the public to maintain confidence in society as a whole, even during periods of governmental weakness.

Tainter's critique

Tainter argues that these models, though superficially useful, cannot severally or jointly account for all instances of societal collapse. Often they are seen as interconnected occurrences that reinforce each other.

Tainter's position is that social complexity is a recent and comparatively anomalous occurrence requiring constant support. He asserts that collapse is best understood by grasping four axioms. In his own words (p. 194):

  1. human societies are problem-solving organizations;
  2. sociopolitical systems require energy for their maintenance;
  3. increased complexity carries with it increased costs per capita; and
  4. investment in sociopolitical complexity as a problem-solving response reaches a point of declining marginal returns.

With these facts in mind, collapse can simply be understood as a loss of the energy needed to maintain social complexity. Collapse is thus the sudden loss of social complexity, stratification, internal and external communication and exchange, and productivity.

Toynbee’s theory of decay

In his 12-volume masterpiece A Study of History (1934–1961), British historian Arnold J. Toynbee explored the rise and fall of 28 civilizations and came to the conclusion that civilizations generally collapsed due mainly to internal factors, factors of their own making, though external pressures did play a role. He theorized that all civilizations pass through several distinct stages: genesis, growth, time of troubles, universal state, and disintegration.

For Toynbee, a civilization is born when a "creative minority" successfully responds to the challenges posed by its physical, social, and political environment. But the fixation on the old methods of the "creative minority" leads it to eventually cease to be creative and degenerate into merely a "dominant minority" (that forces the majority to obey without meriting obedience), failing to recognize new ways of thinking. He argues that creative minorities deteriorate due to a worship of their "former self", by which they become prideful, and fail to adequately address the next challenge they face. Similarly, German philosopher Oswald Spengler discussed the transition from Kultur to Zivilisation in his The Decline of the West (1918).

He argues that the ultimate sign a civilization has broken down is when the dominant minority forms a Universal State, which stifles political creativity. He states:

First the Dominant Minority attempts to hold by force - against all right and reason - a position of inherited privilege which it has ceased to merit; and then the Proletariat repays injustice with resentment, fear with hate, and violence with violence when it executes its acts of secession. Yet the whole movement ends in positive acts of creation - and this on the part of all the actors in the tragedy of disintegration. The Dominant Minority creates a universal state, the Internal Proletariat a universal church, and the External Proletariat a bevy of barbarian war-bands.

He argues that, as civilizations decay, they form an "Internal Proletariat" and an "External Proletariat." The Internal proletariat is held in subjugation by the dominant minority inside the civilization, and grows bitter; the external proletariat exists outside the civilization in poverty and chaos, and grows envious. He argues that as civilizations decay, there is a "schism in the body social", whereby abandon and self-control together replace creativity, and truancy and martyrdom together replace discipleship by the creative minority.

He argues that in this environment, people resort to archaism (idealization of the past), futurism (idealization of the future), detachment (removal of oneself from the realities of a decaying world), and transcendence (meeting the challenges of the decaying civilization with new insight, as a prophet). He argues that those who transcend during a period of social decay give birth to a new Church with new and stronger spiritual insights, around which a subsequent civilization may begin to form after the old has died. Toynbee's use of the word 'church' refers to the collective spiritual bond of a common worship, or the same unity found in some kind of social order.

Historian Carroll Quigley expanded upon this theory in The Evolution of Civilizations (1961, 1979). He argued that societal disintegration involves the metamorphosis of social instruments, set up to meet actual needs, into institutions, which serve their own interest at the expense of social needs. However, starting from the 1950s, Toynbee's approach to history, his style of civilizational analysis, faced skepticism from mainstream historians who thought it put an undue emphasis on the divine, which led to his academic reputation declining, though for a time, Toynbee's Study remained popular outside academia. Interest revived decades later with the publication of The Clash of Civilizations (1997) by political scientist Samuel P. Huntington. Huntington viewed human history as broadly the history of civilizations and posited that the world after the end of the Cold War will be a multi-polar one of competing major civilizations, divided by "fault lines."

Systems science

Developing an integrated theory of societal collapse that takes into account the complexity of human societies remains an open problem. Researchers currently have very little ability to identify internal structures of large distributed systems like human societies. Genuine structural collapse seems, in many cases, the only plausible explanation supporting the idea that such structures exist. However, until they can be concretely identified, scientific inquiry appears limited to the construction of scientific narratives, using systems thinking for careful storytelling about systemic organization and change.

In the 1990s, evolutionary anthropologist and quantitative historian Peter Turchin noticed that the equations used to model the populations of predators and preys can also be used to describe the ontogeny of human societies. He specifically examined how social factors such as income inequality were related to political instability. He found recurring cycles of unrest in historical societies such as Ancient Egypt, China, and Russia. He specifically identified two cycles, one long and one short. The long one, what he calls the "secular cycle," lasts for approximately two to three centuries. A society starts out fairly equal. Its population grows and the cost of labor drops. A wealthy upper-class emerges while the life for the working class deteriorates. As inequality grows, a society becomes more unstable with the lower-class being miserable and the upper-class entangled in infighting. Exacerbating social turbulence eventually leads to collapse. The shorter cycle lasts for about 50 years and consists of two generations, one peaceful and one turbulent. Looking at United States history, for example, Turchin was able to identify times of serious sociopolitical instability, 1870, 1920, and 1970. He predicted that in 2020, the U.S. would witness a period of unrest at least on the same level as 1970 because the first cycle coincides with the turbulent part of the second in around 2020. He announced this prediction in 2010. He also warned that the U.S. is not the only Western nation under strain.

But Turchin's model can only paint the broader picture and cannot pinpoint how bad things can get and what precisely triggers a collapse. Mathematician Safa Motesharrei also applied predator-prey models to human society, with the upper-class and lower-class being the two different types of "predators" and natural resources being the "prey." He found that either extreme inequality or resource depletion facilitates a collapse. But a collapse is only irreversible if a society experiences both at the same time, as they "fuel each other."

Examples of civilizations and societies that have collapsed

By reversion or simplification

During the course of the 15th century, nearly all of Angkor was abandoned

By absorption

The Champa civilization once occupied parts of modern-day Central and Southern Vietnam

By extinction or evacuation

Peak oil

From Wikipedia, the free encyclopedia

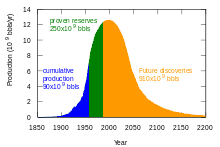
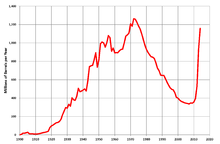
A 1956 world oil production distribution, showing historical data and future production, proposed by M. King Hubbert – it had a peak of 12.5 billion barrels per year in about the year 2000. As of 2016, the world's oil production was 29.4 billion barrels per year (80.6 Mbbl/day), with an oil glut between 2014 and 2018.
 
Hubbert's upper-bound prediction for US crude oil production (1956) in red, and actual lower-48 states production through to 2014 in green

Peak oil is the year when the maximum rate of extraction of petroleum is reached, after which it is expected to enter terminal decline. As of 2020, peak oil forecasts range from 2019 to the 2040s, depending on economics and how governments respond to global warming. It is often confused with oil depletion; however, whereas depletion refers to a period of falling reserves and supply, peak oil refers to the point of maximum production. The concept of peak oil is often credited to geologist M. King Hubbert whose 1956 paper first presented a formal theory. Peak coal was in 2013 and peak oil is forecast to occur before peak gas.

Most early analyses concentrated on increasing costs of extraction and assumed that demand would drive costs higher. More recent analyses concentrate on drop in demand as alternatives to oil become more attractive.

Some observers, such as petroleum industry experts Kenneth S. Deffeyes and Matthew Simmons, predicted there would be negative global economy effects after a post-peak production decline and subsequent oil price increase because of the continued dependence of most modern industrial transport, agricultural, and industrial systems on the low cost and high availability of oil.

According to the International Energy Agency, conventional crude oil production peaked in 2006. A 2013 study concluded that peak oil "appears probable before 2030", and that there was a "significant risk" that it would occur before 2020, and assumed that major investments in alternatives will occur before a crisis, without requiring major changes in the lifestyle of heavily oil-consuming nations. Predictions of future oil production made in 2007 and 2009 stated either that the peak had already occurred, that oil production was on the cusp of the peak, or that it would occur soon. These predictions proved false as world oil production rose and hit a new high in 2018, although most of this increase in supply in the United States comes from deposits of tight oil, which is costlier to extract than conventional oil and requires substantial capital for investment.

Hubbert's original prediction that US peak oil would occur in about 1970 appeared accurate for a time, as US average annual production peaked in 1970 at 9.6 million barrels per day and mostly declined for more than three decades after. However, the use of hydraulic fracturing and horizontal drilling caused US production to rebound starting around 2005. In addition, Hubbert's original predictions for world peak oil production proved premature. The rate of discovery of new petroleum deposits peaked worldwide during the 1960s and has not approached these levels since.

Modeling global oil production

The idea that the rate of oil production would peak and irreversibly decline is an old one. In 1919, David White, chief geologist of the United States Geological Survey, wrote of US petroleum: "... the peak of production will soon be passed, possibly within 3 years." In 1953, Eugene Ayers, a researcher for Gulf Oil, projected that if US ultimate recoverable oil reserves were 100 billion barrels, then production in the US would peak no later than 1960. If ultimate recoverable were to be as high as 200 billion barrels, which he warned was wishful thinking, US peak production would come no later than 1970. Likewise for the world, he projected a peak somewhere between 1985 (one trillion barrels ultimate recoverable) and 2000 (two trillion barrels recoverable). Ayers made his projections without a mathematical model. He wrote: "But if the curve is made to look reasonable, it is quite possible to adapt mathematical expressions to it and to determine, in this way, the peak dates corresponding to various ultimate recoverable reserve numbers"

By observing past discoveries and production levels, and predicting future discovery trends, the geoscientist M. King Hubbert used statistical modelling in 1956 to predict that United States oil production would peak between 1965 and 1971. This prediction appeared accurate for a time however during 2018 daily production of oil in the United States was exceeding daily production in 1970, the year that was previously the peak. Hubbert used a semi-logistical curved model (sometimes incorrectly compared to a normal distribution). He assumed the production rate of a limited resource would follow a roughly symmetrical distribution. Depending on the limits of exploitability and market pressures, the rise or decline of resource production over time might be sharper or more stable, appear more linear or curved. That model and its variants are now called Hubbert peak theory; they have been used to describe and predict the peak and decline of production from regions, countries, and multinational areas. The same theory has also been applied to other limited-resource production.

More recently, the term "peak oil" was popularized by Colin Campbell and Kjell Aleklett in 2002 when they helped form the Association for the Study of Peak Oil and Gas (ASPO). In his publications, Hubbert used the term "peak production rate" and "peak in the rate of discoveries".

In a 2006 analysis of Hubbert theory, it was noted that uncertainty in real world oil production amounts and confusion in definitions increases the uncertainty in general of production predictions. By comparing the fit of various other models, it was found that Hubbert's methods yielded the closest fit overall but none of the models were very accurate. In 1956 Hubbert himself recommended using "a family of possible production curves" when predicting a production peak and decline curve.

A comprehensive 2009 study of oil depletion by the UK Energy Research Centre noted:

Few analysts now adhere to a symmetrical bell-shaped production curve. This is correct, as there is no natural physical reason why the production of a resource should follow such a curve and little empirical evidence that it does.

— Bentley et al., Comparison of global oil supply forecasts

The report noted that Hubbert had used the logistic curve because it was mathematically convenient, not because he believed it to be literally correct. The study observed that in most cases the asymmetric exponential model provided a better fit (as in the case of Seneca cliff model), and that peaks tended to occur well before half the oil had been produced, with the result that in nearly all cases, the post-peak decline was more gradual than the increase leading up to the peak.

Demand

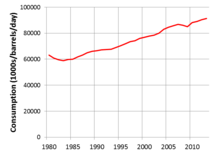
Global consumption of oil 1980–2013 (Energy Information Administration)

The demand side of peak oil over time is concerned with the total quantity of oil that the global market would choose to consume at any given market price. The hypothesis that peak oil would be driven by a reduction in the availability of easily extractable oil implies that prices will increase over time to match demand with a declining supply. By contrast, developments since 2010 have given rise to the idea of demand-driven peak oil. The central idea is that, in response to technological developments and pressure to reduce carbon dioxide emissions, demand for oil at any given price will decline. In this context, the development of electric vehicles creates the possibility that the primary use of oil, transportation, will diminish in importance over time.

After growing steadily until around 2006, oil demand has fluctuated, falling during recession periods, and then recovering, but at slower growth rates than in the past. Oil demand fell sharply during the early stages of the COVID-19 pandemic, with global demand for oil dropping from 100 million barrels a day in 2019 to 90 million in 2020. The drop in demand is not expected to recover until at least 2022, and British Petroleum predicts that oil demand will never recover to pre-pandemic levels due to increased proliferation of electric vehicles and stronger action on climate change.

Energy demand is distributed amongst four broad sectors: transportation, residential, commercial, and industrial. In terms of oil use, transportation is the largest sector and the one that has seen the largest growth in demand in recent decades. This growth has largely come from new demand for personal-use vehicles powered by internal combustion engines. This sector also has the highest consumption rates, accounting for approximately 71% of the oil used in the United States in 2013. and 55% of oil use worldwide as documented in the Hirsch report. Transportation is therefore of particular interest to those seeking to mitigate the effects of peak oil.

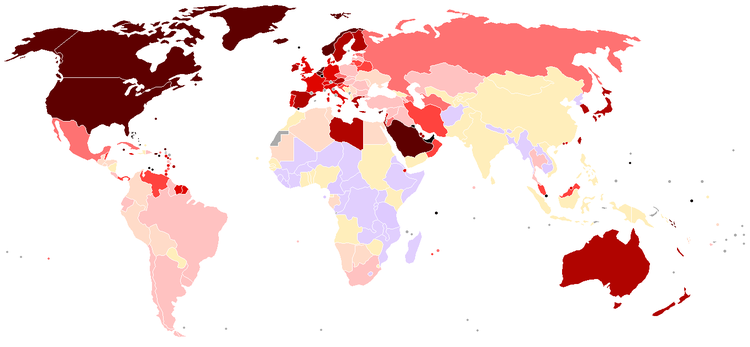
Oil consumption in bbl per day per capita (darker colors represent more consumption, gray represents no data) (source: NationMaster statistics, 2007-01-13)
   > 0.07
  0.07–0.05
  0.05–0.035
  0.035–0.025
  0.025–0.02
  0.02–0.015
  0.015–0.01
  0.01–0.005
  0.005–0.0015
   < 0.0015

Although demand growth is highest in the developing world, the United States is the world's largest consumer of petroleum. Between 1995 and 2005, US consumption grew from 17,700,000 barrels per day (2,810,000 m3/d) to 20,700,000 barrels per day (3,290,000 m3/d), a 3,000,000 barrels per day (480,000 m3/d) increase. China, by comparison, increased consumption from 3,400,000 barrels per day (540,000 m3/d) to 7,000,000 barrels per day (1,100,000 m3/d), an increase of 3,600,000 barrels per day (570,000 m3/d), in the same time frame. The Energy Information Administration (EIA) stated that gasoline usage in the United States may have peaked in 2007, in part because of increasing interest in and mandates for use of biofuels and energy efficiency.

As countries develop, industry and higher living standards drive up energy use, oil usage being a major component. Thriving economies, such as China and India, are quickly becoming large oil consumers. For example, China surpassed the United States as the world's largest crude oil importer in 2015. Oil consumption growth is expected to continue; however, not at previous rates, as China's economic growth is predicted to decrease from the high rates of the early part of the 21st century. India's oil imports are expected to more than triple from 2005 levels by 2020, rising to 5 million barrels per day (790×103 m3/d).

Population

World population

Another significant factor affecting petroleum demand has been human population growth. The United States Census Bureau predicts that world population in 2030 will be almost double that of 1980. Oil production per capita peaked in 1979 at 5.5 barrels/year but then declined to fluctuate around 4.5 barrels/year since. In this regard, the decreasing population growth rate since the 1970s has somewhat ameliorated the per capita decline.

Economic growth

Some analysts argue that the cost of oil has a profound effect on economic growth due to its pivotal role in the extraction of resources and the processing, manufacturing, and transportation of goods. As the industrial effort to extract new unconventional oil sources increases, this has a compounding negative effect on all sectors of the economy, leading to economic stagnation or even eventual contraction. Such a scenario would result in an inability for national economies to pay high oil prices, leading to declining demand and a price collapse.

Supply

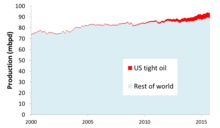
Global liquids production 2000–2015, indicating the component of US tight oil (Energy Information Administration)

Our analysis suggests there are ample physical oil and liquid fuel resources for the foreseeable future. However, the rate at which new supplies can be developed and the break-even prices for those new supplies are changing.

Defining sources of oil

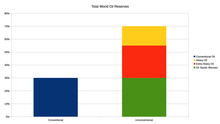
Oil may come from conventional or unconventional sources. The terms are not strictly defined, and vary within the literature as definitions based on new technologies tend to change over time. As a result, different oil forecasting studies have included different classes of liquid fuels. Some use the terms "conventional" oil for what is included in the model, and "unconventional" oil for classes excluded.

In 1956, Hubbert confined his peak oil prediction to that crude oil "producible by methods now in use." By 1962, however, his analyses included future improvements in exploration and production. All of Hubbert's analyses of peak oil specifically excluded oil manufactured from oil shale or mined from oil sands. A 2013 study predicting an early peak excluded deepwater oil, tight oil, oil with API gravity less than 17.5, and oil close to the poles, such as that on the North Slope of Alaska, all of which it defined as non-conventional. Some commonly used definitions for conventional and unconventional oil are detailed below.

Conventional sources

Conventional oil is extracted on land and offshore using "standard" (i.e., in common use before 2000) techniques, and can be categorized as light, medium, heavy, or extra heavy in grade. The exact definitions of these grades vary depending on the region from which the oil came. Light oil flows naturally to the surface or can be extracted by simply pumping it out of the ground. Heavy refers to oil that has higher density and therefore lower API gravity. It does not flow easily, and its consistency is similar to that of molasses. While some of it can be produced using conventional techniques, recovery rates are better using unconventional methods.

According to the International Energy Agency, production of conventional crude oil (as then defined) peaked in 2006, with an all-time maximum of 70 million barrels per day.

  • Tight oil was typically classified as "unconventional" prior to about 2006, but more recent analyses began to consider it to be "conventional" as its extraction became more common. It is extracted from deposits of low-permeability rock, sometimes shale deposits but often other rock types, using hydraulic fracturing, or "fracking." It is often confused with shale oil, which is oil manufactured from the kerogen contained in an oil shale (see below), Production of tight oil has led to a resurgence of US production in recent years. U.S. tight oil production peaked in March 2015, and fell a total of 12 percent over the next 18 months. But then U.S. tight oil production rose again, and by September 2017 had exceeded the old peak, and as of October 2017, U.S. tight oil production was still rising.
US Lower 48 oil production from 2012 and anticipated decline in production to the end of 2017, with rig count (Energy Information Administration)

Unconventional sources

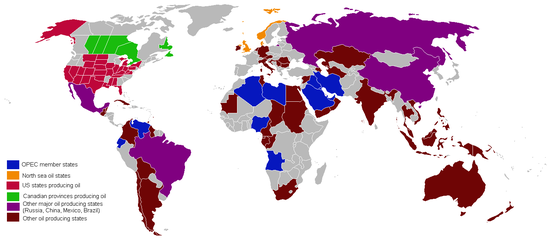
As of 2019, oil considered unconventional is derived from multiple sources.

  • Oil shale is a common term for sedimentary rock such as shale or marl, containing kerogen, a waxy oil precursor that has not yet been transformed into crude oil by the high pressures and temperatures caused by deep burial. The term "oil shale" is somewhat confusing, because what is referred to in the U.S. as "oil shale" is not really oil and the rock it is found in is generally not shale. Since it is close to the surface rather than buried deep in the earth, the shale or marl is typically mined, crushed, and retorted, producing synthetic oil from the kerogen. Its net energy yield is much lower than conventional oil, so much so that estimates of the net energy yield of shale discoveries are considered extremely unreliable.
  • Oil sands are unconsolidated sandstone deposits containing large amounts of very viscous crude bitumen or extra-heavy crude oil that can be recovered by surface mining or by in-situ oil wells using steam injection or other techniques. It can be liquefied by upgrading, blending with diluent, or by heating; and then processed by a conventional oil refinery. The recovery process requires advanced technology but is more efficient than that of oil shale. The reason is that, unlike U.S. "oil shale", Canadian oil sands actually contain oil, and the sandstones they are found in are much easier to produce oil from than shale or marl. In the U.S. dialect of English, these formations are often called "tar sands", but the material found in them is not tar but an extra-heavy and viscous form of oil technically known as bitumen. Venezuela has oil sands deposits similar in size to those of Canada, and approximately equal to the world's reserves of conventional oil. Venezuela's Orinoco Belt tar sands are less viscous than Canada's Athabasca oil sands – meaning they can be produced by more conventional means – but they are buried too deep to be extracted by surface mining. Estimates of the recoverable reserves of the Orinoco Belt range from 100 billion barrels (16×109 m3) to 270 billion barrels (43×109 m3). In 2009, USGS updated this value to 513 billion barrels (8.16×10¹⁰ m3).
United States crude oil production exceeds imports for the first time since the early 1990s
  • Coal liquefaction or gas to liquids product are liquid hydrocarbons that are synthesised from the conversion of coal or natural gas by the Fischer-Tropsch process, Bergius process, or Karrick process. Currently, two companies SASOL and Shell, have synthetic oil technology proven to work on a commercial scale. Sasol's primary business is based on CTL (coal-to-liquid) and GTL (natural gas-to-liquid) technology, producing US$4.40 billion in revenues (FY2009). Shell has used these processes to recycle waste flare gas (usually burnt off at oil wells and refineries) into usable synthetic oil. However, for CTL there may be insufficient coal reserves to supply global needs for both liquid fuels and electric power generation.
  • Minor sources include thermal depolymerization, as discussed in a 2003 article in Discover magazine, that could be used to manufacture oil indefinitely, out of garbage, sewage, and agricultural waste. The article claimed that the cost of the process was $15 per barrel. A follow-up article in 2006 stated that the cost was actually $80 per barrel, because the feedstock that had previously been considered as hazardous waste now had market value. A 2008 news bulletin published by Los Alamos Laboratory proposed that hydrogen (possibly produced using hot fluid from nuclear reactors to split water into hydrogen and oxygen) in combination with sequestered CO
    2
    could be used to produce methanol (CH3OH), which could then be converted into gasoline.

Discoveries

All the easy oil and gas in the world has pretty much been found. Now comes the harder work in finding and producing oil from more challenging environments and work areas.

— William J. Cummings, Exxon-Mobil company spokesman, December 2005

It is pretty clear that there is not much chance of finding any significant quantity of new cheap oil. Any new or unconventional oil is going to be expensive.

— Lord Ron Oxburgh, a former chairman of Shell, October 2008
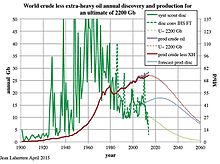
World oil discoveries peaked in the 1960s

The peak of world oilfield discoveries occurred in the 1960s at around 55 billion barrels (8.7×10⁹ m3)(Gb)/year. According to the Association for the Study of Peak Oil and Gas (ASPO), the rate of discovery has been falling steadily since. Less than 10 Gb/yr of oil were discovered each year between 2002 and 2007. According to a 2010 Reuters article, the annual rate of discovery of new fields has remained remarkably constant at 15–20 Gb/yr.

Although US proved oil reserves grew by 3.8 billion barrels in 2011, even after deducting 2.07 billion barrels of production, only 8 percent of the 5.84 billion barrels of the newly booked oil was because of new field discoveries (U.S. EIA)

But despite the fall-off in new field discoveries, and record-high production rates, the reported proved reserves of crude oil remaining in the ground in 2014, which totaled 1,490 billion barrels, not counting Canadian heavy oil sands, were more than quadruple the 1965 proved reserves of 354 billion barrels. A researcher for the U.S. Energy Information Administration has pointed out that after the first wave of discoveries in an area, most oil and natural gas reserve growth comes not from discoveries of new fields, but from extensions and additional gas found within existing fields.

A report by the UK Energy Research Centre noted that "discovery" is often used ambiguously, and explained the seeming contradiction between falling discovery rates since the 1960s and increasing reserves by the phenomenon of reserve growth. The report noted that increased reserves within a field may be discovered or developed by new technology years or decades after the original discovery. But because of the practice of "backdating", any new reserves within a field, even those to be discovered decades after the field discovery, are attributed to the year of initial field discovery, creating an illusion that discovery is not keeping pace with production.

Reserves

Proven oil reserves, 2013

Total possible conventional crude oil reserves include crude oil with 90% certainty of being technically able to be produced from reservoirs (through a wellbore using primary, secondary, improved, enhanced, or tertiary methods); all crude with a 50% probability of being produced in the future (probable); and discovered reserves that have a 10% possibility of being produced in the future (possible). Reserve estimates based on these are referred to as 1P, proven (at least 90% probability); 2P, proven and probable (at least 50% probability); and 3P, proven, probable and possible (at least 10% probability), respectively. This does not include liquids extracted from mined solids or gasses (oil sands, oil shale, gas-to-liquid processes, or coal-to-liquid processes).

Hubbert's 1956 peak projection for the United States depended on geological estimates of ultimate recoverable oil resources, but starting in his 1962 publication, he concluded that ultimate oil recovery was an output of his mathematical analysis, rather than an assumption. He regarded his peak oil calculation as independent of reserve estimates.

Many current 2P calculations predict reserves to be between 1150 and 1350 Gb, but some authors have written that because of misinformation, withheld information, and misleading reserve calculations, 2P reserves are likely nearer to 850–900 Gb. The Energy Watch Group wrote that actual reserves peaked in 1980, when production first surpassed new discoveries, that apparent increases in reserves since then are illusory, and concluded (in 2007): "Probably the world oil production has peaked already, but we cannot be sure yet."

Concerns over stated reserves

[World] reserves are confused and in fact inflated. Many of the so-called reserves are in fact resources. They're not delineated, they're not accessible, they're not available for production.

— Sadad Al Husseini, former VP of Aramco, presentation to the Oil and Money conference, October 2007.

Sadad Al Husseini estimated that 300 billion barrels (48×109 m3) of the world's 1,200 billion barrels (190×109 m3) of proven reserves should be recategorized as speculative resources.

Graph of OPEC reported reserves showing jumps in stated reserves without associated discoveries, as well as the lack of depletion despite yearly production

One difficulty in forecasting the date of peak oil is the opacity surrounding the oil reserves classified as "proven". In many major producing countries, the majority of reserves claims have not been subject to outside audit or examination. Several worrying signs concerning the depletion of proven reserves emerged in about 2004. This was best exemplified by the 2004 scandal surrounding the "evaporation" of 20% of Shell's reserves.

For the most part, proven reserves are stated by the oil companies, the producer states and the consumer states. All three have reasons to overstate their proven reserves: oil companies may look to increase their potential worth; producer countries gain a stronger international stature; and governments of consumer countries may seek a means to foster sentiments of security and stability within their economies and among consumers.

Major discrepancies arise from accuracy issues with the self-reported numbers from the Organization of the Petroleum Exporting Countries (OPEC). Besides the possibility that these nations have overstated their reserves for political reasons (during periods of no substantial discoveries), over 70 nations also follow a practice of not reducing their reserves to account for yearly production. Analysts have suggested that OPEC member nations have economic incentives to exaggerate their reserves, as the OPEC quota system allows greater output for countries with greater reserves.

Kuwait, for example, was reported in the January 2006 issue of Petroleum Intelligence Weekly to have only 48 billion barrels (7.6×10⁹ m3) in reserve, of which only 24 were fully proven. This report was based on the leak of a confidential document from Kuwait and has not been formally denied by the Kuwaiti authorities. This leaked document is from 2001, but excludes revisions or discoveries made since then. Additionally, the reported 1.5 billion barrels (240×106 m3) of oil burned off by Iraqi soldiers in the First Persian Gulf War are conspicuously missing from Kuwait's figures.

On the other hand, investigative journalist Greg Palast argues that oil companies have an interest in making oil look more rare than it is, to justify higher prices. This view is contested by ecological journalist Richard Heinberg. Other analysts argue that oil producing countries understate the extent of their reserves to drive up the price.

The EUR reported by the 2000 USGS survey of 2,300 billion barrels (370×109 m3) has been criticized for assuming a discovery trend over the next twenty years that would reverse the observed trend of the past 40 years. Their 95% confidence EUR of 2,300 billion barrels (370×109 m3) assumed that discovery levels would stay steady, despite the fact that new-field discovery rates have declined since the 1960s. That trend of falling discoveries has continued in the ten years since the USGS made their assumption. The 2000 USGS is also criticized for other assumptions, as well as assuming 2030 production rates inconsistent with projected reserves.

Reserves of unconventional oil

Syncrude's Mildred Lake mine site and plant near Fort McMurray, Alberta

As conventional oil becomes less available, it can be replaced with production of liquids from unconventional sources such as tight oil, oil sands, ultra-heavy oils, gas-to-liquid technologies, coal-to-liquid technologies, biofuel technologies, and shale oil. In the 2007 and subsequent International Energy Outlook editions, the word "Oil" was replaced with "Liquids" in the chart of world energy consumption. In 2009 biofuels was included in "Liquids" instead of in "Renewables". The inclusion of natural gas liquids, a bi-product of natural gas extraction, in "Liquids" has been criticized as it is mostly a chemical feedstock which is generally not used as transport fuel.

Texas oil production declined since peaking in 1972 but has recently had a resurgence due to tight oil production

Reserve estimates are based on profitability, which depends on both oil price and cost of production. Hence, unconventional sources such as heavy crude oil, oil sands, and oil shale may be included as new techniques reduce the cost of extraction. With rule changes by the SEC, oil companies can now book them as proven reserves after opening a strip mine or thermal facility for extraction. These unconventional sources are more labor and resource intensive to produce, however, requiring extra energy to refine, resulting in higher production costs and up to three times more greenhouse gas emissions per barrel (or barrel equivalent) on a "well to tank" basis or 10 to 45% more on a "well to wheels" basis, which includes the carbon emitted from combustion of the final product.

While the energy used, resources needed, and environmental effects of extracting unconventional sources have traditionally been prohibitively high, major unconventional oil sources being considered for large-scale production are the extra heavy oil in the Orinoco Belt of Venezuela, the Athabasca Oil Sands in the Western Canadian Sedimentary Basin, and the oil shale of the Green River Formation in Colorado, Utah, and Wyoming in the United States. Energy companies such as Syncrude and Suncor have been extracting bitumen for decades but production has increased greatly in recent years with the development of steam-assisted gravity drainage and other extraction technologies.

Chuck Masters of the USGS estimates that, "Taken together, these resource occurrences, in the Western Hemisphere, are approximately equal to the Identified Reserves of conventional crude oil accredited to the Middle East." Authorities familiar with the resources believe that the world's ultimate reserves of unconventional oil are several times as large as those of conventional oil and will be highly profitable for companies as a result of higher prices in the 21st century. In October 2009, the USGS updated the Orinoco tar sands (Venezuela) recoverable "mean value" to 513 billion barrels (8.16×10¹⁰ m3), with a 90% chance of being within the range of 380-652 billion barrels (103.7×10⁹ m3), making this area "one of the world's largest recoverable oil accumulations".

Unconventional resources are much larger than conventional ones.

Despite the large quantities of oil available in non-conventional sources, Matthew Simmons argued in 2005 that limitations on production prevent them from becoming an effective substitute for conventional crude oil. Simmons stated "these are high energy intensity projects that can never reach high volumes" to offset significant losses from other sources. Another study claims that even under highly optimistic assumptions, "Canada's oil sands will not prevent peak oil", although production could reach 5,000,000 bbl/d (790,000 m3/d) by 2030 in a "crash program" development effort.

Moreover, oil extracted from these sources typically contains contaminants such as sulfur and heavy metals that are energy-intensive to extract and can leave tailings, ponds containing hydrocarbon sludge, in some cases. The same applies to much of the Middle East's undeveloped conventional oil reserves, much of which is heavy, viscous, and contaminated with sulfur and metals to the point of being unusable. However, high oil prices make these sources more financially appealing. A study by Wood Mackenzie suggests that by the early 2020s all the world's extra oil supply is likely to come from unconventional sources.

Production

The point in time when peak global oil production occurs defines peak oil. Some adherents of 'peak oil' believe that production capacity will remain the main limitation of supply, and that when production decreases, it will be the main bottleneck to the petroleum supply/demand equation. Others believe that the increasing industrial effort to extract oil will have a negative effect on global economic growth, leading to demand contraction and a price collapse, thereby causing production decline as some unconventional sources become uneconomical. Yet others believe that the peak may be to some extent led by declining demand as new technologies and improving efficiency shift energy usage away from oil.

Worldwide oil discoveries have been less than annual production since 1980. World population has grown faster than oil production. Because of this, oil production per capita peaked in 1979 (preceded by a plateau during the period of 1973–1979).

Countries producing oil 2013, bbl/day (CIA World Factbook)
 
Oil producing countries (information from 2006 to 2012)

The increasing investment in harder-to-reach oil as of 2005 was said to signal oil companies' belief in the end of easy oil. While it is widely believed that increased oil prices spur an increase in production, an increased number of oil industry insiders believed in 2008 that even with higher prices, oil production was unlikely to increase significantly. Among the reasons cited were both geological factors as well as "above ground" factors that are likely to see oil production plateau.

A 2008 Journal of Energy Security analysis of the energy return on drilling effort (energy returned on energy invested, also referred to as EROEI) in the United States concluded that there was extremely limited potential to increase production of both gas and (especially) oil. By looking at the historical response of production to variation in drilling effort, the analysis showed very little increase of production attributable to increased drilling. This was because of diminishing returns with increasing drilling effort: as drilling effort increased, the energy obtained per active drill rig in the past had been reduced according to a severely diminishing power law. The study concluded that even an enormous increase of drilling effort was unlikely to significantly increase oil and gas production in a mature petroleum region such as the United States. However, contrary to the study's conclusion, since the analysis was published in 2008, US production of crude oil has more than doubled, increasing 119%, and production of dry natural gas has increased 51% (2018 compared to 2008).

The previous assumption of inevitable declining volumes of oil and gas produced per unit of effort is contrary to recent experience in the US. In the United States, as of 2017, there has been an ongoing decade-long increase in the productivity of oil and gas drilling in all the major tight oil and gas plays. The US Energy Information Administration reports, for instance, that in the Bakken Shale production area of North Dakota, the volume of oil produced per day of drilling rig time in January 2017 was 4 times the oil volume per day of drilling five years previous, in January 2012, and nearly 10 times the oil volume per day of ten years previous, in January 2007. In the Marcellus gas region of the northeast, The volume of gas produced per day of drilling time in January 2017 was 3 times the gas volume per day of drilling five years previous, in January 2012, and 28 times the gas volume per day of drilling ten years previous, in January 2007.

Anticipated production by major agencies

Crude oil export treemap (2012) from Harvard Atlas of Economic Complexity[126]

Average yearly gains in global supply from 1987 to 2005 were 1.2 million barrels per day (190×103 m3/d) (1.7%). In 2005, the IEA predicted that 2030 production rates would reach 120,000,000 barrels per day (19,000,000 m3/d), but this number was gradually reduced to 105,000,000 barrels per day (16,700,000 m3/d). A 2008 analysis of IEA predictions questioned several underlying assumptions and claimed that a 2030 production level of 75,000,000 barrels per day (11,900,000 m3/d) (comprising 55,000,000 barrels (8,700,000 m3) of crude oil and 20,000,000 barrels (3,200,000 m3) of both non-conventional oil and natural gas liquids) was more realistic than the IEA numbers. More recently, the EIA's Annual Energy Outlook 2015 indicated no production peak out to 2040. However, this required a future Brent crude oil price of $US144/bbl (2013 dollars) "as growing demand leads to the development of more costly resources". Whether the world economy can grow and maintain demand for such a high oil price remains to be seen.

Oil field decline

Alaska's oil production has declined 70% since peaking in 1988

In a 2013 study of 733 giant oil fields, only 32% of the ultimately recoverable oil, condensate and gas remained. Ghawar, which is the largest oil field in the world and responsible for approximately half of Saudi Arabia's oil production over the last 50 years, was in decline before 2009. The world's second largest oil field, the Burgan Field in Kuwait, entered decline in November 2005.

Mexico announced that production from its giant Cantarell Field began to decline in March 2006, reportedly at a rate of 13% per year. Also in 2006, Saudi Aramco Senior Vice President Abdullah Saif estimated that its existing fields were declining at a rate of 5% to 12% per year. According to a study of the largest 811 oilfields conducted in early 2008 by Cambridge Energy Research Associates, the average rate of field decline is 4.5% per year. The Association for the Study of Peak Oil and Gas agreed with their decline rates, but considered the rate of new fields coming online overly optimistic. The IEA stated in November 2008 that an analysis of 800 oilfields showed the decline in oil production to be 6.7% a year for fields past their peak, and that this would grow to 8.6% in 2030. A more rapid annual rate of decline of 5.1% in 800 of the world's largest oil fields weighted for production over their whole lives was reported by the International Energy Agency in their World Energy Outlook 2008. The 2013 study of 733 giant fields mentioned previously had an average decline rate 3.83% which was described as "conservative."

Control over supply

Entities such as governments or cartels can reduce supply to the world market by limiting access to the supply through nationalizing oil, cutting back on production, limiting drilling rights, imposing taxes, etc. International sanctions, corruption, and military conflicts can also reduce supply.

Nationalization of oil supplies

Another factor affecting global oil supply is the nationalization of oil reserves by producing nations. The nationalization of oil occurs as countries begin to deprivatize oil production and withhold exports. Kate Dourian, Platts' Middle East editor, points out that while estimates of oil reserves may vary, politics have now entered the equation of oil supply. "Some countries are becoming off limits. Major oil companies operating in Venezuela find themselves in a difficult position because of the growing nationalization of that resource. These countries are now reluctant to share their reserves."

According to consulting firm PFC Energy, only 7% of the world's estimated oil and gas reserves are in countries that allow companies like ExxonMobil free rein. Fully 65% are in the hands of state-owned companies such as Saudi Aramco, with the rest in countries such as Russia and Venezuela, where access by Western European and North American companies is difficult. The PFC study implies political factors are limiting capacity increases in Mexico, Venezuela, Iran, Iraq, Kuwait, and Russia. Saudi Arabia is also limiting capacity expansion, but because of a self-imposed cap, unlike the other countries. As a result of not having access to countries amenable to oil exploration, ExxonMobil is not making nearly the investment in finding new oil that it did in 1981.

OPEC influence on supply

OPEC surplus crude oil production capacity, 2002–2012 (US EIA)

OPEC is an alliance among 14 diverse oil-producing countries (as of January 2019: Algeria, Angola, Ecuador, Equatorial Guinea, Gabon, Iran, Iraq, Kuwait, Libya, Nigeria, Republic of the Congo, Saudi Arabia, United Arab Emirates, Venezuela) to manage the supply of oil. OPEC's power was consolidated in the 1960s and 1970s as various countries nationalized their oil holdings, and wrested decision-making away from the "Seven Sisters" (Anglo-Iranian, Socony, Royal Dutch Shell, Gulf, Esso, Texaco, Socal), and created their own oil companies to control the oil. OPEC often tries to influence prices by restricting production. It does this by allocating each member country a quota for production. Members agree to keep prices high by producing at lower levels than they otherwise would. There is no way to enforce adherence to the quota, so each member has an individual incentive to "cheat" the cartel.

Commodities trader Raymond Learsy, author of Over a Barrel: Breaking the Middle East Oil Cartel, contends that OPEC has trained consumers to believe that oil is a much more finite resource than it is. To back his argument, he points to past false alarms and apparent collaboration. He also believes that peak oil analysts have conspired with OPEC and the oil companies to create a "fabricated drama of peak oil" to drive up oil prices and profits; oil had risen to a little over $30/barrel at that time. A counter-argument was given in the Huffington Post after he and Steve Andrews, co-founder of ASPO, debated on CNBC in June 2007.

Predictions

Pub. Made by Peak year/range Pub. Made by Peak year/range
1972 Esso About 2000 1999 Parker 2040
1972 United Nations By 2000 2000 A. A. Bartlett 2004 or 2019
1974 Hubbert 1991–2000 2000 Duncan 2006
1976 UK Dep. of Energy About 2000 2000 EIA 2021–2067; 2037 most likely
1977 Hubbert 1996 2000 EIA (WEO) Beyond 2020
1977 Ehrlich, et al. 2000 2001 Deffeyes 2003–2008
1979 Shell Plateau by 2004 2001 Goodstein 2007
1981 World Bank Plateau around 2000 2002 Smith 2010–2016
1985 J. Bookout 2020 2002 Campbell 2010
1989 Campbell 1989 2002 Cavallo 2025–2028
1994 L. F. Ivanhoe OPEC plateau 2000–2050 2003 Greene, et al. 2020–2050
1995 Petroconsultants 2005 2003 Laherrère 2010–2020
1997 Ivanhoe 2010 2003 Lynch No visible peak
1997 J. D. Edwards 2020 2003 Shell After 2025
1998 IEA 2014 2003 Simmons 2007–2009
1998 Campbell & Laherrère 2004 2004 Bakhitari 2006–2007
1999 Campbell 2010 2004 CERA After 2020
1999 Peter Odell 2060 2004 PFC Energy 2015–2020
A selection of estimates of the year of peak world oil production, compiled by the United States Energy Information Administration

In 1962, Hubbert predicted that world oil production would peak at a rate of 12.5 billion barrels per year, around the year 2000. In 1974, Hubbert predicted that peak oil would occur in 1995 "if current trends continue". Those predictions proved incorrect. A number of industry leaders and analysts believe that world oil production will peak between 2015 and 2030, with a significant chance that the peak will occur before 2020. They consider dates after 2030 implausible. By comparison, a 2014 analysis of production and reserve data predicted a peak in oil production about 2035. Determining a more specific range is difficult due to the lack of certainty over the actual size of world oil reserves. Unconventional oil is not currently predicted to meet the expected shortfall even in a best-case scenario. For unconventional oil to fill the gap without "potentially serious impacts on the global economy", oil production would have to remain stable after its peak, until 2035 at the earliest.

Papers published since 2010 have been relatively pessimistic. A 2010 Kuwait University study predicted production would peak in 2014. A 2010 Oxford University study predicted that production would peak before 2015, but its projection of a change soon "... from a demand-led market to a supply constrained market ..." was incorrect. A 2014 validation of a significant 2004 study in the journal Energy proposed that it is likely that conventional oil production peaked, according to various definitions, between 2005 and 2011. A set of models published in a 2014 Ph.D. thesis predicted that a 2012 peak would be followed by a drop in oil prices, which in some scenarios could turn into a rapid rise in prices thereafter. According to energy blogger Ron Patterson, the peak of world oil production was probably around 2010.

Major oil companies hit peak production in 2005. Several sources in 2006 and 2007 predicted that worldwide production was at or past its maximum. However, in 2013 OPEC's figures showed that world crude oil production and remaining proven reserves were at record highs. According to Matthew Simmons, former Chairman of Simmons & Company International and author of Twilight in the Desert: The Coming Saudi Oil Shock and the World Economy, "peaking is one of these fuzzy events that you only know clearly when you see it through a rear view mirror, and by then an alternate resolution is generally too late."

Possible consequences

The wide use of fossil fuels has been one of the most important stimuli of economic growth and prosperity since the industrial revolution, allowing humans to participate in takedown, or the consumption of energy at a greater rate than it is being replaced. Some believe that when oil production decreases, human culture and modern technological society will be forced to change drastically. The impact of peak oil will depend heavily on the rate of decline and the development and adoption of effective alternatives.

In 2005, the United States Department of Energy published a report titled Peaking of World Oil Production: Impacts, Mitigation, & Risk Management. Known as the Hirsch report, it stated, "The peaking of world oil production presents the U.S. and the world with an unprecedented risk management problem. As peaking is approached, liquid fuel prices and price volatility will increase dramatically, and, without timely mitigation, the economic, social, and political costs will be unprecedented. Viable mitigation options exist on both the supply and demand sides, but to have substantial impact, they must be initiated more than a decade in advance of peaking." Some of the information was updated in 2007.

Oil prices

Historical oil prices

Long-term oil prices, 1861–2015 (top line adjusted for inflation)

The oil price historically was comparatively low until the 1973 oil crisis and the 1979 energy crisis when it increased more than tenfold during that six-year timeframe. Even though the oil price dropped significantly in the following years, it has never come back to the previous levels. Oil price began to increase again during the 2000s until it hit historical heights of $143 per barrel (2007 inflation adjusted dollars) on 30 June 2008. As these prices were well above those that caused the 1973 and 1979 energy crises, they contributed to fears of an economic recession similar to that of the early 1980s.

It is generally agreed that the main reason for the price spike in 2005–2008 was strong demand pressure. For example, global consumption of oil rose from 30 billion barrels (4.8×10⁹ m3) in 2004 to 31 billion in 2005. The consumption rates were far above new discoveries in the period, which had fallen to only eight billion barrels of new oil reserves in new accumulations in 2004.

Asset write downs for oil companies 2015

Oil price increases were partially fueled by reports that petroleum production is at or near full capacity. In June 2005, OPEC stated that they would 'struggle' to pump enough oil to meet pricing pressures for the fourth quarter of that year. From 2007 to 2008, the decline in the U.S. dollar against other significant currencies was also considered as a significant reason for the oil price increases, as the dollar lost approximately 14% of its value against the Euro from May 2007 to May 2008.

Besides supply and demand pressures, at times security related factors may have contributed to increases in prices, including the War on Terror, missile launches in North Korea, the Crisis between Israel and Lebanon, nuclear brinkmanship between the U.S. and Iran, and reports from the U.S. Department of Energy and others showing a decline in petroleum reserves.

Depicts EIA projections for West Texas Intermediate crude oil price for 2016–2017

More recently, between 2011 and 2014 the price of crude oil was relatively stable, fluctuating around $US 100 per barrel. It dropped sharply in late 2014 to below $US70 where it remained for most of 2015. In early 2016 it traded at a low of $US27. The price drop has been attributed to both oversupply and reduced demand as a result of the slowing global economy, OPEC reluctance to concede market share, and a stronger US dollar. These factors may be exacerbated by a combination of monetary policy and the increased debt of oil producers, who may increase production to maintain liquidity.

The onset of the COVID-19 pandemic resulted in oil prices declining from approximately 60 dollars a barrel to 20 between January and April 2020 and market prices briefly becoming negative. On April 22, 2020 the North Dakota's crude oil spot prices were for Williston Sweet $-46.75 and Williston Sour $-51.31 (oilprice charts). While the WTI was traded $6.46. WTI futures lowest price was above $-37 per barrel on 20 April 2020.

Effects of historical oil price rises

World consumption of primary energy by energy type

In the past, sudden increases in the price of oil have led to economic recessions, such as the 1973 and 1979 energy crises. The effect the increased price of oil has on an economy is known as a price shock. In many European countries, which have high taxes on fuels, such price shocks could potentially be mitigated somewhat by temporarily or permanently suspending the taxes as fuel costs rise. This method of softening price shocks is less useful in countries with much lower gas taxes, such as the United States. A baseline scenario for a recent IMF paper found oil production growing at 0.8% (as opposed to a historical average of 1.8%) would result in a small reduction in economic growth of 0.2–0.4%.

Researchers at the Stanford Energy Modeling Forum found that the economy can adjust to steady, gradual increases in the price of crude better than wild lurches.

Some economists predict that a substitution effect will spur demand for alternate energy sources, such as coal or liquefied natural gas. This substitution can be only temporary, as coal and natural gas are finite resources as well.

Prior to the run-up in fuel prices, many motorists opted for larger, less fuel-efficient sport utility vehicles and full-sized pickups in the United States, Canada, and other countries. This trend has been reversing because of sustained high prices of fuel. The September 2005 sales data for all vehicle vendors indicated SUV sales dropped while small cars sales increased. Hybrid and diesel vehicles are also gaining in popularity.

EIA published Household Vehicles Energy Use: Latest Data and Trends in Nov 2005 illustrating the steady increase in disposable income and $20–30 per barrel price of oil in 2004. The report notes "The average household spent $1,520 on fuel purchases for transport." According to CNBC that expense climbed to $4,155 in 2011.

In 2008, a report by Cambridge Energy Research Associates stated that 2007 had been the year of peak gasoline usage in the United States, and that record energy prices would cause an "enduring shift" in energy consumption practices. The total miles driven in the U.S. peaked in 2006.

The Export Land Model states that after peak oil petroleum exporting countries will be forced to reduce their exports more quickly than their production decreases because of internal demand growth. Countries that rely on imported petroleum will therefore be affected earlier and more dramatically than exporting countries. Mexico is already in this situation. Internal consumption grew by 5.9% in 2006 in the five biggest exporting countries, and their exports declined by over 3%. It was estimated that by 2010 internal demand would decrease worldwide exports by 2,500,000 barrels per day (400,000 m3/d).

Canadian economist Jeff Rubin has stated that high oil prices are likely to result in increased consumption in developed countries through partial manufacturing de-globalisation of trade. Manufacturing production would move closer to the end consumer to minimise transportation network costs, and therefore a demand decoupling from gross domestic product would occur. Higher oil prices would lead to increased freighting costs and consequently, the manufacturing industry would move back to the developed countries since freight costs would outweigh the current economic wage advantage of developing countries. Economic research carried out by the International Monetary Fund puts overall price elasticity of demand for oil at −0.025 short-term and −0.093 long term.

Agricultural effects and population limits

Since supplies of oil and gas are essential to modern agriculture techniques, a fall in global oil supplies could cause spiking food prices and unprecedented famine in the coming decades. Geologist Dale Allen Pfeiffer contends that current population levels are unsustainable, and that to achieve a sustainable economy and avert disaster the United States population would have to be reduced by at least one-third, and world population by two-thirds.

The largest consumer of fossil fuels in modern agriculture is ammonia production (for fertilizer) via the Haber process, which is essential to high-yielding intensive agriculture. The specific fossil fuel input to fertilizer production is primarily natural gas, to provide hydrogen via steam reforming. Given sufficient supplies of renewable electricity, hydrogen can be generated without fossil fuels using methods such as electrolysis. For example, the Vemork hydroelectric plant in Norway used its surplus electricity output to generate renewable ammonia from 1911 to 1971.

Iceland currently generates ammonia using the electrical output from its hydroelectric and geothermal power plants, because Iceland has those resources in abundance while having no domestic hydrocarbon resources, and a high cost for importing natural gas.

Long-term effects on lifestyle

World transport energy use by fuel type 2012

A majority of Americans live in suburbs, a type of low-density settlement designed around universal personal automobile use. Commentators such as James Howard Kunstler argue that because over 90% of transportation in the U.S. relies on oil, the suburbs' reliance on the automobile is an unsustainable living arrangement. Peak oil would leave many Americans unable to afford petroleum based fuel for their cars, and force them to use other forms of transportation such as bicycles or electric vehicles. Additional options include telecommuting, moving to rural areas, or moving to higher density areas, where walking and public transportation are more viable options. In the latter two cases, suburbs may become the "slums of the future." The issue of petroleum supply and demand is also a concern for growing cities in developing countries (where urban areas are expected to absorb most of the world's projected 2.3 billion population increase by 2050). Stressing the energy component of future development plans is seen as an important goal.

Rising oil prices, if they occur, would also affect the cost of food, heating, and electricity. A high amount of stress would then be put on current middle to low income families as economies contract from the decline in excess funds, decreasing employment rates. The Hirsch/US DoE Report concludes that "without timely mitigation, world supply/demand balance will be achieved through massive demand destruction (shortages), accompanied by huge oil price increases, both of which would create a long period of significant economic hardship worldwide."

Methods that have been suggested for mitigating these urban and suburban issues include the use of non-petroleum vehicles such as electric cars, battery electric vehicles, transit-oriented development, carfree cities, bicycles, new trains, new pedestrianism, smart growth, shared space, urban consolidation, urban villages, and New Urbanism.

An extensive 2009 report on the effects of compact development by the United States National Research Council of the Academy of Sciences, commissioned by the United States Congress, stated six main findings. First, that compact development is likely to reduce "Vehicle Miles Traveled" (VMT) throughout the country. Second, that doubling residential density in a given area could reduce VMT by as much as 25% if coupled with measures such as increased employment density and improved public transportation. Third, that higher density, mixed-use developments would produce both direct reductions in CO
2
emissions (from less driving), and indirect reductions (such as from lower amounts of materials used per housing unit, higher efficiency climate control, longer vehicle lifespans, and higher efficiency delivery of goods and services). Fourth, that although short-term reductions in energy use and CO
2
emissions would be modest, that these reductions would become more significant over time. Fifth, that a major obstacle to more compact development in the United States is political resistance from local zoning regulators, which would hamper efforts by state and regional governments to participate in land-use planning. Sixth, the committee agreed that changes in development that would alter driving patterns and building efficiency would have various secondary costs and benefits that are difficult to quantify. The report recommends that policies supporting compact development (and especially its ability to reduce driving, energy use, and CO
2
emissions) should be encouraged.

An economic theory that has been proposed as a remedy is the introduction of a steady state economy. Such a system could include a tax shifting from income to depleting natural resources (and pollution), as well as the limitation of advertising that stimulates demand and population growth. It could also include the institution of policies that move away from globalization and toward localization to conserve energy resources, provide local jobs, and maintain local decision-making authority. Zoning policies could be adjusted to promote resource conservation and eliminate sprawl.

Since aviation relies mainly on jet fuels derived from crude oil, commercial aviation has been predicted to go into decline with the global oil production.

Mitigation

To avoid the serious social and economic implications a global decline in oil production could entail, the Hirsch report emphasized the need to find alternatives, at least ten to twenty years before the peak, and to phase out the use of petroleum over that time. This was similar to a plan proposed for Sweden that same year. Such mitigation could include energy conservation, fuel substitution, and the use of unconventional oil. The timing of mitigation responses is critical. Premature initiation would be undesirable, but if initiated too late could be more costly and have more negative economic consequences.

Global annual crude oil production (including shale oil, oil sands, lease condensate and gas plant condensate but excluding liquid fuels from other sources such as natural gas liquids, biomass and derivatives of coal and natural gas) increased from 75.86 million barrels (12.1 million cubic metres) in 2008 to 83.16 million bbl (13.2 million m3) per day in 2018 with a marginal annual growth rate of 1%. Many developed countries are already able to reduce the petro products consumption derived from crude oil. Crude oil consumption in oil exporting countries (OPEC and non OPEC countries), China and India has increased in last decade. The two major consumers, China (second globally) and India (third globally), are taking many steps not to increase their crude oil consumption by encouraging the renewable energy options. These are the clear cut signs that peak oil production due to declining crude oil consumption (not due to declining availability) is imminent in next few years mandated by alternate cheaper energy means/sources. During the year 2020, the crude oil consumption would decrease from earlier year due to COVID-19 pandemic.

Positive aspects

Permaculture sees peak oil as holding tremendous potential for positive change, assuming countries act with foresight. The rebuilding of local food networks, energy production, and the general implementation of "energy descent culture" are argued to be ethical responses to the acknowledgment of finite fossil resources. Majorca is an island currently diversifying its energy supply from fossil fuels to alternative sources and looking back at traditional construction and permaculture methods.
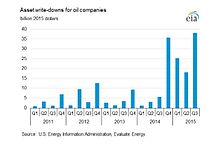
The Transition Towns movement, started in Totnes, Devon and spread internationally by "The Transition Handbook" (Rob Hopkins) and Transition Network, sees the restructuring of society for more local resilience and ecological stewardship as a natural response to the combination of peak oil and climate change.

Criticisms

General arguments

The theory of peak oil is controversial and became an issue of political debate in the US and Europe in the mid-2000s. Critics argued that newly found oil reserves forestalled a peak oil event. Some argued that oil production from new oil reserves and existing fields will continue to increase at a rate that outpaces demand, until alternate energy sources for current fossil fuel dependence are found. In 2015, analysts in the petroleum and financial industries claimed that the "age of oil" had already reached a new stage where the excess supply that appeared in late 2014 may continue. A consensus was emerging that parties to an international agreement would introduce measures to constrain the combustion of hydrocarbons in an effort to limit global temperature rise to the nominal 2 °C that scientists predicted would limit environmental harm to tolerable levels.

Another argument against the peak oil theory is reduced demand from various options and technologies substituting oil. US federal funding to develop algae fuels increased since 2000 due to rising fuel prices. Many other projects are being funded in Australia, New Zealand, Europe, the Middle East, and elsewhere and private companies are entering the field.

Oil industry representatives

The president of Royal Dutch Shell's US operations John Hofmeister, while agreeing that conventional oil production would soon start to decline, criticized the analysis of peak oil theory by Matthew Simmons for being "overly focused on a single country: Saudi Arabia, the world's largest exporter and OPEC swing producer." Hofmeister pointed to the large reserves at the US outer continental shelf, which held an estimated 100 billion barrels (16×109 m3) of oil and natural gas. However, only 15% of those reserves were currently exploitable, a good part of that off the coasts of Texas, Louisiana, Mississippi, and Alabama.

Hofmeister also pointed to unconventional sources of oil such as the oil sands of Canada, where Shell was active. The Canadian oil sands—a natural combination of sand, water, and oil found largely in Alberta and Saskatchewan—are believed to contain one trillion barrels of oil. Another trillion barrels are also said to be trapped in rocks in Colorado, Utah, and Wyoming, in the form of oil shale. Environmentalists argue that major environmental, social, and economic obstacles would make extracting oil from these areas excessively difficult. Hofmeister argued that if oil companies were allowed to drill more in the United States enough to produce another 2 million barrels per day (320×103 m3/d), oil and gas prices would not be as high as they were in the late 2000s. He thought in 2008 that high energy prices would cause social unrest similar to the 1992 Rodney King riots.

In 2009, Dr. Christof Rühl, chief economist of BP, argued against the peak oil hypothesis:

Physical peak oil, which I have no reason to accept as a valid statement either on theoretical, scientific or ideological grounds, would be insensitive to prices. ... In fact the whole hypothesis of peak oil – which is that there is a certain amount of oil in the ground, consumed at a certain rate, and then it's finished – does not react to anything ... Therefore there will never be a moment when the world runs out of oil because there will always be a price at which the last drop of oil can clear the market. And you can turn anything into oil if you are willing to pay the financial and environmental price ... (Global Warming) is likely to be more of a natural limit than all these peak oil theories combined. ... Peak oil has been predicted for 150 years. It has never happened, and it will stay this way.

— Dr. Christof Rühl, BP

Rühl argued that the main limitations for oil availability are "above ground" factors such as the availability of staff, expertise, technology, investment security, funds, and global warming, and that the oil question was about price and not the physical availability.

In 2008, Daniel Yergin of CERA suggest that a recent high price phase might add to a future demise of the oil industry, not of complete exhaustion of resources or an apocalyptic shock but the timely and smooth setup of alternatives. Yergin went on to say, "This is the fifth time that the world is said to be running out of oil. Each time-whether it was the 'gasoline famine' at the end of WWI or the 'permanent shortage' of the 1970s-technology and the opening of new frontier areas have banished the spectre of decline. There's no reason to think that technology is finished this time."

In 2006, Clive Mather, CEO of Shell Canada, said the Earth's supply of bitumen hydrocarbons was "almost infinite", referring to hydrocarbons in oil sands.

Others

In 2006 attorney and mechanical engineer Peter W. Huber asserted that the world was just running out of "cheap oil", explaining that as oil prices rise, unconventional sources become economically viable. He predicted that, "[t]he tar sands of Alberta alone contain enough hydrocarbon to fuel the entire planet for over 100 years."

Environmental journalist George Monbiot responded to a 2012 report by Leonardo Maugeri by suggesting that there is more than enough oil (from unconventional sources) for capitalism to "deep-fry" the world with climate change. Stephen Sorrell, senior lecturer Science and Technology Policy Research, Sussex Energy Group, and lead author of the UKERC Global Oil Depletion report, and Christophe McGlade, doctoral researcher at the UCL Energy Institute have criticized Maugeri's assumptions about decline rates.

Peakists

In the first decade of the twenty-first century, primarily in the United States, widespread beliefs in the imminence of peak oil led to the formation of a large subculture of "peakists" who transformed their lives in response to their belief in and expectation of supply-driven (i.e. resource-constrained) peak oil. They met at national and regional conferences. They also discussed and planned for life after oil, long before this became a regular topic of discussion in regards to climate change.

Researchers estimate that at the peak of this subculture there were over 100,000 hard-core "peakists" in the United States. The popularity of this subculture started to diminish around 2013, as a dramatic peak did not arrive, and as "unconventional" fossil fuels (such as tar sands and natural gas via hydrofracking) seemed to pick up the slack in the context of declines in "conventional" petroleum.

Political psychology

From Wikipedia, the free encyclopedia ...