Search This Blog

Saturday, November 5, 2022

Built environment

From Wikipedia, the free encyclopedia
 
Part of the built environment: suburban tract housing in Colorado Springs, Colorado.

In urban planning, architecture, human geography, landscape architecture, and civil engineering, the term built environment, or built world, refers to the human-made environment that provides the setting for human activity, including homes, buildings, zoning, streets, sidewalks, open spaces, transportation options, and more. It is defined as "the human-made space in which people live, work, and recreate on a day-to-day basis."

The built environment is most relevant in the fields of architecture, landscape architecture, urban planning, public health, sociology, and anthropology, among others.

High-rise structures and major highway infrastructure as an example of the built environment in Dubai, UAE.

The built environment is made up of physical features. However, when studied, the built environment often highlights the connection between physical space and social consequences. It impacts how society physically maneuvers and functions, as well as less tangible aspects of society such as socioeconomic inequity. The topic of the built environment also includes the ways in which communities have approached environmental issues that have arisen as a result of the altering of the natural environment for human activities. Various aspects of the built environment contribute to scholarship on housing and segregation, physical activity, food access, climate change, and environmental racism.

History

The term "built environment" places the concept in direct contrast to the supposedly "unbuilt" environment. However, taking a long-term perspective, the distinction between built and unbuilt become less clear because of the significant effect of human activity on the natural environment—whether through "clearing, terracing, ditching, planting, harvesting, fires" or from "accumulated layers of roads, bridges, dams, and buildings."

Early concepts of the built environment in urban contexts date to Classical Antiquity: Hippodamus of Miletos, known as the "father of urban planning", developed Greek cities from 498 BC to 408 BC that created order by using grid plans that arranged the city in a more structured pattern. These early city plans eventually gave way to the City Beautiful movement in the late 1800s and early 1900s, inspired by Daniel Hudson Burnham, a reformist for the Progressivism movement who actively promoted "a reform of the landscape in tandem with political change." The effort was in partnership with others who believed that beautifying American cities would improve the moral compass of the cities and encourage the upper class to spend their money in cities. This beautification process included grand baroque parks and European-inspired architectural design to emphasize ideals of European culture as a supposed improvement to society. By mid-19th century, modernist or "indifferent" design influenced the character of work and public spaces, followed by a late twentieth century "revival of interest relating to the concept of place (including the built environment), and its relevance to mental health and other fields of study."

The built environment has significant social implications as well as physical ones. Concern with the built environment can be found in anthropological literature as early as the early 19th century in studies of social and cultural history. Early theories recognized that shelter and city organization was not only utilitarian, but reflected the culture of the societies that erected it. Durkheim, a foundational sociological theorist, similarly recognized that spatial organization is both a product of social factors but also plays a role in reproducing social forms.

Modern built environment

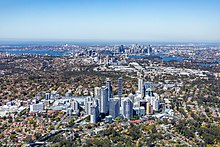
Aerial view of Chatswood, Australia, looking toward Sydney. The boundaries between low density residential, commercial and industrial zones are clearly visible.

Currently, the built environment is typically used to describe the interdisciplinary field that encompasses the design, construction, management, and use of man-made physical influence as an interrelated whole. The concept also includes the relationship of these elements of the built environment with human activities over time—rather than a particular element in isolation or at a single moment in time, these aspects act together via the multiplier effect. The field is generally not regarded as a traditional profession or academic discipline in its own right, instead, it draws upon areas such as economics, law, public policy, sociology, anthropology, public health, management, geography, design, engineering, technology, and environmental sustainability. Within the field of public health, built environments are referred to as building or renovating areas in an effort to improve the community's well-being through construction of “aesthetically, health improved, and environmentally improved landscapes and living structures”. For example: a community forest user group in Nepal is a multidimensional institution, which provides goods and services to local communities through natural resource management (see Climate change adaptation in Nepal).

Technology is playing a pivotal role in shaping the industries of today by augmenting processes, streamlining activities, and integrating innovations to propel the functioning of companies and organizations across a multitude of industries and help them achieve new heights. Building information modeling is prominent practice. It involves illustration & pre-execution overview of the physical and functional characteristics of places. BIM tools help the planner in making a future ready informed decision regarding a building or other built asset. Smart Building Management, Drone-based Surveying, 3D Printing, and Intelligent Transportation System are recent implementations of technology that serve as proof that the modern built environment is not always physically influenced in the digital age.

Prominent features of the built environment

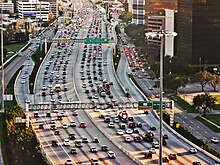
Highway 610 in Houston, Texas

Transportation options

Transportation options within a community play a large role in communities, both socially and physically. These options can include roads, sidewalks, and public transportation infrastructure.

Roads and highways

Roads allow pedestrians and people operating vehicles (whether cars, buses, motorcycles, or bicycles) to reliably access all areas of an urban or regional space. For millennia, road systems have served as the veins of urban spaces, allowing people to travel efficiently between areas within a city or region. Roads circulate people and materials throughout cities, just as "the cardiovascular network distributes energy and materials to cells." Without well-planned roadways, cities operate as collections of smaller isolated neighborhoods with little movement between them to stimulate city-wide economic growth and the socioeconomic mobility of households. While primarily intended to promote transit, can also serve as physical barriers in the built environment. One study out of Cornell University used U.S. Census data to compare the differences between linear distance and distance-by-road in American cities. The results found that road distance was disproportionately high between clusters of different racial groups, while it is much closer to linear distance within neighborhood clusters. Major roadways can also divide social space by reducing walkability and separating business from residential areas.

Sidewalks

New York City subway map

Sidewalks are an important feature of the built environment that enable pedestrian mobility and increase walkability. Urban road networks used to be primarily a place for the pedestrian, but have become increasingly dominated by automobiles. The city sidewalk, therefore, is a place safe for bipedal commuters. The quality and service of sidewalks can be impacted by factors like police patrolling, cleanliness, obstructions, and damage to the surface such as cracks. Walkable neighborhoods are proven to be safer and more accessible, with the presence of many pedestrians creating a watchful community. Businesses also benefit from increased foot-traffic near their establishments that encourages people to stop and shop more frequently than if they were driving past the store.

Public transportation

Public transportation is an essential part of urban spaces and the built environment. Public transport raises property values by improving access to surrounding resources, lowers the cost of living by reducing the need for a car, and improves an area's environmental footprint by reducing carbon-rich greenhouse gas emissions. Studies show that land use and transit infrastructure has a great impact on the use of public transit in cities globally. Individuals' decisions to either drive, walk, bike, or use public transit are shown to be influenced by spatial factors such as density.

Research also shows that the availability and nature of bike lanes and trails impacts cyclist numbers and behavior. When the proper infrastructure is implemented, residents are likely to utilize the amenity. However, the construction of bike lanes in America has sometimes been recognized as a symbol of gentrification, as it attracts younger white residents and impacts a location's demographics because of the benefits to the neighborhood.

Buildings

At their most basic level, buildings are used as spaces of shelter for residential and business uses. They are one of the most clear elements of the built environment because of their physical presence and purpose to protect against the natural or "un-built" environment. The location, design, and layout of buildings all have an impact on the function and effectiveness of a building's service as an aspect of the built environment. A building's location can influence its function, and how frequently it is used by people. Additionally, the design of indoor space, as determined by architects and designers, has a great impact on how the space functions and the behavior it promotes.

Parks and green space

The Esplanade Park (Esplanadi) in the city center of Helsinki, Finland

Parks provide a number of neighborhood benefits including promotion of physical activity and environmental wellbeing. The location and accessibility of parks also has a great positive influence on the surrounding communities. For example, the addition green spaces to urban space can combat air pollution, provide a break from otherwise monotonous urban networks, and even impact city-wide temperatures by reducing the Heat-island effect.

Impact of the built environment

Housing and segregation

Features in the built environment present physical barriers which constitute the boundaries between neighborhoods. Roads and railways, for instance, play a large role in how people can feasibly navigate their environment. This can result in the isolation of certain communities from various resources and from each other. The placement of roads, highways, and sidewalks also determines what access people have to jobs and childcare close to home, especially in areas where most people do not own vehicles. Walkability directly influences community, so the way a neighborhood is built affects the outcomes and opportunities of the community that lives there. Even less physically imposing features, such as architectural design, can distinguish the boundaries between communities and decrease movement across neighborhood lines.

The segregation of communities is significant because the qualities of any given space directly impact the wellbeing of the people who live and work there. George Galster and Patrick Sharkey refer to this variation in geographic context as "spatial opportunity structure," and claim that the built environment influences socioeconomic outcomes and general welfare. For instance, the history of redlining and housing segregation means that there is less green space in many Black and Hispanic neighborhoods. Access to parks and green space has been proven to be good for mental health which puts these communities at a disadvantage. The historical segregation has contributed to environmental injustice, as these neighborhoods suffer from hotter summers since urban asphalt absorbs more heat than trees and grass. The effects of spacial segregation initiatives in the built environment, such as redlining in the 1930s and 1940s, are long lasting. The inability to feasibly move from forcibly economically depressed areas into more prosperous ones creates fiscal disadvantages that are passed down generationally. With proper public education access tied to the economic prosperity of a neighborhood, many formerly redlined areas continue to lack educational opportunities for residents and, thus, job and higher-income opportunities are limited.

Public health

Historically, action-oriented initiatives to the built environment have often stemmed from issues with public health. Dating back to Georges-Eugene Haussmann's comprehensive plans for urban Paris in the 1850s, concern for lack of air-flow and sanitary living conditions has inspired many strong city planning efforts. Public health research has expanded the list of concerns associated with the built environment to include healthy food access, community gardens, mental health, physical health, walkability, and cycling mobility. Designing areas of cities with good public health is linked to creating opportunities for physical activity, community involvement, and equal opportunity within the built environment. Urban forms that encourage physical activity and provide adequate public resources for involvement and upward mobility are proven to have far healthier populations than those that discourage such uses of the built environment.

Physical activity

Since, the built environment determines how people move throughout a given space, it influences public health by promoting or discouraging health and wellness. Research has indicated that the way neighborhoods are created can affect both the physical activity and mental health of the communities’ residents. Built environments purposefully designed to improve physical activity are also linked to higher rates of physical activity, which in turn, positively affects health. People are generally more active in densely populated areas, areas good street connectivity, and mixed-use communities which incorporate both retail and residential space. As a result, those who prefer to walk and live in walkable environments often have lower obesity rates and drive less compared to those who preferred living in auto-dependent environments.

A separated bike lane in New York City.

Neighborhoods with more walkability have lower rates of obesity, as well as increased physical activity among its residents. They also have lower rates of depression, higher social capital, and less alcohol abuse. Walkability features in these neighborhoods include safety, sidewalk construction, as well as destinations in which to walk. In addition, the perception of a walkable neighborhood, one that is perceived to have good sidewalks and connectivity, is correlated with higher rates of physical activity.

Assessments of walkability have been completed through the use of GIS programs, such as the Street Smart Walk Score. This example of a walkability assessment tool determines distances to grocery stores and other amenities, as well as connectivity and intersection frequency using specific addresses. Assessments such as the Street Smart Walk Score can be utilized by city and country planning departments to improve existing walkability of communities.

To implement walkable neighborhoods, community members and local leaders should focus on policy development. An effective framework that has been utilized in an abundance of communities is the Complete Streets concept of community planning that has been developed by the National Complete Streets Coalition (NCSC). NCSC states that the most successful policies are those that reflect input from a broad group of stakeholders, including transportation planners and engineers, elected officials, transit agencies, public health departments, and members of the community. According to Riggs, 2016, policies may focus on a “Complete Streets” investment, which includes sidewalk bulb-outs and refuges to reduce crossing distances or street widths for pedestrians. Other investments should include installing crosswalks, road markings, benches, shelters and sidewalk art installations. Every community will have a unique method of policy development depending on whether it is an urban, suburban, or rural community and how the policy will combine the variety of transportation modalities. Communities may choose to focus on walkability, but will also need to consider biking, wheeling/rolling, driving, and emergency vehicles. The NCSC policy workbook gives descriptive guidance on how to proceed with policy development whether they be council-driven, council-approved, directives, or citizen vote. When deciding how to proceed with walkability policy development, considerations should be made regarding current and past transportation policies, local community and government support, and how transportation policies have been implemented in the past.

A community garden located in Montreal, Canada.

Public health also addresses additional components of built environments including “cycling mobility”, which refers to the access that an area has granted to safe biking through multiple bike paths and bike lanes. Both walkability and bikeability have been cited as determinants of physical activity.

Built environments containing recreational facilities have been associated with greater physical activity among children. For example, one study found that walking paths, parks with playgrounds, swimming areas, basketball courts and other various recreational facilities increased physical activity among adolescent girls. Urban planning and its utilization of mixed use development are key factors affecting childhood obesity. Mixed use spaces are composed of residential, commercial, cultural, and institutional components. This type of development helps to reduce the distance residents have to travel to access a grocery store or school. It also creates a more walkable and bike friendly environment for residents.

It has been proven that high-density environments, meaning mixed use spaces and neighborhoods with higher walkability and bikeability, will increase physical activity. A multivariable cross-sectional study done by the Harvard School of Public Health examined the association of walkable built environment characteristics with body mass index (BMI) scores among a large sample of children and adolescents. A series of geographic information system variables were used to characterize a walkable built environment.

  1. A distance of less than 15 km to a private or public recreational open space has been linked to an increase in physical activity among children. This may be due to the influence children have on one another when they see others playing.
  2. Also, a higher number of open spaces increases the likelihood of physical activity among children.
  3. A more densely populated residential area can increase children's proximity to their peers creating a more walkable environment.
  4. Less traffic density can also increase physical activity among children because their parents feel safe when they are walking in the neighborhood.
  5. Lower neighborhood speed limits with more sidewalks and intersections also create a safer environment for children increasing their likelihood to walk in the neighborhood.
  6. Finally, a greater variety of land use mix, or mixed use spaces, results in more children walking.

These built environment characteristics that can increase walkability were found to be generally associated with a lower BMI scores among the children sampled. Another study looking at active commuting, those reporting walking, biking, or skateboarding to school more than three times a week, among elementary aged children had significantly lower BMI than non-active commuters. For these reasons, mixed use lands within the built environment are imperative to helping address childhood obesity. Urban sprawl, which has been positively associated with increased obesity, and an overall decline in active transportation in recent decades presents a real need for improving health within the built environment. High-density environments bring schools, parks, and grocery stores closer to residents making it convenient to potentially eat healthier foods and exercise on a regular basis. Comprehensive urban planning, such as mixed use development, promotes healthier lifestyles in general.

The strength of the evidence for reducing obesity through the environment has been highlighted by the Centers for Disease Control in its Common Community Measures for Obesity Prevention Project, which includes measures of healthy food access and physical activity environments. The National Institute for Health and Care Research (NIHR) has published a review of research on public health interventions to reduce obesity. The review covers interventions looking at green spaces, blue spaces, parks, roads, urban regeneration, active travel infrastructure (walk and cycle lanes), public transport, and the food environment (prevalence of food outlets).

Food access

Access to healthy food is also an important component of the built environment. A higher density of convenience stores has been associated with obesity in children. In contrast, improved access to community supermarkets and farmer's markets is correlated with lower overweight status. Specifically in low income neighborhoods, the presence of a local grocery store is correlated with lower BMI/overweight risk. Community gardens are also considered a part of the built environment, and have been shown to increase fruit and vegetable intake among gardeners. Scholars say that community gardens have also been shown to have positive social and psychological impacts that lead to lower levels of stress, hypertension, and an improved sense of wellness, affecting the overall health of the individual and the community.

Urban Metabolism and nature

The embedded presence of the built environment within nature is of considerable importance in its creation and employment for human means. The urban environment is not alien to nature, where "It is in practice, hard to see where 'society' begins and 'nature'  ends'', the built environment's embedded presence is always apparent and considerable in urban planning.

As Nik Heynen describes the conditions of Jakarta's development. In the summer of 1998, the Southeast Asian financial bubble imploded. Global capital moved spasmodically from place to place, leaving cities like Jakarta with a social and physical wasteland where dozens of unfinished skyscrapers were dotted over the landscape while thousands of unemployed children, women, and men were roaming the streets in search of survival. In the meantime, El Niño’s global dynamic was wreaking havoc in the region with its climatic disturbances. Puddles of stagnant water in the defunct concrete buildings that had once promised continuing capital accumulation for Indonesia became great ecological niches for a rapid explosion of mosquitoes. Malaria and Dengue Fever suddenly joined unemployment and social and political mayhem in shaping Jakarta’s cityscape.

— Heynen, Nik & Kaika, Maria & Swyngedouw, Erik., In the Nature of Cities - Urban Political Ecology and The Politics of Urban Metabolism. (2006).

Considering the 'urban metabolism', these interactions remind designers how cities and urban centers exist as "dense networks of interwoven socio-spatial processes that are simultaneously local and global, human and physical, cultural and organic".

Precipitation

From Wikipedia, the free encyclopedia
 
Mean precipitation based on global high resolution climate data (CHELSA)
 
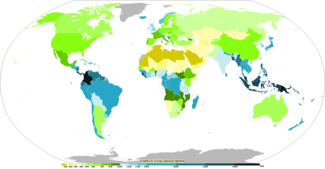
Countries by average annual precipitation. Note that some parts of a country can be much wetter than others, so it is not an accurate depiction of the wettest and driest places on earth.

In meteorology, precipitation is any product of the condensation of atmospheric water vapor that falls under gravitational pull from clouds. The main forms of precipitation include drizzle, rain, sleet, snow, ice pellets, graupel and hail. Precipitation occurs when a portion of the atmosphere becomes saturated with water vapor (reaching 100% relative humidity), so that the water condenses and "precipitates" or falls. Thus, fog and mist are not precipitation but colloids, because the water vapor does not condense sufficiently to precipitate. Two processes, possibly acting together, can lead to air becoming saturated: cooling the air or adding water vapor to the air. Precipitation forms as smaller droplets coalesce via collision with other rain drops or ice crystals within a cloud. Short, intense periods of rain in scattered locations are called showers.

Moisture that is lifted or otherwise forced to rise over a layer of sub-freezing air at the surface may be condensed into clouds and rain. This process is typically active when freezing rain occurs. A stationary front is often present near the area of freezing rain and serves as the focus for forcing and rising air. Provided there is necessary and sufficient atmospheric moisture content, the moisture within the rising air will condense into clouds, namely nimbostratus and cumulonimbus if significant precipitation is involved. Eventually, the cloud droplets will grow large enough to form raindrops and descend toward the Earth where they will freeze on contact with exposed objects. Where relatively warm water bodies are present, for example due to water evaporation from lakes, lake-effect snowfall becomes a concern downwind of the warm lakes within the cold cyclonic flow around the backside of extratropical cyclones. Lake-effect snowfall can be locally heavy. Thundersnow is possible within a cyclone's comma head and within lake effect precipitation bands. In mountainous areas, heavy precipitation is possible where upslope flow is maximized within windward sides of the terrain at elevation. On the leeward side of mountains, desert climates can exist due to the dry air caused by compressional heating. Most precipitation occurs within the tropics and is caused by convection. The movement of the monsoon trough, or intertropical convergence zone, brings rainy seasons to savannah regions.

Precipitation is a major component of the water cycle, and is responsible for depositing fresh water on the planet. Approximately 505,000 cubic kilometres (121,000 cu mi) of water falls as precipitation each year: 398,000 cubic kilometres (95,000 cu mi) over oceans and 107,000 cubic kilometres (26,000 cu mi) over land. Given the Earth's surface area, that means the globally averaged annual precipitation is 990 millimetres (39 in), but over land it is only 715 millimetres (28.1 in). Climate classification systems such as the Köppen climate classification system use average annual rainfall to help differentiate between differing climate regimes. Global warming is already causing changes to weather, increasing precipitation in some geographies, and reducing it in others, resulting in additional extreme weather.

Precipitation may occur on other celestial bodies. Saturn's largest satellite, Titan, hosts methane precipitation as a slow-falling drizzle, which has been observed as Rain puddles at its equator and polar regions.

Types

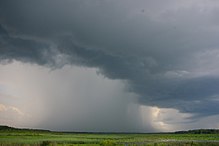
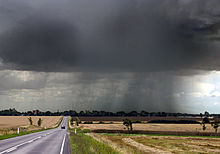
A thunderstorm with heavy precipitation

Precipitation is a major component of the water cycle, and is responsible for depositing most of the fresh water on the planet. Approximately 505,000 km3 (121,000 mi3) of water falls as precipitation each year, 398,000 km3 (95,000 cu mi) of it over the oceans. Given the Earth's surface area, that means the globally averaged annual precipitation is 990 millimetres (39 in).

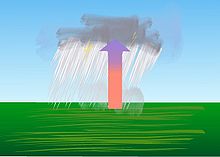
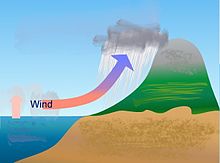
Mechanisms of producing precipitation include convective, stratiform, and orographic rainfall. Convective processes involve strong vertical motions that can cause the overturning of the atmosphere in that location within an hour and cause heavy precipitation, while stratiform processes involve weaker upward motions and less intense precipitation. Precipitation can be divided into three categories, based on whether it falls as liquid water, liquid water that freezes on contact with the surface, or ice. Mixtures of different types of precipitation, including types in different categories, can fall simultaneously. Liquid forms of precipitation include rain and drizzle. Rain or drizzle that freezes on contact within a subfreezing air mass is called "freezing rain" or "freezing drizzle". Frozen forms of precipitation include snow, ice needles, ice pellets, hail, and graupel.

Measurement

Liquid precipitation
Rainfall (including drizzle and rain) is usually measured using a rain gauge and expressed in units of millimeters (mm) of height or depth. Equivalently, it can be expressed as a physical quantity with dimension of volume of water per collection area, in units of liters per square meter (L/m2); as 1L=1dm3=1mm·m2, the units of area (m2) cancel out, resulting in simply "mm". This also corresponds to an area density expressed in kg/m2, if assuming that 1 liter of water has a mass of 1 kg (water density), which is acceptable for most practical purposes. The corresponding English unit used is usually inches. In Australia before metrication, rainfall was measured in "points" which were defined as a hundredth of an inch.
Solid precipitation
A snow gauge is usually used to measure the amount of solid precipitation. Snowfall is usually measured in centimeters by letting snow fall into a container and then measure the height. The snow can then optionally be melted to obtain a water equivalent measurement in millimeters like for liquid precipitation. The relationship between snow height and water equivalent depends on the water content of the snow; the water equivalent can thus only provide a rough estimate of snow depth. Other forms of solid precipitation, such as snow pellets and hail or even sleet (rain and snow mixed), can also be melted and measured as water equivalent, usually expressed millimeters like for liquid precipitation.

How the air becomes saturated

Cooling air to its dew point

Late-summer rainstorm in Denmark
 
Lenticular cloud forming due to mountains over Wyoming

The dew point is the temperature to which a parcel of air must be cooled in order to become saturated, and (unless super-saturation occurs) condenses to water. Water vapor normally begins to condense on condensation nuclei such as dust, ice, and salt in order to form clouds. The cloud condensation nuclei concentration will determine the cloud microphysics. An elevated portion of a frontal zone forces broad areas of lift, which form cloud decks such as altostratus or cirrostratus. Stratus is a stable cloud deck which tends to form when a cool, stable air mass is trapped underneath a warm air mass. It can also form due to the lifting of advection fog during breezy conditions.

There are four main mechanisms for cooling the air to its dew point: adiabatic cooling, conductive cooling, radiational cooling, and evaporative cooling. Adiabatic cooling occurs when air rises and expands. The air can rise due to convection, large-scale atmospheric motions, or a physical barrier such as a mountain (orographic lift). Conductive cooling occurs when the air comes into contact with a colder surface, usually by being blown from one surface to another, for example from a liquid water surface to colder land. Radiational cooling occurs due to the emission of infrared radiation, either by the air or by the surface underneath. Evaporative cooling occurs when moisture is added to the air through evaporation, which forces the air temperature to cool to its wet-bulb temperature, or until it reaches saturation.

Adding moisture to the air

The main ways water vapor is added to the air are: wind convergence into areas of upward motion, precipitation or virga falling from above, daytime heating evaporating water from the surface of oceans, water bodies or wet land, transpiration from plants, cool or dry air moving over warmer water, and lifting air over mountains.

Forms of precipitation

Condensation and coalescence are important parts of the water cycle.

Raindrops

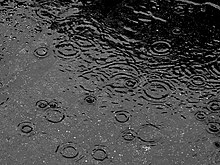
Puddle in the rain

Coalescence occurs when water droplets fuse to create larger water droplets, or when water droplets freeze onto an ice crystal, which is known as the Bergeron process. The fall rate of very small droplets is negligible, hence clouds do not fall out of the sky; precipitation will only occur when these coalesce into larger drops. droplets with different size will have different terminal velocity that cause droplets collision and producing larger droplets, Turbulence will enhance the collision process. As these larger water droplets descend, coalescence continues, so that drops become heavy enough to overcome air resistance and fall as rain.

Raindrops have sizes ranging from 5.1 millimetres (0.20 in) to 20 millimetres (0.79 in) mean diameter, above which they tend to break up. Smaller drops are called cloud droplets, and their shape is spherical. As a raindrop increases in size, its shape becomes more oblate, with its largest cross-section facing the oncoming airflow. Contrary to the cartoon pictures of raindrops, their shape does not resemble a teardrop. Intensity and duration of rainfall are usually inversely related, i.e., high intensity storms are likely to be of short duration and low intensity storms can have a long duration. Rain drops associated with melting hail tend to be larger than other rain drops. The METAR code for rain is RA, while the coding for rain showers is SHRA.

Ice pellets

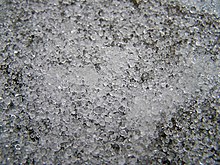
An accumulation of ice pellets

Ice pellets or sleet are a form of precipitation consisting of small, translucent balls of ice. Ice pellets are usually (but not always) smaller than hailstones. They often bounce when they hit the ground, and generally do not freeze into a solid mass unless mixed with freezing rain. The METAR code for ice pellets is PL.

Ice pellets form when a layer of above-freezing air exists with sub-freezing air both above and below. This causes the partial or complete melting of any snowflakes falling through the warm layer. As they fall back into the sub-freezing layer closer to the surface, they re-freeze into ice pellets. However, if the sub-freezing layer beneath the warm layer is too small, the precipitation will not have time to re-freeze, and freezing rain will be the result at the surface. A temperature profile showing a warm layer above the ground is most likely to be found in advance of a warm front during the cold season, but can occasionally be found behind a passing cold front.

Hail

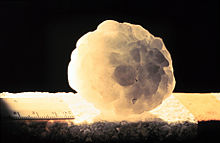
A large hailstone, about 6 centimetres (2.4 in) in diameter

Like other precipitation, hail forms in storm clouds when supercooled water droplets freeze on contact with condensation nuclei, such as dust or dirt. The storm's updraft blows the hailstones to the upper part of the cloud. The updraft dissipates and the hailstones fall down, back into the updraft, and are lifted again. Hail has a diameter of 5 millimetres (0.20 in) or more. Within METAR code, GR is used to indicate larger hail, of a diameter of at least 6.4 millimetres (0.25 in). GR is derived from the French word grêle. Smaller-sized hail, as well as snow pellets, use the coding of GS, which is short for the French word grésil. Stones just larger than golf ball-sized are one of the most frequently reported hail sizes. Hailstones can grow to 15 centimetres (6 in) and weigh more than 500 grams (1 lb). In large hailstones, latent heat released by further freezing may melt the outer shell of the hailstone. The hailstone then may undergo 'wet growth', where the liquid outer shell collects other smaller hailstones. The hailstone gains an ice layer and grows increasingly larger with each ascent. Once a hailstone becomes too heavy to be supported by the storm's updraft, it falls from the cloud.

Snowflakes

Snowflake viewed in an optical microscope

Snow crystals form when tiny supercooled cloud droplets (about 10 μm in diameter) freeze. Once a droplet has frozen, it grows in the supersaturated environment. Because water droplets are more numerous than the ice crystals the crystals are able to grow to hundreds of micrometers in size at the expense of the water droplets. This process is known as the Wegener–Bergeron–Findeisen process. The corresponding depletion of water vapor causes the droplets to evaporate, meaning that the ice crystals grow at the droplets' expense. These large crystals are an efficient source of precipitation, since they fall through the atmosphere due to their mass, and may collide and stick together in clusters, or aggregates. These aggregates are snowflakes, and are usually the type of ice particle that falls to the ground. Guinness World Records list the world's largest snowflakes as those of January 1887 at Fort Keogh, Montana; allegedly one measured 38 cm (15 inches) wide. The exact details of the sticking mechanism remain a subject of research.

Although the ice is clear, scattering of light by the crystal facets and hollows/imperfections mean that the crystals often appear white in color due to diffuse reflection of the whole spectrum of light by the small ice particles. The shape of the snowflake is determined broadly by the temperature and humidity at which it is formed. Rarely, at a temperature of around −2 °C (28 °F), snowflakes can form in threefold symmetry—triangular snowflakes. The most common snow particles are visibly irregular, although near-perfect snowflakes may be more common in pictures because they are more visually appealing. No two snowflakes are alike, as they grow at different rates and in different patterns depending on the changing temperature and humidity within the atmosphere through which they fall on their way to the ground. The METAR code for snow is SN, while snow showers are coded SHSN.

Diamond dust

Diamond dust, also known as ice needles or ice crystals, forms at temperatures approaching −40 °C (−40 °F) due to air with slightly higher moisture from aloft mixing with colder, surface-based air. They are made of simple ice crystals, hexagonal in shape. The METAR identifier for diamond dust within international hourly weather reports is IC.

Occult deposition

Occult deposition occurs when mist or air that is highly saturated with water vapour interacts with the leaves of trees or shrubs it passes over.

Causes

Frontal activity

Stratiform or dynamic precipitation occurs as a consequence of slow ascent of air in synoptic systems (on the order of cm/s), such as over surface cold fronts, and over and ahead of warm fronts. Similar ascent is seen around tropical cyclones outside of the eyewall, and in comma-head precipitation patterns around mid-latitude cyclones. A wide variety of weather can be found along an occluded front, with thunderstorms possible, but usually their passage is associated with a drying of the air mass. Occluded fronts usually form around mature low-pressure areas. Precipitation may occur on celestial bodies other than Earth. When it gets cold, Mars has precipitation that most likely takes the form of ice needles, rather than rain or snow.

Convection

Convective precipitation

Convective rain, or showery precipitation, occurs from convective clouds, e.g. cumulonimbus or cumulus congestus. It falls as showers with rapidly changing intensity. Convective precipitation falls over a certain area for a relatively short time, as convective clouds have limited horizontal extent. Most precipitation in the tropics appears to be convective; however, it has been suggested that stratiform precipitation also occurs. Graupel and hail indicate convection. In mid-latitudes, convective precipitation is intermittent and often associated with baroclinic boundaries such as cold fronts, squall lines, and warm fronts. Convective precipitation mostly consist of mesoscale convective systems and they produce torrential rainfalls with thunderstorms, wind damages, and other forms of severe weather events.

Orographic effects

Orographic precipitation

Orographic precipitation occurs on the windward (upwind) side of mountains and is caused by the rising air motion of a large-scale flow of moist air across the mountain ridge, resulting in adiabatic cooling and condensation. In mountainous parts of the world subjected to relatively consistent winds (for example, the trade winds), a more moist climate usually prevails on the windward side of a mountain than on the leeward or downwind side. Moisture is removed by orographic lift, leaving drier air (see katabatic wind) on the descending and generally warming, leeward side where a rain shadow is observed.

In Hawaii, Mount Waiʻaleʻale, on the island of Kauai, is notable for its extreme rainfall, as it has the second-highest average annual rainfall on Earth, with 12,000 millimetres (460 in). Storm systems affect the state with heavy rains between October and March. Local climates vary considerably on each island due to their topography, divisible into windward (Koʻolau) and leeward (Kona) regions based upon location relative to the higher mountains. Windward sides face the east to northeast trade winds and receive much more rainfall; leeward sides are drier and sunnier, with less rain and less cloud cover.

In South America, the Andes mountain range blocks Pacific moisture that arrives in that continent, resulting in a desertlike climate just downwind across western Argentina. The Sierra Nevada range creates the same effect in North America forming the Great Basin and Mojave Deserts. Similarly, in Asia, the Himalaya mountains create an obstacle to monsoons which leads to extremely high precipitation on the southern side and lower precipitation levels on the northern side.

Snow

Lake-effect snow bands near the Korean Peninsula in early December 2008

Extratropical cyclones can bring cold and dangerous conditions with heavy rain and snow with winds exceeding 119 km/h (74 mph), (sometimes referred to as windstorms in Europe). The band of precipitation that is associated with their warm front is often extensive, forced by weak upward vertical motion of air over the frontal boundary which condenses as it cools and produces precipitation within an elongated band, which is wide and stratiform, meaning falling out of nimbostratus clouds. When moist air tries to dislodge an arctic air mass, overrunning snow can result within the poleward side of the elongated precipitation band. In the Northern Hemisphere, poleward is towards the North Pole, or north. Within the Southern Hemisphere, poleward is towards the South Pole, or south.

Southwest of extratropical cyclones, curved cyclonic flow bringing cold air across the relatively warm water bodies can lead to narrow lake-effect snow bands. Those bands bring strong localized snowfall which can be understood as follows: Large water bodies such as lakes efficiently store heat that results in significant temperature differences (larger than 13 °C or 23 °F) between the water surface and the air above. Because of this temperature difference, warmth and moisture are transported upward, condensing into vertically oriented clouds (see satellite picture) which produce snow showers. The temperature decrease with height and cloud depth are directly affected by both the water temperature and the large-scale environment. The stronger the temperature decrease with height, the deeper the clouds get, and the greater the precipitation rate becomes.

In mountainous areas, heavy snowfall accumulates when air is forced to ascend the mountains and squeeze out precipitation along their windward slopes, which in cold conditions, falls in the form of snow. Because of the ruggedness of terrain, forecasting the location of heavy snowfall remains a significant challenge.

Within the tropics

Rainfall distribution by month in Cairns showing the extent of the wet season at that location

The wet, or rainy, season is the time of year, covering one or more months, when most of the average annual rainfall in a region falls. The term green season is also sometimes used as a euphemism by tourist authorities. Areas with wet seasons are dispersed across portions of the tropics and subtropics. Savanna climates and areas with monsoon regimes have wet summers and dry winters. Tropical rainforests technically do not have dry or wet seasons, since their rainfall is equally distributed through the year. Some areas with pronounced rainy seasons will see a break in rainfall mid-season when the intertropical convergence zone or monsoon trough move poleward of their location during the middle of the warm season. When the wet season occurs during the warm season, or summer, rain falls mainly during the late afternoon and early evening hours. The wet season is a time when air quality improves, freshwater quality improves, and vegetation grows significantly. Soil nutrients diminish and erosion increases. Animals have adaptation and survival strategies for the wetter regime. The previous dry season leads to food shortages into the wet season, as the crops have yet to mature. Developing countries have noted that their populations show seasonal weight fluctuations due to food shortages seen before the first harvest, which occurs late in the wet season.

Tropical cyclones, a source of very heavy rainfall, consist of large air masses several hundred miles across with low pressure at the centre and with winds blowing inward towards the centre in either a clockwise direction (southern hemisphere) or counterclockwise (northern hemisphere). Although cyclones can take an enormous toll in lives and personal property, they may be important factors in the precipitation regimes of places they impact, as they may bring much-needed precipitation to otherwise dry regions. Areas in their path can receive a year's worth of rainfall from a tropical cyclone passage.

Large-scale geographical distribution

On the large scale, the highest precipitation amounts outside topography fall in the tropics, closely tied to the Intertropical Convergence Zone, itself the ascending branch of the Hadley cell. Mountainous locales near the equator in Colombia are amongst the wettest places on Earth. North and south of this are regions of descending air that form subtropical ridges where precipitation is low; the land surface underneath these ridges is usually arid, and these regions make up most of the Earth's deserts. An exception to this rule is in Hawaii, where upslope flow due to the trade winds lead to one of the wettest locations on Earth. Otherwise, the flow of the Westerlies into the Rocky Mountains lead to the wettest, and at elevation snowiest, locations within North America. In Asia during the wet season, the flow of moist air into the Himalayas leads to some of the greatest rainfall amounts measured on Earth in northeast India.

Measurement

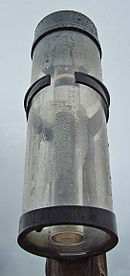
Standard rain gauge

The standard way of measuring rainfall or snowfall is the standard rain gauge, which can be found in 100 mm (4 in) plastic and 200 mm (8 in) metal varieties. The inner cylinder is filled by 25 mm (1 in) of rain, with overflow flowing into the outer cylinder. Plastic gauges have markings on the inner cylinder down to 0.25 mm (0.01 in) resolution, while metal gauges require use of a stick designed with the appropriate 0.25 mm (0.01 in) markings. After the inner cylinder is filled, the amount inside is discarded, then filled with the remaining rainfall in the outer cylinder until all the fluid in the outer cylinder is gone, adding to the overall total until the outer cylinder is empty. These gauges are used in the winter by removing the funnel and inner cylinder and allowing snow and freezing rain to collect inside the outer cylinder. Some add anti-freeze to their gauge so they do not have to melt the snow or ice that falls into the gauge. Once the snowfall/ice is finished accumulating, or as 300 mm (12 in) is approached, one can either bring it inside to melt, or use lukewarm water to fill the inner cylinder with in order to melt the frozen precipitation in the outer cylinder, keeping track of the warm fluid added, which is subsequently subtracted from the overall total once all the ice/snow is melted.

Other types of gauges include the popular wedge gauge (the cheapest rain gauge and most fragile), the tipping bucket rain gauge, and the weighing rain gauge. The wedge and tipping bucket gauges have problems with snow. Attempts to compensate for snow/ice by warming the tipping bucket meet with limited success, since snow may sublimate if the gauge is kept much above freezing. Weighing gauges with antifreeze should do fine with snow, but again, the funnel needs to be removed before the event begins. For those looking to measure rainfall the most inexpensively, a can that is cylindrical with straight sides will act as a rain gauge if left out in the open, but its accuracy will depend on what ruler is used to measure the rain with. Any of the above rain gauges can be made at home, with enough know-how.

When a precipitation measurement is made, various networks exist across the United States and elsewhere where rainfall measurements can be submitted through the Internet, such as CoCoRAHS or GLOBE. If a network is not available in the area where one lives, the nearest local weather office will likely be interested in the measurement.

Hydrometeor definition

A concept used in precipitation measurement is the hydrometeor. Any particulates of liquid or solid water in the atmosphere are known as hydrometeors. Formations due to condensation, such as clouds, haze, fog, and mist, are composed of hydrometeors. All precipitation types are made up of hydrometeors by definition, including virga, which is precipitation which evaporates before reaching the ground. Particles blown from the Earth's surface by wind, such as blowing snow and blowing sea spray, are also hydrometeors, as are hail and snow.

Satellite estimates

Although surface precipitation gauges are considered the standard for measuring precipitation, there are many areas in which their use is not feasible. This includes the vast expanses of ocean and remote land areas. In other cases, social, technical or administrative issues prevent the dissemination of gauge observations. As a result, the modern global record of precipitation largely depends on satellite observations.

Satellite sensors work by remotely sensing precipitation—recording various parts of the electromagnetic spectrum that theory and practice show are related to the occurrence and intensity of precipitation. The sensors are almost exclusively passive, recording what they see, similar to a camera, in contrast to active sensors (radar, lidar) that send out a signal and detect its impact on the area being observed.

Satellite sensors now in practical use for precipitation fall into two categories. Thermal infrared (IR) sensors record a channel around 11 micron wavelength and primarily give information about cloud tops. Due to the typical structure of the atmosphere, cloud-top temperatures are approximately inversely related to cloud-top heights, meaning colder clouds almost always occur at higher altitudes. Further, cloud tops with a lot of small-scale variation are likely to be more vigorous than smooth-topped clouds. Various mathematical schemes, or algorithms, use these and other properties to estimate precipitation from the IR data.

The second category of sensor channels is in the microwave part of the electromagnetic spectrum. The frequencies in use range from about 10 gigahertz to a few hundred GHz. Channels up to about 37 GHz primarily provide information on the liquid hydrometeors (rain and drizzle) in the lower parts of clouds, with larger amounts of liquid emitting higher amounts of microwave radiant energy. Channels above 37 GHz display emission signals, but are dominated by the action of solid hydrometeors (snow, graupel, etc.) to scatter microwave radiant energy. Satellites such as the Tropical Rainfall Measuring Mission (TRMM) and the Global Precipitation Measurement (GPM) mission employ microwave sensors to form precipitation estimates.

Additional sensor channels and products have been demonstrated to provide additional useful information including visible channels, additional IR channels, water vapor channels and atmospheric sounding retrievals. However, most precipitation data sets in current use do not employ these data sources.

Satellite data sets

The IR estimates have rather low skill at short time and space scales, but are available very frequently (15 minutes or more often) from satellites in geosynchronous Earth orbit. IR works best in cases of deep, vigorous convection—such as the tropics—and becomes progressively less useful in areas where stratiform (layered) precipitation dominates, especially in mid- and high-latitude regions. The more-direct physical connection between hydrometeors and microwave channels gives the microwave estimates greater skill on short time and space scales than is true for IR. However, microwave sensors fly only on low Earth orbit satellites, and there are few enough of them that the average time between observations exceeds three hours. This several-hour interval is insufficient to adequately document precipitation because of the transient nature of most precipitation systems as well as the inability of a single satellite to appropriately capture the typical daily cycle of precipitation at a given location.

Since the late 1990s, several algorithms have been developed to combine precipitation data from multiple satellites' sensors, seeking to emphasize the strengths and minimize the weaknesses of the individual input data sets. The goal is to provide "best" estimates of precipitation on a uniform time/space grid, usually for as much of the globe as possible. In some cases the long-term homogeneity of the dataset is emphasized, which is the Climate Data Record standard.

In other cases, the goal is producing the best instantaneous satellite estimate, which is the High Resolution Precipitation Product approach. In either case, of course, the less-emphasized goal is also considered desirable. One key result of the multi-satellite studies is that including even a small amount of surface gauge data is very useful for controlling the biases that are endemic to satellite estimates. The difficulties in using gauge data are that 1) their availability is limited, as noted above, and 2) the best analyses of gauge data take two months or more after the observation time to undergo the necessary transmission, assembly, processing and quality control. Thus, precipitation estimates that include gauge data tend to be produced further after the observation time than the no-gauge estimates. As a result, while estimates that include gauge data may provide a more accurate depiction of the "true" precipitation, they are generally not suited for real- or near-real-time applications.

The work described has resulted in a variety of datasets possessing different formats, time/space grids, periods of record and regions of coverage, input datasets, and analysis procedures, as well as many different forms of dataset version designators. In many cases, one of the modern multi-satellite data sets is the best choice for general use.

Return period

The likelihood or probability of an event with a specified intensity and duration, is called the return period or frequency. The intensity of a storm can be predicted for any return period and storm duration, from charts based on historic data for the location. The term 1 in 10 year storm describes a rainfall event which is rare and is only likely to occur once every 10 years, so it has a 10 percent likelihood any given year. The rainfall will be greater and the flooding will be worse than the worst storm expected in any single year. The term 1 in 100 year storm describes a rainfall event which is extremely rare and which will occur with a likelihood of only once in a century, so has a 1 percent likelihood in any given year. The rainfall will be extreme and flooding to be worse than a 1 in 10 year event. As with all probability events, it is possible though unlikely to have two "1 in 100 Year Storms" in a single year.

Uneven pattern of precipitation

A significant portion of the annual precipitation in any particular place (no weather station in Africa or South America were considered) falls on only a few days, typically about 50% during the 12 days with the most precipitation.

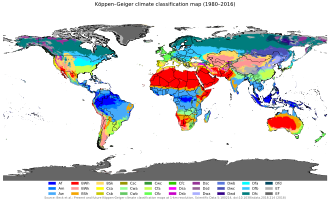
Role in Köppen climate classification

Updated Köppen-Geiger climate map
  Af
  Am
  Aw/As

  BWh
  BWk
  BSh
  BSk

  Csa
  Csb
  Csc

  Cwa
  Cwb
  Cwc

  Cfa
  Cfb
  Cfc

  Dsa
  Dsb
  Dsc
  Dsd

  Dwa
  Dwb
  Dwc
  Dwd

  Dfa
  Dfb
  Dfc
  Dfd

  ET
  EF

The Köppen classification depends on average monthly values of temperature and precipitation. The most commonly used form of the Köppen classification has five primary types labeled A through E. Specifically, the primary types are A, tropical; B, dry; C, mild mid-latitude; D, cold mid-latitude; and E, polar. The five primary classifications can be further divided into secondary classifications such as rain forest, monsoon, tropical savanna, humid subtropical, humid continental, oceanic climate, Mediterranean climate, steppe, subarctic climate, tundra, polar ice cap, and desert.

Rain forests are characterized by high rainfall, with definitions setting minimum normal annual rainfall between 1,750 and 2,000 mm (69 and 79 in). A tropical savanna is a grassland biome located in semi-arid to semi-humid climate regions of subtropical and tropical latitudes, with rainfall between 750 and 1,270 mm (30 and 50 in) a year. They are widespread on Africa, and are also found in India, the northern parts of South America, Malaysia, and Australia. The humid subtropical climate zone is where winter rainfall (and sometimes snowfall) is associated with large storms that the westerlies steer from west to east. Most summer rainfall occurs during thunderstorms and from occasional tropical cyclones. Humid subtropical climates lie on the east side continents, roughly between latitudes 20° and 40° degrees from the equator.

An oceanic (or maritime) climate is typically found along the west coasts at the middle latitudes of all the world's continents, bordering cool oceans, as well as southeastern Australia, and is accompanied by plentiful precipitation year-round. The Mediterranean climate regime resembles the climate of the lands in the Mediterranean Basin, parts of western North America, parts of western and southern Australia, in southwestern South Africa and in parts of central Chile. The climate is characterized by hot, dry summers and cool, wet winters. A steppe is a dry grassland. Subarctic climates are cold with continuous permafrost and little precipitation.

Effect on agriculture

Rainfall estimates for southern Japan and the surrounding region from July 20 to 27, 2009.

Precipitation, especially rain, has a dramatic effect on agriculture. All plants need at least some water to survive, therefore rain (being the most effective means of watering) is important to agriculture. While a regular rain pattern is usually vital to healthy plants, too much or too little rainfall can be harmful, even devastating to crops. Drought can kill crops and increase erosion, while overly wet weather can cause harmful fungus growth. Plants need varying amounts of rainfall to survive. For example, certain cacti require small amounts of water, while tropical plants may need up to hundreds of inches of rain per year to survive.

In areas with wet and dry seasons, soil nutrients diminish and erosion increases during the wet season. Animals have adaptation and survival strategies for the wetter regime. The previous dry season leads to food shortages into the wet season, as the crops have yet to mature. Developing countries have noted that their populations show seasonal weight fluctuations due to food shortages seen before the first harvest, which occurs late in the wet season.

Changes due to global warming

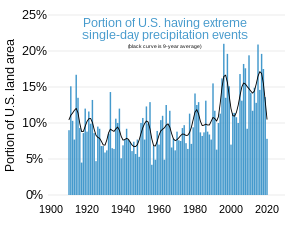
Extreme precipitation events have become more common in the U.S. over recent decades.

Increasing temperatures tend to increase evaporation which leads to more precipitation. Precipitation has generally increased over land north of 30°N from 1900 to 2005 but has declined over the tropics since the 1970s. Globally there has been no statistically significant overall trend in precipitation over the past century, although trends have varied widely by region and over time. In 2018, a study assessing changes in precipitation across spatial scales using a high-resolution global precipitation dataset of over 33+ years, concluded that "While there are regional trends, there is no evidence of increase in precipitation at the global scale in response to the observed global warming."

Each region of the world is going to have changes in precipitation due to their unique conditions. Eastern portions of North and South America, northern Europe, and northern and central Asia have become wetter. The Sahel, the Mediterranean, southern Africa and parts of southern Asia have become drier. There has been an increase in the number of heavy precipitation events over many areas during the past century, as well as an increase since the 1970s in the prevalence of droughts—especially in the tropics and subtropics. Changes in precipitation and evaporation over the oceans are suggested by the decreased salinity of mid- and high-latitude waters (implying more precipitation), along with increased salinity in lower latitudes (implying less precipitation, more evaporation, or both). Over the contiguous United States, total annual precipitation increased at an average rate of 6.1% per century since 1900, with the greatest increases within the East North Central climate region (11.6% per century) and the South (11.1%). Hawaii was the only region to show a decrease (−9.25%).

Changes due to urban heat island

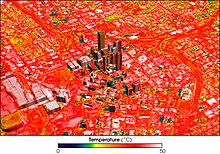
Image of Atlanta, Georgia, showing temperature distribution, with hot areas appearing white

The urban heat island warms cities 0.6 to 5.6 °C (1.1 to 10.1 °F) above surrounding suburbs and rural areas. This extra heat leads to greater upward motion, which can induce additional shower and thunderstorm activity. Rainfall rates downwind of cities are increased between 48% and 116%. Partly as a result of this warming, monthly rainfall is about 28% greater between 32 to 64 kilometres (20 to 40 mi) downwind of cities, compared with upwind. Some cities induce a total precipitation increase of 51%.

Forecasting

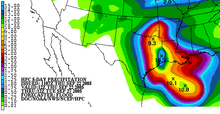
Example of a five-day rainfall forecast from the Hydrometeorological Prediction Center

The Quantitative Precipitation Forecast (abbreviated QPF) is the expected amount of liquid precipitation accumulated over a specified time period over a specified area. A QPF will be specified when a measurable precipitation type reaching a minimum threshold is forecast for any hour during a QPF valid period. Precipitation forecasts tend to be bound by synoptic hours such as 0000, 0600, 1200 and 1800 GMT. Terrain is considered in QPFs by use of topography or based upon climatological precipitation patterns from observations with fine detail. Starting in the mid to late 1990s, QPFs were used within hydrologic forecast models to simulate impact to rivers throughout the United States. Forecast models show significant sensitivity to humidity levels within the planetary boundary layer, or in the lowest levels of the atmosphere, which decreases with height. QPF can be generated on a quantitative, forecasting amounts, or a qualitative, forecasting the probability of a specific amount, basis. Radar imagery forecasting techniques show higher skill than model forecasts within six to seven hours of the time of the radar image. The forecasts can be verified through use of rain gauge measurements, weather radar estimates, or a combination of both. Various skill scores can be determined to measure the value of the rainfall forecast.

Kelvin probe force microscope

From Wikipedia, the free encyclopedia https://en.wikipedia.org/wiki/Kel...