Search This Blog

Tuesday, December 5, 2023

BIOS interrupt call

From Wikipedia, the free encyclopedia

BIOS implementations provide interrupts that can be invoked by operating systems and application programs to use the facilities of the firmware on IBM PC compatible computers. Traditionally, BIOS calls are mainly used by DOS programs and some other software such as boot loaders (including, mostly historically, relatively simple application software that boots directly and runs without an operating system—especially game software). BIOS runs in the real address mode (Real Mode) of the x86 CPU, so programs that call BIOS either must also run in real mode or must switch from protected mode to real mode before calling BIOS and then switching back again. For this reason, modern operating systems that use the CPU in Protected mode or Long mode generally do not use the BIOS interrupt calls to support system functions, although they use the BIOS interrupt calls to probe and initialize hardware during booting. Real mode has the 1MB memory limitation, modern boot loaders (e.g. GRUB2, Windows Boot Manager) use the unreal mode or protected mode (and execute the BIOS interrupt calls in the Virtual 8086 mode, but only for OS booting) to access up to 4GB memory.

In all computers, software instructions control the physical hardware (screen, disk, keyboard, etc.) from the moment the power is switched on. In a PC, the BIOS, pre-loaded in ROM on the motherboard, takes control immediately after the CPU is reset, including during power-up, when a hardware reset button is pressed, or when a critical software failure (a triple fault) causes the mainboard circuitry to automatically trigger a hardware reset. The BIOS tests the hardware and initializes its state; finds, loads, and runs the boot program (usually, an OS boot loader, and historical ROM BASIC); and provides basic hardware control to the software running on the machine, which is usually an operating system (with application programs) but may be a directly booting single software application.

For IBM's part, they provided all the information needed to use their BIOS fully or to directly utilize the hardware and avoid BIOS completely, when programming the early IBM PC models (prior to the PS/2). From the beginning, programmers had the choice of using BIOS or not, on a per-hardware-peripheral basis. IBM did strongly encourage the authorship of "well-behaved" programs that accessed hardware only through BIOS INT calls (and DOS service calls), to support compatibility of software with current and future PC models having dissimilar peripheral hardware, but IBM understood that for some software developers and hardware customers, a capability for user software to directly control the hardware was a requirement. In part, this was because a significant subset of all the hardware features and functions was not exposed by the BIOS services. For two examples (among many), the MDA and CGA adapters are capable of hardware scrolling, and the PC serial adapter is capable of interrupt-driven data transfer, but the IBM BIOS supports neither of these useful technical features.

Today, the BIOS in a new PC still supports most, if not all, of the BIOS interrupt function calls defined by IBM for the IBM AT (introduced in 1984), along with many more newer ones, plus extensions to some of the originals (e.g. expanded parameter ranges) promulgated by various other organizations and collaborative industry groups. This, combined with a similar degree of hardware compatibility, means that most programs written for an IBM AT can still run correctly on a new PC today, assuming that the faster speed of execution is acceptable (which it typically is for all but games that use CPU-based timing). Despite the considerable limitations of the services accessed through the BIOS interrupts, they have proven extremely useful and durable to technological change.

Purpose of BIOS calls

BIOS interrupt calls perform hardware control or I/O functions requested by a program, return system information to the program, or do both. A key element of the purpose of BIOS calls is abstraction - the BIOS calls perform generally defined functions, and the specific details of how those functions are executed on the particular hardware of the system are encapsulated in the BIOS and hidden from the program. So, for example, a program that wants to read from a hard disk does not need to know whether the hard disk is an ATA, SCSI, or SATA drive (or in earlier days, an ESDI drive, or an MFM or RLL drive with perhaps a Seagate ST-506 controller, perhaps one of the several Western Digital controller types, or with a different proprietary controller of another brand). The program only needs to identify the BIOS-defined number of the drive it wishes to access and the address of the sector it needs to read or write, and the BIOS will take care of translating this general request into the specific sequence of elementary operations required to complete the task through the particular disk controller hardware that is connected to that drive. The program is freed from needing to know how to control at a low level every type of hard disk (or display adapter, or port interface, or real-time clock peripheral) that it may need to access. This both makes programming operating systems and applications easier and makes the programs smaller, reducing the duplication of program code, as the functionality that is included in the BIOS does not need to be included in every program that needs it; relatively short calls to the BIOS are included in the programs instead. (In operating systems where the BIOS is not used, service calls provided by the operating system itself generally fulfill the same function and purpose.)

The BIOS also frees computer hardware designers (to the extent that programs are written to use the BIOS exclusively) from being constrained to maintain exact hardware compatibility with old systems when designing new systems, in order to maintain compatibility with existing software. For example, the keyboard hardware on the IBM PCjr works very differently than the keyboard hardware on earlier IBM PC models, but to programs that use the keyboard only through the BIOS, this difference is nearly invisible. (As a good example of the other side of this issue, a significant share of the PC programs in use at the time the PCjr was introduced did not use the keyboard through BIOS exclusively, so IBM also included hardware features in the PCjr to emulate the way the original IBM PC and IBM PC XT keyboard hardware works. The hardware emulation is not exact, so not all programs that try to use the keyboard hardware directly will work correctly on the PCjr, but all programs that use only the BIOS keyboard services will.)

In addition to giving access to hardware facilities, BIOS provides added facilities that are implemented in the BIOS software. For example, the BIOS maintains separate cursor positions for up to eight text display pages and provides for TTY-like output with automatic line wrap and interpretation of basic control characters such as carriage return and line feed, whereas the CGA-compatible text display hardware has only one global display cursor and cannot automatically advance the cursor, use the cursor position to address the display memory (so as to determine which character cell will be changed or examined), or interpret control characters. For another example, the BIOS keyboard interface interprets many keystrokes and key combinations to keep track of the various shift states (left and right Shift, Ctrl, and Alt), to call the print-screen service when Shift+PrtScrn is pressed, to reboot the system when Ctrl+Alt+Del is pressed, to keep track of the lock states (Caps Lock, Num Lock, and Scroll Lock) and, in AT-class machines, control the corresponding lock-state indicator lights on the keyboard, and to perform other similar interpretive and management functions for the keyboard. In contrast, the ordinary capabilities of the standard PC and PC-AT keyboard hardware are limited to reporting to the system each primitive event of an individual key being pressed or released (i.e. making a transition from the "released" state to the "depressed" state or vice versa), performing a commanded reset and self-test of the keyboard unit, and, for AT-class keyboards, executing a command from the host system to set the absolute states of the lock-state indicators (LEDs).

Calling BIOS: BIOS software interrupts

Operating systems and other software communicate with the BIOS software, in order to control the installed hardware, via software interrupts. A software interrupt is a specific variety of the general concept of an interrupt. An interrupt is a mechanism by which the CPU can be directed to stop executing the main-line program and immediately execute a special program, called an Interrupt Service Routine (ISR), instead. Once the ISR finishes, the CPU continues with the main program. On x86 CPUs, when an interrupt occurs, the ISR to call is found by looking it up in a table of ISR starting-point addresses (called "interrupt vectors") in memory: the Interrupt vector table (IVT). An interrupt is invoked by its type number, from 0 to 255, and the type number is used as an index into the Interrupt Vector Table, and at that index in the table is found the address of the ISR that will be run in response to the interrupt. A software interrupt is simply an interrupt that is triggered by a software command; therefore, software interrupts function like subroutines, with the main difference that the program that makes a software interrupt call does not need to know the address of the ISR, only its interrupt number. This has advantages for modularity, compatibility, and flexibility in system configuration.

BIOS interrupt calls can be thought of as a mechanism for passing messages between BIOS and BIOS client software such as an operating system. The messages request data or action from BIOS and return the requested data, status information, and/or the product of the requested action to the caller. The messages are broken into categories, each with its own interrupt number, and most categories contain sub-categories, called "functions" and identified by "function numbers". A BIOS client passes most information to BIOS in CPU registers, and receives most information back the same way, but data too large to fit in registers, such as tables of control parameters or disk sector data for disk transfers, is passed by allocating a buffer (i.e. some space) in memory and passing the address of the buffer in registers. (Sometimes multiple addresses of data items in memory may be passed in a data structure in memory, with the address of that structure passed to BIOS in registers.) The interrupt number is specified as the parameter of the software interrupt instruction (in Intel assembly language, an "INT" instruction), and the function number is specified in the AH register; that is, the caller sets the AH register to the number of the desired function. In general, the BIOS services corresponding to each interrupt number operate independently of each other, but the functions within one interrupt service are handled by the same BIOS program and are not independent. (This last point is relevant to reentrancy.)

The BIOS software usually returns to the caller with an error code if not successful, or with a status code and/or requested data if successful. The data itself can be as small as one bit or as large as 65,536 bytes of whole raw disk sectors (the maximum that will fit into one real-mode memory segment). BIOS has been expanded and enhanced over the years many times by many different corporate entities, and unfortunately the result of this evolution is that not all the BIOS functions that can be called use consistent conventions for formatting and communicating data or for reporting results. Some BIOS functions report detailed status information, while others may not even report success or failure but just return silently, leaving the caller to assume success (or to test the outcome some other way). Sometimes it can also be difficult to determine whether or not a certain BIOS function call is supported by the BIOS on a certain computer, or what the limits of a call's parameters are on that computer. (For some invalid function numbers, or valid function numbers with invalid values of key parameters—particularly with an early IBM BIOS version—the BIOS may do nothing and return with no error code; then it is the [inconvenient but inevitable] responsibility of the caller either to avoid this case by not making such calls, or to positively test for an expected effect of the call rather than assuming that the call was effective. Because BIOS has evolved extensively in many steps over its history, a function that is valid in one BIOS version from some certain vendor may not be valid in an earlier or divergent BIOS version from the same vendor or in a BIOS version—of any relative age—from a different vendor.)

Because BIOS interrupt calls use CPU register-based parameter passing, the calls are oriented to being made from assembly language and cannot be directly made from most high-level languages (HLLs). However, a high level language may provide a library of wrapper routines which translate parameters from the form (usually stack-based) used by the high-level language to the register-based form required by BIOS, then back to the HLL calling convention after the BIOS returns. In some variants of C, BIOS calls can be made using inline assembly language within a C module. (Support for inline assembly language is not part of the ANSI C standard but is a language extension; therefore, C modules that use inline assembly language are less portable than pure ANSI standard C modules.)

Invoking an interrupt

Invoking an interrupt can be done using the INT x86 assembly language instruction. For example, to print a character to the screen using BIOS interrupt 0x10, the following x86 assembly language instructions could be executed:

 mov ah, 0x0e    ; function number = 0Eh : Display Character
 mov al, '!'     ; AL = code of character to display
 int 0x10        ; call INT 10h, BIOS video service

Interrupt table

A list of common BIOS interrupt classes can be found below. Note that some BIOSes (particularly old ones) do not implement all of these interrupt classes.

The BIOS also uses some interrupts to relay hardware event interrupts to programs which choose to receive them or to route messages for its own use. The table below includes only those BIOS interrupts which are intended to be called by programs (using the "INT" assembly-language software interrupt instruction) to request services or information.

Interrupt vector Description
05h Executed when Shift-Print screen is pressed, as well as when the BOUND instruction detects a bound failure.
08h This is the real time clock interrupt. It fires 18.2 times/second. The BIOS increments the time-of-day counter during this interrupt.
09h This is the Keyboard interrupt. This is generally triggered when a key on a keyboard is pressed.
10h Video Services
AH Description
00h Set Video Mode
01h Set Cursor Shape
02h Set Cursor Position
03h Get Cursor Position And Shape
04h Get Light Pen Position
05h Set Display Page
06h Clear/Scroll Screen Up
07h Clear/Scroll Screen Down
08h Read Character and Attribute at Cursor
09h Write Character and Attribute at Cursor
0Ah Write Character at Cursor
0Bh Set Border Color
0Ch Write Graphics Pixel
0Dh Read Graphics Pixel
0Eh Write Character in TTY Mode
0Fh Get Video Mode
10h Set Palette Registers (EGA, VGA, SVGA)
11h Character Generator (EGA, VGA, SVGA)
12h Alternate Select Functions (EGA, VGA, SVGA)
13h Write String
1Ah Get or Set Display Combination Code (VGA, SVGA)
1Bh Get Functionality Information (VGA, SVGA)
1Ch Save or Restore Video State (VGA, SVGA)
4Fh VESA BIOS Extension Functions (SVGA)
11h Returns equipment list
12h Return conventional memory size
13h Low Level Disk Services
AH Description
00h Reset Disk Drives
01h Check Drive Status
02h Read Sectors
03h Write Sectors
04h Verify Sectors
05h Format Track
08h Get Drive Parameters
09h Init Fixed Drive Parameters
0Ch Seek To Specified Track
0Dh Reset Fixed Disk Controller
15h Get Drive Type
16h Get Floppy Drive Media Change Status
17h Set Disk Type
18h Set Floppy Drive Media Type
41h Extended Disk Drive (EDD) Installation Check
42h Extended Read Sectors
43h Extended Write Sectors
44h Extended Verify Sectors
45h Lock/Unlock Drive
46h Eject Media
47h Extended Seek
48h Extended Get Drive Parameters
49h Extended Get Media Change Status
4Eh Extended Set Hardware Configuration
14h Serial port services
AH Description
00h Serial Port Initialization
01h Transmit Character
02h Receive Character
03h Status
15h Miscellaneous system services
AH AL Description
00h
Turn on cassette drive motor (IBM PC/PCjr only)
01h
Turn off cassette drive motor (IBM PC/PCjr only)
02h
Read data blocks from cassette (IBM PC/PCjr only)
03h
Write data blocks to cassette (IBM PC/PCjr only)
4Fh
Keyboard Intercept
83h
Event Wait
84h
Read Joystick (BIOSes from 1986 onward)
85h
Sysreq Key Callout
86h
Wait
87h
Move Block
88h
Get Extended Memory Size
89h
Switch to Protected Mode
C0h
Get System Parameters
C1h
Get Extended BIOS Data Area Segment
C2h
Pointing Device Functions
C3h
Watchdog Timer Functions - PS/2 systems only
C4h
Programmable Option Select - MCA bus PS/2 systems only
D8h
EISA System Functions - EISA bus systems only
E8h 01h Get Extended Memory Size (Newer function, since 1994). Gives results for memory size above 64 Mb.
E8h 20h Query System Address Map. The information returned from E820 supersedes what is returned from the older AX=E801h and AH=88h interfaces.
16h Keyboard services
AH Description
00h Read Character
01h Read Input Status
02h Read Keyboard Shift Status
05h Store Keystroke in Keyboard Buffer
10h Read Character Extended
11h Read Input Status Extended
12h Read Keyboard Shift Status Extended
17h Printer services
AH Description
00h Print Character to Printer
01h Initialize Printer
02h Check Printer Status
18h Execute Cassette BASIC: On IBM machines up to the early PS/2 line, this interrupt would start the ROM Cassette BASIC. Clones did not have this feature and different machines/BIOSes would perform a variety of different actions if INT 18h was executed, most commonly an error message stating that no bootable disk was present. Modern machines would attempt to boot from a network through this interrupt. On modern machines this interrupt will be treated by the BIOS as a signal from the bootloader that it failed to complete its task. The BIOS can then take appropriate next steps.
19h After POST this interrupt is used by the BIOS to load the operating system. A program can call this interrupt to reboot the computer (but must ensure that hardware interrupts or DMA operations will not cause the system to hang or crash during either the reinitialization of the system by BIOS or the boot process).
1Ah Real Time Clock Services
AH Description
00h Read RTC
01h Set RTC
02h Read RTC Time
03h Set RTC Time
04h Read RTC Date
05h Set RTC Date
06h Set RTC Alarm
07h Reset RTC Alarm
1Ah PCI Services - implemented by BIOSes supporting PCI 2.0 or later
AX Description
B101h PCI Installation Check
B102h Find PCI Device
B103h Find PCI Class Code
B106h PCI Bus-Specific Operations
B108h Read Configuration Byte
B109h Read Configuration Word
B10Ah Read Configuration Dword
B10Bh Write Configuration Byte
B10Ch Write Configuration Word
B10Dh Write Configuration Dword
B10Eh Get IRQ Routine Information
B10Fh Set PCI IRQ
1Bh Ctrl-Break handler - called by INT 09 when Ctrl-Break has been pressed
1Ch Timer tick handler - called by INT 08
1Dh Not to be called; simply a pointer to the VPT (Video Parameter Table), which contains data on video modes
1Eh Not to be called; simply a pointer to the DPT (Diskette Parameter Table), containing a variety of information concerning the diskette drives
1Fh Not to be called; simply a pointer to the VGCT (Video Graphics Character Table), which contains the data for ASCII characters 80h to FFh
41h Address pointer: FDPT = Fixed Disk Parameter Table (1st hard drive)
46h Address pointer: FDPT = Fixed Disk Parameter Table (2nd hard drive)
4Ah Called by RTC for alarm

INT 18h: execute BASIC

INT 18h traditionally jumped to an implementation of Cassette BASIC (provided by Microsoft) stored in Option ROMs. This call would typically be invoked if the BIOS was unable to identify any bootable disk volumes on startup.

At the time the original IBM PC (IBM machine type 5150) was released in 1981, the BASIC in ROM was a key feature. Contemporary popular personal computers such as the Commodore 64 and the Apple II line also had Microsoft Cassette BASIC in ROM (though Commodore renamed their licensed version Commodore BASIC), so in a substantial portion of its intended market, the IBM PC needed BASIC to compete. As on those other systems, the IBM PC's ROM BASIC served as a primitive diskless operating system, allowing the user to load, save, and run programs, as well as to write and refine them. (The original IBM PC was also the only PC model from IBM that, like its aforementioned two competitors, included cassette interface hardware. A base model IBM PC had only 16 KiB of RAM and no disk drives [of any kind], so the cassette interface and BASIC in ROM were essential to make the base model usable. An IBM PC with less than 32 KiB of RAM is incapable of booting from disk. Of the five 8 KiB ROM chips in an original IBM PC, totaling 40 KiB, four contain BASIC and only one contains the BIOS; when only 16 KiB of RAM are installed, the ROM BASIC accounts for over half of the total system memory [4/7ths, to be precise].)

As time went on and BASIC was no longer shipped on all PCs, this interrupt would simply display an error message indicating that no bootable volume was found (famously, "No ROM BASIC", or more explanatory messages in later BIOS versions); in other BIOS versions it would prompt the user to insert a bootable volume and press a key, and then after the user pressed a key it would loop back to the bootstrap loader (INT 19h) to try booting again.

Digital's Rainbow 100B used INT 18h to call its BIOS, which was incompatible with the IBM BIOS. Turbo Pascal, Turbo C and Turbo C++ repurposed INT 18 for memory allocation and paging. Other programs also reused this vector for their own purposes.

BIOS hooks

DOS

On DOS systems, IO.SYS or IBMBIO.COM hooks INT 13 for floppy disk change detection, tracking formatting calls, correcting DMA boundary errors, and working around problems in IBM's ROM BIOS "01/10/84" with model code 0xFC before the first call.

Bypassing BIOS

Many modern operating systems (such as Linux and Windows) do not use any BIOS interrupt calls at all after startup, instead choosing to directly interface with the hardware. To do this, they rely upon drivers that are either a part of the OS kernel itself, ship along with the OS, or are provided by hardware vendors.

There are several reasons for this practice. Most significant is that modern operating systems run with the processor in protected (or long) mode, whereas the BIOS code will only execute in real mode. This means that if an OS running in protected mode wanted to make a BIOS call, it would have to first switch into real mode, then execute the call and wait for it to return, and finally switch back to protected mode. This would be terribly slow and inefficient. Code that runs in real mode (including the BIOS) is limited to accessing just over 1 MiB of memory, due to using 16-bit segmented memory addressing. Additionally, the BIOS is generally not the fastest way to carry out any particular task. In fact, the speed limitations of the BIOS made it common even in the DOS era for programs to circumvent it in order to avoid its performance limitations, especially for video graphics display and fast serial communication.

Beyond the above factors, problems with BIOS functionality include limitations in the range of functions defined, inconsistency in the subsets of those functions supported on different computers, and variations in the quality of BIOSes (i.e. some BIOSes are complete and reliable, others are abridged and buggy). By taking matters into their own hands and avoiding reliance on BIOS, operating system developers can eliminate some of the risks and complications they face in writing and supporting system software. On the other hand, by doing so those developers become responsible for providing "bare-metal" driver software for every different system or peripheral device they intend for their operating system to work with (or for inducing the hardware producers to provide those drivers).

Thus it should be apparent that compact operating systems developed on small budgets would tend to use BIOS heavily, while large operating systems built by huge groups of software engineers with large budgets would more often opt to write their own drivers instead of using BIOS—that is, even without considering the compatibility problems of BIOS and protected mode.
Debugging

From Wikipedia, the free encyclopedia

Debugging tactics can involve interactive debugging, control flow analysis, unit testing, integration testing, log file analysis, monitoring at the application or system level, memory dumps, and profiling. Many programming languages and software development tools also offer programs to aid in debugging, known as debuggers.

Etymology

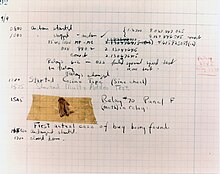
A computer log entry from the Mark II, with a moth taped to the page

The terms "bug" and "debugging" are popularly attributed to Admiral Grace Hopper in the 1940s. While she was working on a Mark II computer at Harvard University, her associates discovered a moth stuck in a relay and thereby impeding operation, whereupon she remarked that they were "debugging" the system. However, the term "bug", in the sense of "technical error", dates back at least to 1878 and Thomas Edison who describes the "little faults and difficulties" of mechanical engineering as "Bugs".

Similarly, the term "debugging" seems to have been used as a term in aeronautics before entering the world of computers. In an interview Grace Hopper remarked that she was not coining the term. The moth fit the already existing terminology, so it was saved. A letter from J. Robert Oppenheimer (director of the WWII atomic bomb Manhattan Project at Los Alamos, New Mexico) used the term in a letter to Dr. Ernest Lawrence at UC Berkeley, dated October 27, 1944, regarding the recruitment of additional technical staff.

The Oxford English Dictionary entry for "debug" quotes the term "debugging" used in reference to airplane engine testing in a 1945 article in the Journal of the Royal Aeronautical Society. An article in "Airforce" (June 1945 p. 50) also refers to debugging, this time of aircraft cameras. Hopper's bug was found on September 9, 1947. Computer programmers did not adopt the term until the early 1950s. The seminal article by Gill in 1951 is the earliest in-depth discussion of programming errors, but it does not use the term "bug" or "debugging". In the ACM's digital library, the term "debugging" is first used in three papers from 1952 ACM National Meetings. Two of the three use the term in quotation marks. By 1963 "debugging" was a common-enough term to be mentioned in passing without explanation on page 1 of the CTSS manual.

Scope

As software and electronic systems have become generally more complex, the various common debugging techniques have expanded with more methods to detect anomalies, assess impact, and schedule software patches or full updates to a system. The words "anomaly" and "discrepancy" can be used, as being more neutral terms, to avoid the words "error" and "defect" or "bug" where there might be an implication that all so-called errors, defects or bugs must be fixed (at all costs). Instead, an impact assessment can be made to determine if changes to remove an anomaly (or discrepancy) would be cost-effective for the system, or perhaps a scheduled new release might render the change(s) unnecessary. Not all issues are safety-critical or mission-critical in a system. Also, it is important to avoid the situation where a change might be more upsetting to users, long-term, than living with the known problem(s) (where the "cure would be worse than the disease"). Basing decisions of the acceptability of some anomalies can avoid a culture of a "zero-defects" mandate, where people might be tempted to deny the existence of problems so that the result would appear as zero defects. Considering the collateral issues, such as the cost-versus-benefit impact assessment, then broader debugging techniques will expand to determine the frequency of anomalies (how often the same "bugs" occur) to help assess their impact to the overall system.

Tools

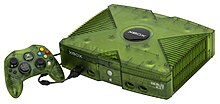
Debugging on video game consoles is usually done with special hardware such as this Xbox debug unit intended for developers.

Debugging ranges in complexity from fixing simple errors to performing lengthy and tiresome tasks of data collection, analysis, and scheduling updates. The debugging skill of the programmer can be a major factor in the ability to debug a problem, but the difficulty of software debugging varies greatly with the complexity of the system, and also depends, to some extent, on the programming language(s) used and the available tools, such as debuggers. Debuggers are software tools which enable the programmer to monitor the execution of a program, stop it, restart it, set breakpoints, and change values in memory. The term debugger can also refer to the person who is doing the debugging.

Generally, high-level programming languages, such as Java, make debugging easier, because they have features such as exception handling and type checking that make real sources of erratic behaviour easier to spot. In programming languages such as C or assembly, bugs may cause silent problems such as memory corruption, and it is often difficult to see where the initial problem happened. In those cases, memory debugger tools may be needed.

In certain situations, general purpose software tools that are language specific in nature can be very useful. These take the form of static code analysis tools. These tools look for a very specific set of known problems, some common and some rare, within the source code, concentrating more on the semantics (e.g. data flow) rather than the syntax, as compilers and interpreters do.

Both commercial and free tools exist for various languages; some claim to be able to detect hundreds of different problems. These tools can be extremely useful when checking very large source trees, where it is impractical to do code walk-throughs. A typical example of a problem detected would be a variable dereference that occurs before the variable is assigned a value. As another example, some such tools perform strong type checking when the language does not require it. Thus, they are better at locating likely errors in code that is syntactically correct. But these tools have a reputation of false positives, where correct code is flagged as dubious. The old Unix lint program is an early example.

For debugging electronic hardware (e.g., computer hardware) as well as low-level software (e.g., BIOSes, device drivers) and firmware, instruments such as oscilloscopes, logic analyzers, or in-circuit emulators (ICEs) are often used, alone or in combination. An ICE may perform many of the typical software debugger's tasks on low-level software and firmware.

Debugging process

The debugging process normally begins with identifying the steps to reproduce the problem. This can be a non-trivial task, particularly with parallel processes and some Heisenbugs for example. The specific user environment and usage history can also make it difficult to reproduce the problem.

After the bug is reproduced, the input of the program may need to be simplified to make it easier to debug. For example, a bug in a compiler can make it crash when parsing a large source file. However, after simplification of the test case, only few lines from the original source file can be sufficient to reproduce the same crash. Simplification may be done manually using a divide-and-conquer approach, in which the programmer attempts to remove some parts of original test case then checks if the problem still occurs. When debugging in a GUI, the programmer can try skipping some user interaction from the original problem description to check if the remaining actions are sufficient for causing the bug to occur.

After the test case is sufficiently simplified, a programmer can use a debugger tool to examine program states (values of variables, plus the call stack) and track down the origin of the problem(s). Alternatively, tracing can be used. In simple cases, tracing is just a few print statements which output the values of variables at particular points during the execution of the program.

Techniques

  • Interactive debugging uses debugger tools which allow an program's execution to be processed one step at a time and to be paused to inspect or alter its state. Subroutines or function calls may typically be executed at full speed and paused again upon return to their caller, or themselves single stepped, or any mixture of these options. Setpoints may be installed which permit full speed execution of code that is not suspected to be faulty, and then stop at a point that is. Putting a setpoint immediately after the end of a program loop is a convenient way to evaluate repeating code. Watchpoints are commonly available, where execution can proceed until a particular variable changes, and catchpoints which cause the debugger to stop for certain kinds of program events, such as exceptions or the loading of a shared library.
  • Print debugging or tracing is the act of watching (live or recorded) trace statements, or print statements, that indicate the flow of execution of a process and the data progression. Tracing can be done with specialized tools (like with GDB's trace) or by insertion of trace statements into the source code. The latter is sometimes called printf debugging, due to the use of the printf function in C. This kind of debugging was turned on by the command TRON in the original versions of the novice-oriented BASIC programming language. TRON stood for, "Trace On." TRON caused the line numbers of each BASIC command line to print as the program ran.
  • Activity tracing is like tracing (above), but rather than following program execution one instruction or function at a time, follows program activity based on the overall amount of time spent by the processor/CPU executing particular segments of code. This is typically presented as a fraction of the program's execution time spent processing instructions within defined memory addresses (machine code programs) or certain program modules (high level language or compiled programs). If the program being debugged is shown to be spending an inordinate fraction of its execution time within traced areas, this could indicate misallocation of processor time caused by faulty program logic, or at least inefficient allocation of processor time that could benefit from optimization efforts.
  • Remote debugging is the process of debugging a program running on a system different from the debugger. To start remote debugging, a debugger connects to a remote system over a communications link such as a local area network. The debugger can then control the execution of the program on the remote system and retrieve information about its state.
  • Post-mortem debugging is debugging of the program after it has already crashed. Related techniques often include various tracing techniques like examining log files, outputting a call stack on the crash, and analysis of memory dump (or core dump) of the crashed process. The dump of the process could be obtained automatically by the system (for example, when the process has terminated due to an unhandled exception), or by a programmer-inserted instruction, or manually by the interactive user.
  • "Wolf fence" algorithm: Edward Gauss described this simple but very useful and now famous algorithm in a 1982 article for Communications of the ACM as follows: "There's one wolf in Alaska; how do you find it? First build a fence down the middle of the state, wait for the wolf to howl, determine which side of the fence it is on. Repeat process on that side only, until you get to the point where you can see the wolf." This is implemented e.g. in the Git version control system as the command git bisect, which uses the above algorithm to determine which commit introduced a particular bug.
  • Record and replay debugging is the technique of creating a program execution recording (e.g. using Mozilla's free rr debugging tool; enabling reversible debugging/execution), which can be replayed and interactively debugged. Useful for remote debugging and debugging intermittent, non-determinstic, and other hard-to-reproduce defects.
  • Time travel debugging is the process of stepping back in time through source code (e.g. using Undo LiveRecorder) to understand what is happening during execution of a computer program; to allow users to interact with the program; to change the history if desired and to watch how the program responds.
  • Delta Debugging – a technique of automating test case simplification.
  • Saff Squeeze – a technique of isolating failure within the test using progressive inlining of parts of the failing test.
  • Causality tracking: There are techniques to track the cause effect chains in the computation. Those techniques can be tailored for specific bugs, such as null pointer dereferences.

Automatic bug fixing

Automatic bug-fixing is the automatic repair of software bugs without the intervention of a human programmer. It is also commonly referred to as automatic patch generation, automatic bug repair, or automatic program repair. The typical goal of such techniques is to automatically generate correct patches to eliminate bugs in software programs without causing software regression.

Debugging for embedded systems

In contrast to the general purpose computer software design environment, a primary characteristic of embedded environments is the sheer number of different platforms available to the developers (CPU architectures, vendors, operating systems, and their variants). Embedded systems are, by definition, not general-purpose designs: they are typically developed for a single task (or small range of tasks), and the platform is chosen specifically to optimize that application. Not only does this fact make life tough for embedded system developers, it also makes debugging and testing of these systems harder as well, since different debugging tools are needed for different platforms.

Despite the challenge of heterogeneity mentioned above, some debuggers have been developed commercially as well as research prototypes. Examples of commercial solutions come from Green Hills Software, Lauterbach GmbH and Microchip's MPLAB-ICD (for in-circuit debugger). Two examples of research prototype tools are Aveksha and Flocklab. They all leverage a functionality available on low-cost embedded processors, an On-Chip Debug Module (OCDM), whose signals are exposed through a standard JTAG interface. They are benchmarked based on how much change to the application is needed and the rate of events that they can keep up with.

In addition to the typical task of identifying bugs in the system, embedded system debugging also seeks to collect information about the operating states of the system that may then be used to analyze the system: to find ways to boost its performance or to optimize other important characteristics (e.g. energy consumption, reliability, real-time response, etc.).

Anti-debugging

Anti-debugging is "the implementation of one or more techniques within computer code that hinders attempts at reverse engineering or debugging a target process". It is actively used by recognized publishers in copy-protection schemas, but is also used by malware to complicate its detection and elimination. Techniques used in anti-debugging include:

  • API-based: check for the existence of a debugger using system information
  • Exception-based: check to see if exceptions are interfered with
  • Process and thread blocks: check whether process and thread blocks have been manipulated
  • Modified code: check for code modifications made by a debugger handling software breakpoints
  • Hardware- and register-based: check for hardware breakpoints and CPU registers
  • Timing and latency: check the time taken for the execution of instructions
  • Detecting and penalizing debugger

An early example of anti-debugging existed in early versions of Microsoft Word which, if a debugger was detected, produced a message that said, "The tree of evil bears bitter fruit. Now trashing program disk.", after which it caused the floppy disk drive to emit alarming noises with the intent of scaring the user away from attempting it again.

IBM BASIC

From Wikipedia, the free encyclopedia
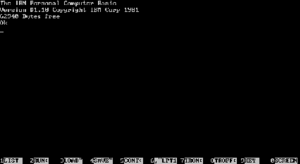
Five 8 KB ROM DIP chips and an empty 8 KB ROM expansion socket, on an IBM PC motherboard. Four chips hold Cassette BASIC, and one holds the BIOS.

The IBM Personal Computer Basic, commonly shortened to IBM BASIC, is a programming language first released by IBM with the IBM Personal Computer, Model 5150 (IBM PC) in 1981. IBM released four different versions of the Microsoft BASIC interpreter, licensed from Microsoft for the PC and PCjr. They are known as Cassette BASIC, Disk BASIC, Advanced BASIC (BASICA), and Cartridge BASIC. Versions of Disk BASIC and Advanced BASIC were included with IBM PC DOS up to PC DOS 4. In addition to the features of an ANSI standard BASIC, the IBM versions offered support for the graphics and sound hardware of the IBM PC line. Source code could be typed in with a full-screen editor, and very limited facilities were provided for rudimentary program debugging. IBM also released a version of the Microsoft BASIC compiler for the PC, concurrently with the release of PC DOS 1.10 in 1982.

Background

IBM licensed Microsoft BASIC for the IBM Personal Computer, despite already having its own version of BASIC for the company's mainframes. Don Estridge said, "Microsoft BASIC had hundreds of thousands of users around the world. How are you going to argue with that?"

IBM Cassette BASIC

IBM Cassette BASIC

DeveloperMicrosoft (for IBM)
First appeared1981
Influenced
IBM Disk BASIC, IBM BASICA, GW-BASIC

IBM Cassette BASIC came in 32 kilobytes (KB) of read-only memory (ROM), separate from the 8 KB BIOS ROM of the original IBM PC, and did not require an operating system to run. Cassette BASIC provided the default user interface invoked by the BIOS through INT 18h if there was no floppy disk drive installed, or if the boot code did not find a bootable floppy disk at power up. The name Cassette BASIC came from its use of cassette tapes rather than floppy disks to store programs and data. Cassette BASIC was built into the ROMs of the original PC and XT, and early models in the PS/2 line. It only supports loading and saving programs to the IBM cassette tape interface, which is unavailable on models after the original Model 5150. The entry-level version of the 5150 came with just 16 KB of random-access memory (RAM), which was sufficient to run Cassette BASIC. However, Cassette BASIC was rarely used because few PCs were sold without a disk drive, and most were sold with PC DOS and sufficient RAM to at least run Disk BASIC—many could run Advanced BASIC as well. There are three versions of Cassette BASIC: C1.00 (found on the early IBM PCs with 16–64K motherboards), C1.10 (found on all later IBM PCs, XTs, ATs, and PS/2s), and C1.20 (found on the PCjr).

IBM Disk BASIC

IBM Disk BASIC

DeveloperMicrosoft (for IBM)
First appeared1981
Influenced by
IBM Cassette BASIC
Influenced
IBM BASICA, GW-BASIC

IBM Disk BASIC (BASIC.COM) was included in the original IBM PC DOS. Because it uses the 32 KB Cassette BASIC ROM, BASIC.COM did not run on even highly compatible PC clones, such as the Compaq Portable. The name Disk BASIC came from its use of floppy disks as well as cassette tapes to store programs and data. Disk-based code corrected errata in the ROM-resident code and added floppy disk and serial port support.

Disk BASIC can be identified by its use of the letter D preceding the version number. It adds disk support and some features lacking in Cassette BASIC, but does not include the extended sound/graphics functions of BASICA. The primary purpose of Disk BASIC was as a "light" version for IBM PCs with only 48 KB of memory: BASIC.COM would then have about 23 KB free for user code, whereas BASICA would only have about 17 KB. By 1986, all new PCs shipped with at least 256k and DOS versions after 3.00 reduced Disk BASIC to only a small stub that called BASICA.COM for compatibility with batch files. Even with all this excess RAM, BASIC would still only allocate and manage just under 61 KB for user programs, whether it was Cassette BASIC, BASIC.COM or BASICA.

IBM Advanced BASIC

IBM Advanced BASIC (BASICA)

DeveloperMicrosoft (for IBM)
First appeared1981
PlatformIBM Personal Computer
OSIBM PC DOS
Influenced by
IBM Cassette BASIC, IBM Disk BASIC
Influenced
GW-BASIC

IBM Advanced BASIC (BASICA.COM) was also included in the original IBM PC DOS, and required the ROM-resident code of Cassette BASIC. It adds functions such as diskette file access, storing programs on disk, monophonic sound using the PC's built-in speaker, graphics functions to set and clear pixels, draw lines and circles, and set colors, and event handling for communications and joystick presses. BASICA will not run on non-IBM computers (even so-called "100% compatible" machines) or later IBM models, since those lack the needed ROM BASIC.

BASICA versions are the same as their respective DOS, beginning with v1.00 and ending with v3.30. The early versions of BASICA do not support subdirectories and some graphics commands functioned slightly differently. As an example, if the LINE statement was used to draw lines that trailed off-screen, BASIC merely intersects them with the nearest adjacent line while in BASIC 2.x and up, they go off the screen and do not intersect. The PAINT command in BASIC 1.x begins filling at the coordinate specified and expands outward in alternating up and down directions while in BASIC 2.x it fills everything below the starting coordinate and then after finishing, everything above it. BASIC 1.x's PAINT command also makes use of the system stack for storage and when filling in complex areas, it is possible to produce an OVERFLOW error. To remedy this, the CLEAR statement can be used to expand BASIC's stack (128 bytes is the default size). BASIC 2.x does not use the stack when PAINTing and thus is free of this problem.

Compaq BASIC 1.13 was the first standalone BASIC for the PC (that did not require Cassette BASIC to run) as well as the only version of BASIC besides IBM BASICA 1.00 and 1.10 to use FCBs and include the original LINE statement with intersecting lines (the PAINT statement in Compaq BASIC 1.13 worked like in all later versions of BASICA/GW-BASIC, using the new fill algorithm and no stack).

Early versions of PC DOS include several sample BASIC programs demonstrating the capabilities of the PC, including the BASICA game DONKEY.BAS.

GW-BASIC is identical to BASICA, with the exception of including the Cassette BASIC code in the program, thus allowing it to run on non-IBM computers and later IBM models that lack Cassette BASIC in ROM.

IBM PCjr Cartridge BASIC

A ROM cartridge version of BASIC was only available on the IBM PCjr, shipped in 1984, and supports the additional graphics modes and sound capabilities possible on that machine. It is a superset of advanced BASIC. Cartridge BASIC can only operate within the first 128 KB of memory on the PCjr and will not work with expansion RAM, i.e., the DEF SEG function cannot be used to point to memory segments above &H1FF0.

Cartridge BASIC is activated by typing BASICA at the DOS prompt. Conversely, IBM BASICA versions 2.1 and up will refuse to run if it detects a PCjr, but can be patched to work around this.

Operation

Cassette BASIC loads when a PC or PCjr is booted without a bootable disk or cartridge. Disk BASIC and Advanced BASIC load when their command name (BASIC and BASICA respectively) is typed at a DOS command prompt (except PCjr, which activates Cartridge BASIC instead), with some optional parameters to control allocation of memory. When loaded, a sign-on identification message displays the program version number, and a full-screen text editor starts (see images, right). The function keys are assigned common commands, which display at the bottom of the screen. Commands may be typed in to load or save programs, and expressions can be typed in and executed in direct (immediate) mode. If a line of input starts with a number, the language system stores the following line of text as part of program source, allowing a programmer to enter in an entire program line by line, entering line numbers before each statement. When listed on screen, lines are displayed in order of increasing line number. Changes can be made to a displayed line of program source code by moving the cursor to the line with the cursor keys, and typing over the on-screen text. Program source is stored internally in a tokenized form, where reserved words are replaced with a single byte token, to save space and execution time. Programs may be saved in compact tokenized form, or optionally saved as DOS ASCII text files that can be viewed and edited with other programs. Like most other DOS applications, IBM BASIC is a text-mode program and has no features for windows, icons, mouse support, or cut-and-paste editing.

Legacy

GW-BASIC, launched in 1983, is a disk-based Microsoft product that was distributed with non-IBM MS-DOS computers, and supports all the graphics modes and features of BASICA on computers that do not have IBM Cassette BASIC.

The successor to BASICA for MS-DOS and PC DOS versions, now discontinued, is QBasic, launched in 1991. It is a stripped-down version of the Microsoft QuickBASIC compiler: QBasic is an interpreter and cannot compile source files, while QuickBASIC can compile and save the programs in the .EXE executable file format. QuickBASIC also includes certain advanced language statements and functions (mostly involving OS interfacing and low-level machine language programming), supports multi-module programs, and includes advanced debugging features, all of which are absent from QBASIC.

Forensic identification

From Wikipedia, the free encyclopedia

Forensic identification is the application of forensic science, or "forensics", and technology to identify specific objects from the trace evidence they leave, often at a crime scene or the scene of an accident. Forensic means "for the courts".

Human identification

Droplets of human blood. In addition to analyzing for DNA, the droplets are round and show no spattering, indicating they impacted at a relatively slow velocity, in this case from a height of two feet.

People can be identified by their fingerprints. This assertion is supported by the philosophy of friction ridge identification, which states that friction ridge identification is established through the agreement of friction ridge formations, in sequence, having sufficient uniqueness to individualize.

Friction ridge identification is also governed by four premises or statements of facts:

  1. Friction ridges develop on the fetus in their definitive form prior to birth.
  2. Friction ridges are persistent throughout life except for permanent scarring, disease, or decomposition after death.
  3. Friction ridge paths and the details in small areas of friction ridges are unique and never repeated.
  4. Overall, friction ridge patterns vary within limits which allow for classification.

People can also be identified from traces of their DNA from blood, skin, hair, saliva, and semen by DNA fingerprinting, from their ear print, from their teeth or bite by forensic odontology, from a photograph or a video recording by facial recognition systems, from the video recording of their walk by gait analysis, from an audio recording by voice analysis, from their handwriting by handwriting analysis, from the content of their writings by their writing style (e.g. typical phrases, factual bias, and/or misspellings of words), or from other traces using other biometric techniques. Many methods that are used in forensic science evidence have been proven to be unreliable. A lot of trials have been reviewed and testimony involving mostly microscopic hair comparison, but also bite mark, shoe print, soil, fiber, and fingerprint comparisons have been overturned because forensic analysts have provided invalid testimony at the trial.

Since forensic identification has been first introduced to the courts in 1980, the first exoneration due to DNA evidence was in 1989 and there have been 336 additional exonerations since then. Those who specialize in forensic identification continue to make headway with new discoveries and technological advances to make convictions more accurate.

Body identification is a subfield of forensics concerned with identifying someone from their remains, usually from fingerprint analysis, dental analysis, or DNA analysis.

Foot creases

Feet also have friction ridges like fingerprints do. Friction ridges have been widely accepted as a form of identification with fingerprints but not entirely with feet. Feet have creases which remain over time due to the depth it reaches in the dermal layer of the skin, making them permanent. These creases are valuable when individualizing the owner. The concept of no two fingerprints are alike is also applied to foot creases. Foot creases can grow as early as 13 weeks after conception when the volar pads begin to grow and when the pads regress, the creases remain. When foot crease identification is used in a criminal case, it should be used in conjunction with morphology and friction ridges to ensure precise identification. There is record of foot crease identification used in a criminal case to solve a murder. Sometimes with marks left by the foot with ink, blood, mud, or other substances, the appearance of creases or ridges become muddled or extra creases may appear due to cracked skin, folded skin, or fissures. In order to truly compare morphological feature, the prints of feet must be clear enough to distinguish between individuals.

Downfalls

The two basic conceptual foundations of forensic identification are that everyone is individualized and unique. This individualization belief was invented by a police records clerk, Alphonse Bertillon, based on the idea that "nature never repeats," originating from the father of social statistics, Lambert Adolphe Jacques Quetelet. The belief was passed down through generations being generally accepted, but it was never scientifically proven. There was a study done intending to show that no two fingerprints were the same, but the results were inconclusive. Many modern forensic and evidentiary scholars collectively agree that individualization to one object, such as a fingerprint, bite mark, handwriting, or ear mark is not possible. In court cases, forensic scientists can fall victim to observer bias when not sufficiently blinded to the case or results of other pertinent tests. This has happened in cases like United States v. Green and State v. Langill. Also, the proficiency tests that forensic analysts must do are often not as demanding to be considered admissible in court.

Primary methods

According to Interpol, there are 3 primary methods to human identification: Friction Ridge Analysis, Forensic Odontology, and DNA Analysis.

Friction ridge analysis

Fingerprints from the hands and feet are unique and remain unchanged (unless major external factors are involved) from birth to death. Even with minor injuries, they regenerate following the same pattern. 

Considering the existence of databases in states and countries worldwide containing records of fingerprints from their residents, there is the possibility of searching and comparing fingerprints. This enables an accurate comparison for victim identification. 

Odontology analysis

Forensic odontology (dentistry) plays an important role in human identification, especially in cases where individuals are in an advanced stage of decomposition, charred, or skeletonized. This is due to the high resistance of teeth, which can remain intact even after exposure to harsh conditions.

Considering that many people have visited a dentist and have dental records, there is the possibility of retrieving this data for comparison with post-mortem examination data. Such a method enables quick, cost-effective, and reliable identification.

The most commonly used ante-mortem data are dental X-rays, dental models, and dental records. However, these data rely on the existence of dental records registered by a dentist. Nevertheless, even if a person does not have such records, a photograph of their smile or an old dental prosthesis can be used for comparison.

DNA identification

Forensic DNA analysis can be a useful tool in aiding forensic identification because DNA is found in almost all cells of our bodies except mature red blood cells. Deoxyribonucleic acid is located in two different places of the cell, the nucleus; which is inherited from both parents, and the mitochondria; inherited maternally. As with fingerprints, an individual's DNA profile and characteristics are unique.[citation needed] Forensic identification using DNA can be useful in different cases such as determining suspects in violent crimes, solving paternity/maternity, and identifying human remains of victims from mass disasters or missing person cases. It is also used to link suspects or victims to each other or to crime scenes. When a sample is located at a crime scene, it must be collected, processed, and transported, along with a chain of custody, to the laboratory for analysis, so that if a DNA profile is generated it can be accepted in court. Proper evidence collection and preservation is crucial to ensure evidence is not being contaminated. Main procedures investigators must use when packaging biological material is allowing the evidence to air dry and then package into paper bags. Plastic bags should never be used on biological evidence because it could degrade DNA or lead to bacterial growth.

DNA can be sourced from biological material such as semen, blood, saliva, feces, urine, teeth, bone, and hair that is left behind from an individual. There are different presumptive and confirmatory tests used for each type of biological material found at a scene. Presumptive tests are quick, sensitive and are relatively specific to bodily fluids that give the analyst an idea of what might be present. Confirmatory tests confirm what the biological sample is. In addition to looking for biological material at a crime scene, pieces of evidence can also be examined and analyzed for the presence of DNA. Evidence pieces that may have the presence of DNA could include clothing, bedding, weapons, masks, gloves, among many others. This is attributed to touch DNA, where only minute samples are left after an object has been touched. It is defined as “evidence with no visible staining that would likely contain DNA resulting from the transfer of epithelial cells from the skin to an object.”  A forensic scientist can attempt to obtain a DNA profile from the sample with as few as six cells.

The first step in the DNA process with a piece of evidence is extraction. Extraction is a technique used to remove the DNA from the cell. The next step would be quantification which determines how much DNA is present. The third step is amplification in order to yield multiple copies of DNA. Next is separation, to separate the DNA out to use for identification. Finally, the analyst can now complete analysis and interpretation of the DNA sample and compare to known profiles.

An unknown sample found at a crime scene is called a questioned sample. A known sample can be taken either from a suspect or found in a database. The FBI’s database used for DNA is CODIS, Combined DNA Index System. It has data at three levels: local, state, and national. The national level data is stored in NDIS, National DNA Index system. CODIS/NDIS allows analysts to compare their questioned DNA profile among those of arrestees, convicted offenders, and other unknown samples to try and produce investigative leads. If questioned and known samples are similar, statistics and interpretation will then be completed. The DNA profile will be compared to a population database and a random match probability will be determined. Random match probability is defined as the chance that an individual selected randomly from a population will have an identical DNA profile to the markers tested. If they do not equal each other, they are not a match, termed exclusion.

During DNA typing, several markers are examined, termed loci. When more markers are examined, this could result in either a greater probability that two unrelated individuals will have different genotypes or adds to the confidence of connecting an individual to an unknown sample. One locus difference between a questioned and known sample is enough to exclude that suspect as the contributor.

The FBI has identified 13 core STR loci that are effective for human identification. STR is short tandem repeats which are short DNA regions in the genome and are 2-6 base pairs in length. STR is common in forensic analysis because they are easily amplified using polymerase chain reaction (PCR) and they have unique variation among individuals for human identification. PCR is the technique of copying DNA by making millions of copies. When all 13 core loci are tested on a DNA profile, the random match probability is more than one in a trillion.

Since DNA was first used in a criminal investigation in 1986, it has aided investigators to solve many cases. DNA profiling is one of the most important tools in forensics and continued research will increase its ability and accuracy to provide more techniques for the future.

Animal identification

Wildlife forensics

There are many different applications for wildlife forensics and below are only some of the procedures and processes used to distinguish species.

Species identification: The importance of species identification is most prominent in animal populations that are illegally hunted, harvested, and traded, such as rhinoceroses, lions, and African elephants. In order to distinguish which species is which, mtDNA, or mitochondrial DNA, is the most used genetic marker because it is easier to type from highly decomposed and processed tissue compared to nuclear DNA. Additionally, the mitochondrial DNA has multiple copies per cell, which is another reason it's frequently used. When nuclear DNA is used, certain segments of the strands are amplified in order to compare those to segments of mitochondrial DNA. This comparison is used to figure out related genes and species proximity since distant relatives of animals are closer in proximity in the gene tree. That being said, the comparison process demands precision because mistakes can easily be made due to genes evolving and mutating in the evolution of species.

Determination of geographic origin: Determining the origin of a certain species aids research in population numbers and lineage data. Phylogenetic studies are most often used to find the broad geographic area of which a species reside. For example, in California seahorses were being sold for traditional medicinal purposes and the phylogenetic data of those seahorses led researchers to find their origin and from which population they came from and what species they were. In addition to phylogenetic data, assignment tests are used to find the probability of a species belonging to or originating from a specific population and genetic markers of a specimen are utilized. These types of tests are most accurate when all potential population's data have been gathered. Statistical analyses are used in assignment tests based on an individual's microsatellites or Amplified Fragment Length Polymorphisms (AFLPs). Using microsatellites in these studies is more favorable than AFLPs because the AFLPs required non-degraded tissue samples and higher errors have been reported when using AFLPs.

Domestic animal forensics

Domestic animals such as dogs and cats can be utilized to help solve criminal cases. These can include homicides, sexual assaults, or robberies. DNA evidence from dogs alone have helped over 20 criminal cases in Great Britain and the U.S. since 1996. However, there are very few laboratories that are able to process and analyze evidence or data from domestic animals. Forensics can be used in animal attacks as well. In cases such as dog attacks, the hair, blood, and saliva surrounding the wounds a victim has can be analyzed to find a match for the attacker. In the competitive realm, DNA analysis is used in many cases to find illegal substances in racehorses by urine samples and comparisons of STRs.

Product identification

  • Color copiers and maybe some color computer printers steganographically embed their identification number as a countermeasure against currency forgeries.
  • Copiers and computer printers can be potentially identified by the minor variants of the way they feed the paper through the printing mechanism, leaving banding artifacts. Analysis of the toners is also used.
  • Documents are characterized by the composition of their paper and ink.
  • Firearms can be identified by the striations on the bullets they fired and imprints on the cartridge casings.
  • Paper shredders can be potentially identified in a similar way, by spacing and wear of their blades.
  • Photo identification is used to detect and identify forged digital photos.
  • Typewriters can be identified by minor variations of positioning and wear of their letters.
  • Illegal drugs can be identified by which color it turns when a reagent is added during a color test. Gas Chromatography, Infrared Spectrometry or Mass Spectrometry is used in combination with the color test to identify the type of drug.

Networks

Applications

Sometimes, manufacturers and film distributors may intentionally leave subtle forensic markings on their products to identify them in case of piracy or involvement in a crime. (Cf. watermark, digital watermark, steganography. DNA marking.)

Organizations

Politics of Europe

From Wikipedia, the free encyclopedia ...