Search This Blog

Thursday, October 6, 2022

Upper Paleolithic

From Wikipedia, the free encyclopedia
 
Expansion of early modern humans from Africa.

The Upper Paleolithic (or Upper Palaeolithic) is the third and last subdivision of the Paleolithic or Old Stone Age. Very broadly, it dates to between 50,000 and 12,000 years ago (the beginning of the Holocene), according to some theories coinciding with the appearance of behavioral modernity in early modern humans, until the advent of the Neolithic Revolution and agriculture.

Anatomically modern humans (i.e. Homo sapiens) are believed to have emerged in Africa around 300,000 years ago, it has been argued by some that their ways of life changed relatively little from that of archaic humans of the Middle Paleolithic, until about 50,000 years ago, when there was a marked increase in the diversity of artefacts found associated with modern human remains. This period coincides with the most common date assigned to expansion of modern humans from Africa throughout Asia and Eurasia, which contributed to the extinction of the Neanderthals.

The Upper Paleolithic has the earliest known evidence of organized settlements, in the form of campsites, some with storage pits. Artistic work blossomed, with cave painting, petroglyphs, carvings and engravings on bone or ivory. The first evidence of human fishing is also found, from artefacts in places such as Blombos cave in South Africa. More complex social groupings emerged, supported by more varied and reliable food sources and specialized tool types. This probably contributed to increasing group identification or ethnicity.

The peopling of Australia most likely took place before c. 60 ka. Europe was peopled after c. 45 ka. Anatomically modern humans are known to have expanded northward into Siberia as far as the 58th parallel by about 45 ka (Ust'-Ishim man). The Upper Paleolithic is divided by the Last Glacial Maximum (LGM), from about 25 to 15 ka. The peopling of the Americas occurred during this time, with East and Central Asia populations reaching the Bering land bridge after about 35 ka, and expanding into the Americas by about 15 ka. In Western Eurasia, the Paleolithic eases into the so-called Epipaleolithic or Mesolithic from the end of the LGM, beginning 15 ka. The Holocene glacial retreat begins 11.7 ka (10th millennium BC), falling well into the Old World Epipaleolithic, and marking the beginning of the earliest forms of farming in the Fertile Crescent.

Lifestyle and technology

Both Homo erectus and Neanderthals used the same crude stone tools. Archaeologist Richard G. Klein, who has worked extensively on ancient stone tools, describes the stone tool kit of archaic hominids as impossible to categorize. He argues that almost everywhere, whether Asia, Africa or Europe, before 50,000 years ago all the stone tools are much alike and unsophisticated.

Flint Knives, Ahmarian Culture, Nahal Boqer, Israel, 47,000-40,000 BP. Israel Museum.

Firstly among the artefacts of Africa, archeologists found they could differentiate and classify those of less than 50,000 years into many different categories, such as projectile points, engraving tools, knife blades, and drilling and piercing tools. These new stone-tool types have been described as being distinctly differentiated from each other; each tool had a specific purpose. The early modern humans who expanded into Europe, commonly referred to as the Cro-Magnons, left many sophisticated stone tools, carved and engraved pieces on bone, ivory and antler, cave paintings and Venus figurines.

The Neanderthals continued to use Mousterian stone tool technology and possibly Châtelperronian technology. These tools disappeared from the archeological record at around the same time the Neanderthals themselves disappeared from the fossil record, about 40,000 cal BP.

Stone core for making fine blades, Boqer Tachtit, Negev, Israel, circa 40,000 BP.

Settlements were often located in narrow valley bottoms, possibly associated with hunting of passing herds of animals. Some of them may have been occupied year round, though more commonly they appear to have been used seasonally; people moved between the sites to exploit different food sources at different times of the year. Hunting was important, and caribou/wild reindeer "may well be the species of single greatest importance in the entire anthropological literature on hunting."

Technological advances included significant developments in flint tool manufacturing, with industries based on fine blades rather than simpler and shorter flakes. Burins and racloirs were used to work bone, antler and hides. Advanced darts and harpoons also appear in this period, along with the fish hook, the oil lamp, rope, and the eyed needle. Fishing of pelagic fish species and navigating the open ocean is evidenced by sites from Timor and Buka (Solomon Islands).

The changes in human behavior have been attributed to changes in climate, encompassing a number of global temperature drops. These led to a worsening of the already bitter cold of the last glacial period (popularly but incorrectly called the last ice age). Such changes may have reduced the supply of usable timber and forced people to look at other materials. In addition, flint becomes brittle at low temperatures and may not have functioned as a tool.

Changes in climate and geography

The Upper Paleolithic covered the second half of the Last glacial period from 50,000 to 10,000 before present, until the warming of the Holocene. Ice core data from Antarctica and Greenland.

The climate of the period in Europe saw dramatic changes, and included the Last Glacial Maximum, the coldest phase of the last glacial period, which lasted from about 26.5 to 19 kya, being coldest at the end, before relatively rapid warming (all dates vary somewhat for different areas, and in different studies). During the Maximum, most of Northern Europe was covered by an ice-sheet, forcing human populations into the areas known as Last Glacial Maximum refugia, including modern Italy and the Balkans, parts of the Iberian Peninsula and areas around the Black Sea.

This period saw cultures such as the Solutrean in France and Spain. Human life may have continued on top of the ice sheet, but we know next to nothing about it, and very little about the human life that preceded the European glaciers. In the early part of the period, up to about 30 kya, the Mousterian Pluvial made northern Africa, including the Sahara, well-watered and with lower temperatures than today; after the end of the Pluvial the Sahara became arid.

European Last Glacial Maximum refuges, 20,000 BP.
  Solutrean and Proto Solutrean Cultures
  Epigravettian Culture

The Last Glacial Maximum was followed by the Allerød oscillation, a warm and moist global interstadial that occurred around 13.5 to 13.8 kya. Then there was a very rapid onset, perhaps within as little as a decade, of the cold and dry Younger Dryas climate period, giving sub-arctic conditions to much of northern Europe. The Preboreal rise in temperatures also began sharply around 10.3 kya, and by its end around 9.0 kya had brought temperatures nearly to present day levels, although the climate was wetter. This period saw the Upper Paleolithic give way to the start of the following Mesolithic cultural period.

As the glaciers receded sea levels rose; the English Channel, Irish Sea and North Sea were land at this time, and the Black Sea a fresh-water lake. In particular the Atlantic coastline was initially far out to sea in modern terms in most areas, though the Mediterranean coastline has retreated far less, except in the north of the Adriatic and the Aegean. The rise in sea levels continued until at least 7.5 kya (5500 BC), so evidence of human activity along Europe's coasts in the Upper Paleolithic is mostly lost, though some traces have been recovered by fishing boats and marine archaeology, especially from Doggerland, the lost area beneath the North Sea.

Timeline

50,000–40,000 BP

Anatomically Modern Humans known archaeological remains in Europe and Africa, directly dated, calibrated carbon dates as of 2013.
 
Layer sequence at Ksar Akil in the Levantine corridor, and discovery of two fossils of Homo sapiens, dated to 40,800 to 39,200 years BP for "Egbert", and 42,400–41,700 BP for "Ethelruda".

50,000 BP

  • Numerous Aboriginal stone tools were found in gravel sediments in Castlereagh, Sydney, Australia. At first when these results were new they were controversial; more recently dating of the same strata has revised and corroborated these dates.
  • Start of the Mousterian Pluvial in North Africa.
  • Occupants of the Fa-Hien Lena cave, Sri Lanka had developed bow and arrow technology 48,000 BP (though the earliest known bow and arrow technology dates to about 65,000 BP from Sibudu Cave, South Africa).

45,000–43,000 BP

  • Earliest evidence of modern humans found in Europe, in Southern Italy. These are indirectly dated.
  • Earliest mathematical artifact, the notched Lebombo bone, a possible tally stick or lunar calendar, dated to 44,000–43,000 BP in Eswatini (Swaziland), southern Africa
  • Oldest-known mining in archaeological record, the Ngwenya Mine in Swaziland, at about 43,000 years ago, where humans mined hematite to make the red pigment ochre
  • Earliest directly dated figurative cave art of mankind at Leang Bulu' Sipong on Sulawesi, Indonesia.

43,000–41,000 BP

40,000–30,000 BP

40,000–35,000 BP

Venus of Laussel, an Upper Paleolithic (Gravettian) carving.

35,000 BP

30,000 BP

30,000–20,000 BP

29,000–25,000 BP

24,000 BP

23,000 BP

22,000 BP

21,000 BP

  • Artifacts suggests early human activity occurred at some point in Canberra, Australia. Archaeological evidence of settlement in the region includes inhabited rock shelters, rock art, burial places, camps and quarry sites, and stone tools and arrangements.
  • End of the second Mousterian Pluvial in North Africa.

20,000–10,000 BP

  • Last Glacial Maximum. Mean sea levels are believed to be 110 to 120 metres (360 to 390 ft) lower than present, with the direct implication that many coastal and lower riverine valley archaeological sites of interest are today under water.

18,000 BP

17,000 BP

  • Spotted human hands are painted at Pech Merle cave, Dordogne, France. Discovered in December 1994.
  • Oldest Dryas stadial.
  • Hall of Bulls at Lascaux in France is painted. Discovered in 1940. Closed to the public in 1963.
  • Bird-Headed man with bison and Rhinoceros, Lascaux, is painted.
  • Lamp with ibex design, from La Mouthe cave, Dordogne, France, is made. It is now at Musée des Antiquités Nationales, Saint-Germain-en-Laye.
  • Paintings in Cosquer Cave are made, where the cave mouth is now under water at Cap Margiou, France.

15,000 BP

  • Bølling interstadial.
  • Bison, Le Tuc d'Audoubert, Ariège, France.
  • Paleo-Indians move across North America, then southward through Central America.
  • Pregnant woman and deer (?), from Laugerie-Basse, France was made. It is now at Musée des Antiquités Nationales, St.-Germain-en-Laye.

14,000 BP

Reindeer Age articles

12,000 BP

11,000 BP

  • First evidence of human settlement in Argentina.
  • The Arlington Springs Man dies on the island of Santa Rosa, off the coast of California, United States.
  • Human remains deposited in caves which are now located off the coast of Yucatán, Mexico.
  • Creswellian culture settlement on Hengistbury Head, England, dates from around this year.

10,000 BP

Cultures

The Upper Paleolithic in the Franco-Cantabrian region:

  • The Châtelperronian culture was located around central and south western France, and northern Spain. It appears to be derived from the Mousterian culture, and represents the period of overlap between Neanderthals and Homo sapiens. This culture lasted from approximately 45,000 BP to 40,000 BP.
  • The Aurignacian culture was located in Europe and south west Asia, and flourished between 43,000 and 26,000 BP. It may have been contemporary with the Périgordian (a contested grouping of the earlier Châtelperronian and later Gravettian cultures).
  • The Gravettian culture was located across Europe. Gravettian sites generally date between 33,000 and 20,000 BP.
  • The Solutrean culture was located in eastern France, Spain, and England. Solutrean artifacts have been dated c. 22,000 to 17,000 BP.
  • The Magdalenian culture left evidence from Portugal to Poland during the period from 17,000 to 12,000 BP.

Wednesday, October 5, 2022

Solar activity and climate

From Wikipedia, the free encyclopedia
 
The graph shows the solar irradiance without a long-term trend. The 11 year solar cycle is also visible. The temperature, in contrast, shows an upward trend.
Solar irradiance (yellow) plotted with temperature (red) since 1880.

Patterns of solar irradiance and solar variation have been a main driver of climate change over the millions to billions of years of the geologic time scale, but their role in recent warming is insignificant. Evidence that this is the case comes from analysis on many timescales and from many sources, including: direct observations; composites from baskets of different proxy observations; and numerical climate models. On millennial timescales, paleoclimate indicators have been compared to cosmogenic isotope abundances as the latter are a proxy for solar activity. These have also been used on century times scales but, in addition, instrumental data are increasingly available (mainly telescopic observations of sunspots and thermometer measurements of air temperature) and show that, for example, the temperature fluctuations do not match the solar activity variations and that the commonly-invoked association of the Little Ice Age with the Maunder minimum is far too simplistic as, although solar variations may have played a minor role, a much bigger factor is known to be Little Ice Age volcanism. In recent decades observations of unprecedented accuracy, sensitivity and scope (of both solar activity and terrestrial climate) have become available from spacecraft and show unequivocally that recent global warming is not caused by changes in the Sun.

Geologic time

Earth formed around 4.54 billion years ago by accretion from the solar nebula. Volcanic outgassing probably created the primordial atmosphere, which contained almost no oxygen and would have been toxic to humans and most modern life. Much of the Earth was molten because of frequent collisions with other bodies which led to extreme volcanism. Over time, the planet cooled and formed a solid crust, eventually allowing liquid water to exist on the surface.

Three to four billion years ago the Sun emitted only 70% of its current power. Under the present atmospheric composition, this past solar luminosity would have been insufficient to prevent water from uniformly freezing. There is nonetheless evidence that liquid water was already present in the Hadean and Archean eons, leading to what is known as the faint young Sun paradox. Hypothesized solutions to this paradox include a vastly different atmosphere, with much higher concentrations of greenhouse gases than currently exist.

Over the following approximately 4 billion years, the Sun's energy output increased and the composition of the Earth atmosphere changed. The Great Oxygenation Event around 2.4 billion years ago was the most notable alteration of the atmosphere. Over the next five billion years, the Sun's ultimate death as it becomes a very bright red giant and then a very faint white dwarf will have dramatic effects on climate, with the red giant phase likely already ending any life on Earth.

Measurement

Since 1978, solar irradiance has been directly measured by satellites with very good accuracy. These measurements indicate that the Sun's total solar irradiance fluctuates by +-0.1% over the ~11 years of the solar cycle, but that its average value has been stable since the measurements started in 1978. Solar irradiance before the 1970s is estimated using proxy variables, such as tree rings, the number of sunspots, and the abundances of cosmogenic isotopes such as 10Be, all of which are calibrated to the post-1978 direct measurements.

Modelled simulation of the effect of various factors (including GHGs, Solar irradiance) singly and in combination, showing in particular that solar activity produces a small and nearly uniform warming, unlike what is observed.

Solar activity has been on a declining trend since the 1960s, as indicated by solar cycles 19-24, in which the maximum number of sunspots were 201, 111, 165, 159, 121 and 82, respectively. In the three decades following 1978, the combination of solar and volcanic activity is estimated to have had a slight cooling influence. A 2010 study found that the composition of solar radiation might have changed slightly, with in an increase of ultraviolet radiation and a decrease in other wavelengths."

Modern era

In the modern era, the Sun has operated within a sufficiently narrow band that climate has been little affected. Models indicate that the combination of solar variations and volcanic activity can explain periods of relative warmth and cold between A.D. 1000 and 1900.

The Holocene

Numerous paleoenvironmental reconstructions have looked for relationships between solar variability and climate. Arctic paleoclimate, in particular, has linked total solar irradiance variations and climate variability. A 2001 paper identified a ~1500 year solar cycle that was a significant influence on North Atlantic climate throughout the Holocene.

Little Ice Age

One historical long-term correlation between solar activity and climate change is the 1645–1715 Maunder minimum, a period of little or no sunspot activity which partially overlapped the "Little Ice Age" during which cold weather prevailed in Europe. The Little Ice Age encompassed roughly the 16th to the 19th centuries. Whether the low solar activity or other factors caused the cooling is debated.

The Spörer Minimum between 1460 and 1550 was matched to a significant cooling period.

A 2012 paper instead linked the Little Ice Age to volcanism, through an "unusual 50-year-long episode with four large sulfur-rich explosive eruptions," and claimed "large changes in solar irradiance are not required" to explain the phenomenon.

A 2010 paper suggested that a new 90-year period of low solar activity would reduce global average temperatures by about 0.3 °C, which would be far from enough to offset the increased forcing from greenhouse gases.

Fossil fuel era

1979–2009: Over the past 3 decades, terrestrial temperature has not correlated with sunspot trends. The top plot is of sunspots, while below is the global atmospheric temperature trend. El Chichón and Pinatubo were volcanoes, while El Niño is part of ocean variability. The effect of greenhouse gas emissions is on top of those fluctuations.
 
Multiple factors have affected terrestrial climate change, including natural climate variability and human influences such as greenhouse gas emissions and land use change on top of any effects of solar variability.

The link between recent solar activity and climate has been quantified and is not a major driver of the warming that has occurred since early in the twentieth century. Human-induced forcings are needed to reproduce the late-20th century warming. Some studies associate solar cycle-driven irradiation increases with part of twentieth century warming.

Three mechanisms are proposed by which solar activity affects climate:

  • Solar irradiance changes directly affecting the climate ("radiative forcing"). This is generally considered to be a minor effect, as the measured amplitudes of the variations are too small to have significant effect, absent some amplification process.
  • Variations in the ultraviolet component. The UV component varies by more than the total, so if UV were for some (as yet unknown) reason to have a disproportionate effect, this might explain a larger solar signal.
  • Effects mediated by changes in galactic cosmic rays (which are affected by the solar wind) such as changes in cloud cover.

Climate models have been unable to reproduce the rapid warming observed in recent decades when they only consider variations in total solar irradiance and volcanic activity. Hegerl et al. (2007) concluded that greenhouse gas forcing had "very likely" caused most of the observed global warming since the mid-20th century. In making this conclusion, they allowed for the possibility that climate models had been underestimating the effect of solar forcing.

Another line of evidence comes from looking at how temperatures at different levels in the Earth's atmosphere have changed. Models and observations show that greenhouse gas results in warming of the troposphere, but cooling of the stratosphere. Depletion of the ozone layer by chemical refrigerants stimulated a stratospheric cooling effect. If the Sun was responsible for observed warming, warming of the troposphere at the surface and warming at the top of the stratosphere would be expected as the increased solar activity would replenish ozone and oxides of nitrogen.

Lines of evidence

The assessment of the solar activity/climate relationship involves multiple, independent lines of evidence.

Sunspots

CO2, temperature, and sunspot activity since 1850

Early research attempted to find a correlation between weather and sunspot activity, mostly without notable success. Later research has concentrated more on correlating solar activity with global temperature.

Irradiation

Solar forcing 1850–2050 used in a NASA GISS climate model. Recent variation pattern used after 2000.

Accurate measurement of solar forcing is crucial to understanding possible solar impact on terrestrial climate. Accurate measurements only became available during the satellite era, starting in the late 1970s, and even that is open to some residual disputes: different teams find different values, due to different methods of cross-calibrating measurements taken by instruments with different spectral sensitivity. Scafetta and Willson argue for significant variations of solar luminosity between 1980 and 2000, but Lockwood and Frohlich find that solar forcing declined after 1987.

The 2001 Intergovernmental Panel on Climate Change (IPCC) Third Assessment Report (TAR) concluded that the measured impact of recent solar variation is much smaller than the amplification effect due to greenhouse gases, but acknowledged that scientific understanding is poor with respect to solar variation.

Estimates of long-term solar irradiance changes have decreased since the TAR. However, empirical results of detectable tropospheric changes have strengthened the evidence for solar forcing of climate change. The most likely mechanism is considered to be some combination of direct forcing by TSI changes and indirect effects of ultraviolet (UV) radiation on the stratosphere. Least certain are indirect effects induced by galactic cosmic rays.

In 2002, Lean et al. stated that while "There is ... growing empirical evidence for the Sun's role in climate change on multiple time scales including the 11-year cycle", "changes in terrestrial proxies of solar activity (such as the 14C and 10Be cosmogenic isotopes and the aa geomagnetic index) can occur in the absence of long-term (i.e., secular) solar irradiance changes ... because the stochastic response increases with the cycle amplitude, not because there is an actual secular irradiance change." They conclude that because of this, "long-term climate change may appear to track the amplitude of the solar activity cycles," but that "Solar radiative forcing of climate is reduced by a factor of 5 when the background component is omitted from historical reconstructions of total solar irradiance ...This suggests that general circulation model (GCM) simulations of twentieth century warming may overestimate the role of solar irradiance variability." A 2006 review suggested that solar brightness had relatively little effect on global climate, with little likelihood of significant shifts in solar output over long periods of time. Lockwood and Fröhlich, 2007, found "considerable evidence for solar influence on the Earth's pre-industrial climate and the Sun may well have been a factor in post-industrial climate change in the first half of the last century", but that "over the past 20 years, all the trends in the Sun that could have had an influence on the Earth's climate have been in the opposite direction to that required to explain the observed rise in global mean temperatures." In a study that considered geomagnetic activity as a measure of known solar-terrestrial interaction, Love et al. found a statistically significant correlation between sunspots and geomagnetic activity, but not between global surface temperature and either sunspot number or geomagnetic activity.

Benestad and Schmidt concluded that "the most likely contribution from solar forcing a global warming is 7 ± 1% for the 20th century and is negligible for warming since 1980." This paper disagreed with Scafetta and West, who claimed that solar variability has a significant effect on climate forcing. Based on correlations between specific climate and solar forcing reconstructions, they argued that a "realistic climate scenario is the one described by a large preindustrial secular variability (e.g., the paleoclimate temperature reconstruction by Moberg et al.) with TSI experiencing low secular variability (as the one shown by Wang et al.). Under this scenario, they claimed the Sun might have contributed 50% of the observed global warming since 1900. Stott et al. estimated that the residual effects of the prolonged high solar activity during the last 30 years account for between 16% and 36% of warming from 1950 to 1999.

Direct measurement and time series

Update on the 2007 solar change and climate paper by Lockwood and Fröhlich, extending the data to the present day. Panels from top to bottom show: global mean air surface temperature anomaly from the HadCRUT4 dataset; the mixing ratio of Carbon dioxide in Earth's atmosphere from observations (blue dots) and ice cores (mauve line); the international sunspot number , smoothed using averaging intervals between 8 years and 14 years (the black line connects the yellow points where the mean is independent of and so shows the solar activity trend without making an assumption about the solar cycle length); the total solar irradiance () the blue dots are the PMOD composite of observations  and the black and mauve lines are annual and 11-year means of the SATIRE-T2 model of the effect of sunspots and faculae with the addition of a quiet-Sun variation derived from cosmic ray fluxes and cosmogenic isotopes; the open solar flux from (mauve line) geomagnetic observations and (blue dots) spacecraft data; Oulu neutron monitor cosmic ray counts, , (blue dots) observed and (mauve line) extrapolated using cosmogenic isotope data; and (grey) monthly and (mauve) annual international sunspot numbers, . The green and yellow shaded bands show sunspot cycles 14 and 24

Neither direct measurements nor proxies of solar variation correlate well with Earth global temperature, particularly in recent decades when both quantities are best known. 

The oppositely-directed trends highlighted by Lockwood and Fröhlich in 2007, with global mean temperatures continuing to rise while solar activity fell, have continued and become even more pronounced since then. In 2007 the difference in the trends was apparent after about 1987 and that difference has grown and accelerated in subsequent years. The updated figure (right) shows the variations and contrasts solar cycles 14 and 24, a century apart, that are quite similar in all solar activity measures (in fact cycle 24 is slightly less active than cycle 14 on average), yet the global mean air surface temperature is more than 1 degree Celsius higher for cycle 24 than cycle 14, showing the rise is not associated with solar activity. The total solar irradiance (TSI) panel shows the PMOD composite of observations with a modelled variation from the SATIRE-T2 model of the effect of sunspots and faculae with the addition of a quiet -Sun variation (due to sub-resolution photospheric features and any solar radius changes) derived from correlations with comic ray fluxes and cosmogenic isotopes. The finding that solar activity was approximately the same in cycles 14 and 24 applies to all solar outputs that have, in the past, been proposed as a potential cause of terrestrial climate change and includes total solar irradiance, cosmic ray fluxes, spectral UV irradiance, solar wind speed and/or density, heliospheric magnetic field and its distribution of orientations and the consequent level of geomagnetic activity.

Daytime/nighttime

Global average diurnal temperature range has decreased. Daytime temperatures have not risen as fast as nighttime temperatures. This is the opposite of the expected warming if solar energy (falling primarily or wholly during daylight, depending on energy regime) were the principal means of forcing. It is, however, the expected pattern if greenhouse gases were preventing radiative escape, which is more prevalent at night.

Hemisphere and latitude

The Northern Hemisphere is warming faster than the Southern Hemisphere. This is the opposite of the expected pattern if the Sun, currently closer to the Earth during austral summer, were the principal climate forcing. In particular, the Southern Hemisphere, with more ocean area and less land area, has a lower albedo ("whiteness") and absorbs more light. The Northern Hemisphere, however, has higher population, industry and emissions.

Furthermore, the Arctic region is warming faster than the Antarctic and faster than northern mid-latitudes and subtropics, despite polar regions receiving less sun than lower latitudes.

Altitude

Solar forcing should warm Earth's atmosphere roughly evenly by altitude, with some variation by wavelength/energy regime. However, the atmosphere is warming at lower altitudes while cooling higher up. This is the expected pattern if greenhouse gases drive temperature, as on Venus.

Solar variation theory

A 1994 study of the US National Research Council concluded that TSI variations were the most likely cause of significant climate change in the pre-industrial era, before significant human-generated carbon dioxide entered the atmosphere.

Scafetta and West correlated solar proxy data and lower tropospheric temperature for the preindustrial era, before significant anthropogenic greenhouse forcing, suggesting that TSI variations may have contributed 50% of the warming observed between 1900 and 2000 (although they conclude "our estimates about the solar effect on climate might be overestimated and should be considered as an upper limit.") If interpreted as a detection rather than an upper limit, this would contrast with global climate models predicting that solar forcing of climate through direct radiative forcing makes an insignificant contribution.

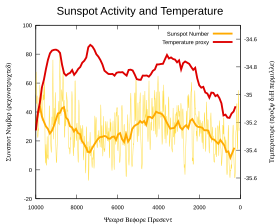
Sunspot and temperature reconstructions from proxy data

In 2000, Stott and others reported on the most comprehensive model simulations of 20th century climate to that date. Their study looked at both "natural forcing agents" (solar variations and volcanic emissions) as well as "anthropogenic forcing" (greenhouse gases and sulphate aerosols). They found that "solar effects may have contributed significantly to the warming in the first half of the century although this result is dependent on the reconstruction of total solar irradiance that is used. In the latter half of the century, we find that anthropogenic increases in greenhouses gases are largely responsible for the observed warming, balanced by some cooling due to anthropogenic sulphate aerosols, with no evidence for significant solar effects." Stott's group found that combining these factors enabled them to closely simulate global temperature changes throughout the 20th century. They predicted that continued greenhouse gas emissions would cause additional future temperature increases "at a rate similar to that observed in recent decades". In addition, the study notes "uncertainties in historical forcing" — in other words, past natural forcing may still be having a delayed warming effect, most likely due to the oceans.

Stott's 2003 work largely revised his assessment, and found a significant solar contribution to recent warming, although still smaller (between 16 and 36%) than that of greenhouse gases.

A study in 2004 concluded that solar activity affects the climate - based on sunspot activity, yet plays only a small role in the current global warming.

Correlations to solar cycle length

In 1991, Friis-Christensen and Lassen claimed a strong correlation of the length of the solar cycle with northern hemispheric temperature changes. They initially used sunspot and temperature measurements from 1861 to 1989 and later extended the period using four centuries of climate records. Their reported relationship appeared to account for nearly 80 per cent of measured temperature changes over this period. The mechanism behind these claimed correlations was a matter of speculation.

In a 2003 paper Laut identified problems with some of these correlation analyses. Damon and Laut claimed:

the apparent strong correlations displayed on these graphs have been obtained by incorrect handling of the physical data. The graphs are still widely referred to in the literature, and their misleading character has not yet been generally recognized.

Damon and Laut stated that when the graphs are corrected for filtering errors, the sensational agreement with the recent global warming, which drew worldwide attention, totally disappeared.

In 2000, Lassen and Thejll updated their 1991 research and concluded that while the solar cycle accounted for about half the temperature rise since 1900, it failed to explain a rise of 0.4 °C since 1980. Benestad's 2005 review found that the solar cycle did not follow Earth's global mean surface temperature.

Weather

Solar activity may also impact regional climates, such as for the rivers Paraná and Po. Measurements from NASA's Solar Radiation and Climate Experiment show that solar UV output is more variable than total solar irradiance. Climate modelling suggests that low solar activity may result in, for example, colder winters in the US and northern Europe and milder winters in Canada and southern Europe, with little change in global averages. More broadly, links have been suggested between solar cycles, global climate and regional events such as El Niño. Hancock and Yarger found "statistically significant relationships between the double [~21-year] sunspot cycle and the 'January thaw' phenomenon along the East Coast and between the double sunspot cycle and 'drought' (June temperature and precipitation) in the Midwest."

Cloud condensation

Recent research at CERN's CLOUD facility examined links between cosmic rays and cloud condensation nuclei, demonstrating the effect of high-energy particulate radiation in nucleating aerosol particles that are precursors to cloud condensation nuclei. Kirkby (CLOUD team leader) said, "At the moment, it [the experiment] actually says nothing about a possible cosmic-ray effect on clouds and climate." After further investigation, the team concluded that "variations in cosmic ray intensity do not appreciably affect climate through nucleation."

1983–1994 global low cloud formation data from the International Satellite Cloud Climatology Project (ISCCP) was highly correlated with galactic cosmic ray (GCR) flux; subsequent to this period, the correlation broke down. Changes of 3–4% in cloudiness and concurrent changes in cloud top temperatures correlated to the 11 and 22-year solar (sunspot) cycles, with increased GCR levels during "antiparallel" cycles. Global average cloud cover change was measured at 1.5–2%. Several GCR and cloud cover studies found positive correlation at latitudes greater than 50° and negative correlation at lower latitudes. However, not all scientists accept this correlation as statistically significant, and some who do attribute it to other solar variability (e.g. UV or total irradiance variations) rather than directly to GCR changes. Difficulties in interpreting such correlations include the fact that many aspects of solar variability change at similar times, and some climate systems have delayed responses.

Historical perspective

Physicist and historian Spencer R. Weart in The Discovery of Global Warming (2003) wrote:

The study of [sun spot] cycles was generally popular through the first half of the century. Governments had collected a lot of weather data to play with and inevitably people found correlations between sun spot cycles and select weather patterns. If rainfall in England didn't fit the cycle, maybe storminess in New England would. Respected scientists and enthusiastic amateurs insisted they had found patterns reliable enough to make predictions. Sooner or later though every prediction failed. An example was a highly credible forecast of a dry spell in Africa during the sunspot minimum of the early 1930s. When the period turned out to be wet, a meteorologist later recalled "the subject of sunspots and weather relationships fell into dispute, especially among British meteorologists who witnessed the discomfiture of some of their most respected superiors." Even in the 1960s he said, "For a young [climate] researcher to entertain any statement of sun-weather relationships was to brand oneself a crank."


Covalent organic framework

From Wikipedia, the free encyclopedia

Covalent organic frameworks (COFs) are a class of materials that form two- or three- dimensional structures through reactions between organic precursors resulting in strong, covalent bonds to afford porous, stable, and crystalline materials. COFs emerged as a field from the overarching domain of organic materials as researchers optimized both synthetic control and precursor selection. These improvements to coordination chemistry enabled non-porous and amorphous organic materials such as organic polymers to advance into the construction of porous, crystalline materials with rigid structures that granted exceptional material stability in a wide range of solvents and conditions. Through the development of reticular chemistry, precise synthetic control was achieved and resulted in ordered, nano-porous structures with highly preferential structural orientation and properties which could be synergistically enhanced and amplified. With judicious selection of COF secondary building units (SBUs), or precursors, the final structure could be predetermined, and modified with exceptional control enabling fine-tuning of emergent properties. This level of control facilitates the COF material to be designed, synthesized, and utilized in various applications, many times with metrics on scale or surpassing that of the current state-of-the-art approaches.

History

While at University of Michigan, Omar M. Yaghi (currently at UCBerkeley) and Adrien P Cote published the first paper of COFs in 2005, reporting a series of 2D COFs. They reported the design and successful synthesis of COFs by condensation reactions of phenyl diboronic acid (C6H4[B(OH)2]2) and hexahydroxytriphenylene (C18H6(OH)6). Powder X-ray diffraction studies of the highly crystalline products having empirical formulas (C3H2BO)6·(C9H12)1 (COF-1) and C9H4BO2 (COF-5) revealed 2-dimensional expanded porous graphitic layers that have either staggered conformation (COF-1) or eclipsed conformation (COF-5). Their crystal structures are entirely held by strong bonds between B, C, and O atoms to form rigid porous architectures with pore sizes ranging from 7 to 27 Angstroms. COF-1 and COF-5 exhibit high thermal stability (to temperatures up to 500 to 600 C), permanent porosity, and high surface areas (711 and 1590 square meters per gram, respectively).

The synthesis of 3D COFs has been hindered by longstanding practical and conceptual challenges until it was first achieved in 2007 by Omar M. Yaghi and colleagues. Unlike 0D and 1D systems, which are soluble, the insolubility of 2D and 3D structures precludes the use of stepwise synthesis, making their isolation in crystalline form very difficult. This first challenge, however, was overcome by judiciously choosing building blocks and using reversible condensation reactions to crystallize COFs.

Structure

Porous crystalline solids consists of secondary building units (SBUs) which assemble to form a periodic and porous framework. An almost infinite numbers of frameworks can be formed through various SBU combinations leading to unique material properties for applications in separations, storage, and heterogeneous catalysis.

Types of porous crystalline solids include zeolites, metal-organic frameworks (MOFs), and covalent organic frameworks (COFs). Zeolites are microporous, aluminosilicate minerals commonly used as commercial adsorbents. MOFs are a class of porous polymeric material, consisting of metal ions linked together by organic bridging ligands and are a new development on the interface between molecular coordination chemistry and materials science.

COFs are another class of porous polymeric materials, consisting of porous, crystalline, covalent bonds that usually have rigid structures, exceptional thermal stabilities (to temperatures up to 600 °C), are stable in water and low densities. They exhibit permanent porosity with specific surface areas surpassing those of well-known zeolites and porous silicates.

Secondary Building Units

Schematic Figure of Reticular Chemistry.

The term ‘secondary building unit’ has been used for some time to describe conceptual fragments which can be compared as bricks used to build a house of zeolites; in the context of this page it refers to the geometry of the units defined by the points of extension.

Reticular Synthesis

Reticular synthesis enables facile bottom-up synthesis of the framework materials to introduce precise perturbations in chemical composition, resulting in the highly controlled tunability of framework properties. Through a bottom-up approach, a material is built from atomic or molecular components synthetically as opposed to a top-down approach, which forms a material from the bulk through approaches such as exfoliation, lithography, or other varieties of post-synthetic modification. The bottom-up approach is especially advantageous with respect to materials such as COFs because the synthetic methods are designed to directly result in an extended, highly crosslinked framework that can be tuned with exceptional control at the nanoscale level. Geometrical and dimensional principles govern the framework's resulting topology as the SBUs combine to form predetermined structures. This level of synthetic control has also been termed "molecular engineering", abiding by the concept termed by Arthur R. von Hippel in 1956.

COF topological control through judicious selection of precursors that result in bonding directionality in the final resulting network. Adapted from Jiang and coworkers' Two- and Three-dimensional Covalent Organic Frameworks (COFs).

It has been established in the literature that, when integrated into an isoreticular framework, such as a COF, properties from monomeric compounds can be synergistically enhanced and amplified. COF materials possess the unique ability for bottom-up reticular synthesis to afford robust, tunable frameworks that synergistically enhance the properties of the precursors, which, in turn, offers many advantages in terms of improved performance in different applications. As a result, the COF material is highly modular and tuned efficiently by varying the SBUs’ identity, length, and functionality depending on the desired property change on the framework scale. Ergo, there exists the ability to introduce diverse functionality directly into the framework scaffold to allow for a variety of functions which would be cumbersome, if not impossible, to achieve through a top-down method. such as lithographic approaches or chemical-based nanofabrication. Through reticular synthesis, it is possible to molecularly engineer modular, framework materials with highly porous scaffolds that exhibit unique electronic, optical, and magnetic properties while simultaneously integrating desired functionality into the COF skeleton.

Reticular synthesis is different from retrosynthesis of organic compounds, because the structural integrity and rigidity of the building blocks in reticular synthesis remain unaltered throughout the construction process—an important aspect that could help to fully realize the benefits of design in crystalline solid-state frameworks. Similarly, reticular synthesis should be distinguished from supramolecular assembly, because in the former, building blocks are linked by strong bonds throughout the crystal.

Synthetic Chemistry

Reversible reactions for COF formation featuring boron to form a variety of linkages (boronate, boroxine, and borazine).

Reticular synthesis was used by Yaghi and coworkers in 2005 to construct the first two COFs reported in the literature: COF-1, using a dehydration reaction of benzenediboronic acid (BDBA), and COF-5, via a condensation reaction between hexahydroxytriphenylene (HHTP) and BDBA. These framework scaffolds were interconnected through the formation of boroxine and boronate linkages, respectively, using solvothermal synthetic methods.

COF Linkages

Since Yaghi and coworkers’ seminal work in 2005, COF synthesis has expanded to include a wide range of organic connectivity such as boron-, nitrogen-, other atom-containing linkages. The linkages in the figures shown are not comprehensive as other COF linkages exist in the literature, especially for the formation of 3D COFs.

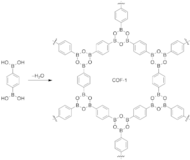
Skeletal structure of COF-1 consisting of phenyl rings joined by boroxine rings, synthesized by a condensation reaction of phenyldiboronic acid.

Boron condensation

The most popular COF synthesis route is a boron condensation reaction which is a molecular dehydration reaction between boronic acids. In case of COF-1, three boronic acid molecules converge to form a planar six-membered B3O3 (boroxine) ring with the elimination of three water molecules.

Reversible reactions for COF formation featuring nitrogen to form a variety of linkages (imine, hydrazone, azine, squaraine, phenazine, imide, triazine).

Triazine based trimerization

Formation of CTF-1 COF featuring triazine linkages.

Another class of high performance polymer frameworks with regular porosity and high surface area is based on triazine materials which can be achieved by dynamic trimerization reaction of simple, cheap, and abundant aromatic nitriles in ionothermal conditions (molten zinc chloride at high temperature (400 °C)). CTF-1 is a good example of this chemistry.

Imine condensation

A structural representation of the TpOMe-DAQ COF
 
Reversible reactions for COF formation featuring a variety of atoms to form different linkages (a double stage connecting boronate ester and imine linkages, alkene, silicate, nitroso).

The imine condensation reaction which eliminates water (exemplified by reacting aniline with benzaldehyde using an acid catalyst) can be used as a synthetic route to reach a new class of COFs. The 3D COF called COF-300 and the 2D COF named TpOMe-DAQ are good examples of this chemistry. When 1,3,5-triformylphloroglucinol (TFP) is used as one of the SBUs, two complementary tautomerizations occur (an enol to keto and an imine to enamine) which result in a β-ketoenamine moiety as depicted in the DAAQ-TFP framework. Both DAAQ-TFP and TpOMe-DAQ COFs are stable in acidic aqueous conditions and contain the redox active linker 2,6-diaminoanthroquinone which enables these materials to reversibly store and release electrons within a characteristic potential window. Consequently, both of these COFs have been investigated as electrode materials for potential use in supercapacitors.

A structural representation of the DAAQ-TFP COF

Solvothermal Synthesis

The solvothermal approach is the most common used in the literature but typically requires long reaction times due to the insolubility of the organic SBUs in nonorganic media and the time necessary to reach thermodynamic COF products.

Templated Synthesis

Morphological control on the nanoscale is still limited as COFs lack synthetic control in higher dimensions due to the lack of dynamic chemistry during synthesis. To date, researchers have attempted to establish better control through different synthetic methods such as solvothermal synthesis, interface-assisted synthesis, solid templation as well as seeded growth. First one of the precursors is deposited onto the solid support followed by the introduction of the second precursor in vapor form. This results in the deposition of the COF as a thin film on the solid support.

Properties

Porosity

A defining advantage of COFs is the exceptional porosity that results from the substitution of analogous SBUs of varying sizes. Pore sizes range from 7-23 Å and feature a diverse range of shapes and dimensionalities that remain stable during the evacuation of solvent. The rigid scaffold of the COF structure enables the material to be evacuated of solvent and retain its structure, resulting in high surface areas as seen by the Brunauer–Emmett–Teller analysis. This high surface area to volume ratio and incredible stability enables the COF structure to serve as exceptional materials for gas storage and separation.

Crystallinity

There are several COF single crystals synthesized to date. There are a variety of techniques employed to improve crystallinity of COFs. The use of modulators, monofunctional version of precursors, serve to slow the COF formation to allow for more favorable balance between kinetic and thermodynamic control, hereby enabling crystalline growth. This was employed by Yaghi and coworkers for 3D imine-based COFs (COF-300, COF 303, LZU-79, and LZU-111). However, the vast majority of COFs are not able to crystallize into single crystals but instead are insoluble powders. The improvement of crystallinity of these polycrystalline materials can be improved through tuning the reversibility of the linkage formation to allow for corrective particle growth and self-healing of defects that arise during COF formation.

Conductivity

In a fully conjugated 2D COF material such as those synthesized from metallophthalocyanines and highly conjugated organic linkers, charge transport is increased both in-plane, as well as through the stacks, resulting in increased conductivity.

Integration of SBUs into a covalent framework results in the synergistic emergence of conductivities much greater than the monomeric values. The nature of the SBUs can improve conductivity. Through the use of highly conjugated linkers throughout the COF scaffold, the material can be engineered to be fully conjugated, enabling high charge carrier density as well as through- and in-plane charge transport.  For instance, Mirica and coworkers synthesized a COF material (NiPc-Pyr COF) from nickel phthalocyanine (NiPc) and pyrene organic linkers that had a conductivity of 2.51 x 10⁻³ S/m, which was several orders of magnitude larger than the undoped molecular NiPc, 10−11 S/m. A similar COF structure made by Jiang and coworkers, CoPc-Pyr COF, exhibited a conductivity of 3.69 x 10⁻³ S/m. In both previously mentioned COFs, the 2D lattice allows for full π-conjugation in the x and y directions as well as π-conduction along the z axis due to the fully conjugated, aromatic scaffold and π-π stacking, respectively. Emergent electrical conductivity in COF structures is especially important for applications such as catalysis and energy storage where quick and efficient charge transport is required for optimal performance.

Characterization

There exists a wide range of characterization methods for COF materials. There are several COF single crystals synthesized to date. For these highly crystalline materials, X-ray diffraction (XRD) is a powerful tool capable of determining COF crystal structure. The majority of COF materials suffer from decreased crystallinity so powder X-ray diffraction (PXRD) is used. In conjunction with simulated powder packing models, PXRD can determine COF crystal structure.

In order to verify and analyze COF linkage formation, various techniques can be employed such as infrared (IR) spectroscopy, and nuclear magnetic resonance (NMR) spectroscopy. Precursor and COF IR spectra enables comparison between vibrational peaks to ascertain that certain key bonds present in the COF linkages appear and that peaks of precursor functional groups disappear. In addition, solid-state NMR enables probing of linkage formation as well and is well suited for large, insoluble materials like COFs. Gas adsorption-desorption studies quantify the porosity of the material via calculation of the Brunauer–Emmett–Teller (BET) surface area and pore diameter from gas adsorption isotherms. Electron imagine techniques such as scanning electron microscope (SEM), and transmission electron microscopy (TEM) can resolve surface structure and morphology, and microstructural information, respectively. Scanning tunneling microscope (STM) and atomic force microscopy (AFM) have also been used to characterize COF microstructural information as well. Additionally, methods like X-ray photoelectron spectroscopy (XPS), inductively coupled plasma mass spectrometry (ICP-MS), and combustion analysis can be used to identify elemental composition and ratios.

Applications

Gas Storage and Separation

Due to the exceptional porosity of COFs, they have been used extensively in the storage and separation of gases such as hydrogen, methane, etc.

Hydrogen Storage

Omar M. Yaghi and William A. Goddard III reported COFs as exceptional hydrogen storage materials. They predicted the highest excess H2 uptakes at 77 K are 10.0 wt % at 80 bar for COF-105, and 10.0 wt % at 100 bar for COF-108, which have higher surface area and free volume, by grand canonical Monte Carlo (GCMC) simulations as a function of temperature and pressure. This is the highest value reported for associative H2 storage of any material. Thus 3-D COFs are most promising new candidates in the quest for practical H2 storage materials. In 2012, the lab of William A. Goddard III reported the uptake for COF102, COF103, and COF202 at 298 K and they also proposed new strategies to obtain higher interaction with H2. Such strategy consist on metalating the COF with alkaline metals such as Li. These complexes composed of Li, Na and K with benzene ligands (such as 1,3,5-benzenetribenzoate, the ligand used in MOF-177) have been synthesized by Krieck et al. and Goddard showed that the THF is important of their stability. If the metalation with alkaline is performed in the COFs, Goddard et al. calculated that some COFs can reach 2010 DOE gravimetric target in delivery units at 298 K of 4.5 wt %: COF102-Li (5.16 wt %), COF103-Li (4.75 wt %), COF102-Na (4.75 wt %) and COF103-Na (4.72 wt %). COFs also perform better in delivery units than MOFs because the best volumetric performance is for COF102-Na (24.9), COF102-Li (23.8), COF103-Na (22.8), and COF103-Li (21.7), all using delivery g H2/L units for 1–100 bar. These are the highest gravimetric molecular hydrogen uptakes for a porous material under these thermodynamic conditions.

Methane Storage

Omar M. Yaghi and William A. Goddard III also reported COFs as exceptional methane storage materials. The best COF in terms of total volume of CH4 per unit volume COF absorbent is COF-1, which can store 195 v/v at 298 K and 30 bar, exceeding the U.S. Department of Energy target for CH4 storage of 180 v/v at 298 K and 35 bar. The best COFs on a delivery amount basis (volume adsorbed from 5 to 100 bar) are COF-102 and COF-103 with values of 230 and 234 v(STP: 298 K, 1.01 bar)/v, respectively, making these promising materials for practical methane storage. More recently, new COFs with better delivery amount have been designed in the lab of William A. Goddard III, and they have been shown to be stable and overcome the DOE target in delivery basis. COF-103-Eth-trans and COF-102-Ant, are found to exceed the DOE target of 180 v(STP)/v at 35 bar for methane storage. They reported that using thin vinyl bridging groups aid performance by minimizing the interaction methane-COF at low pressure.

Gas Separation

In addition to storage, COF materials are exceptional at gas separation. For instance, COFs like imine-linked COF LZU1 and azine-linked COF ACOF-1 were used as a bilayer membrane for the selective separation of the following mixtures: H2/CO2, H2/N2, and H2/CH4. The COFs outperformed molecular sieves due to the inherent thermal and operational stability of the structures. It has also been shown that COFs inherently act as adsorbents, adhering to the gaseous molecules to enable storage and separation.

Optical properties

A highly ordered π-conjugation TP-COF, consisting of pyrene and triphenylene functionalities alternately linked in a mesoporous hexagonal skeleton, is highly luminescent, harvests a wide wavelength range of photons, and allows energy transfer and migration. Furthermore, TP-COF is electrically conductive and capable of repetitive on–off current switching at room temperature.

Porosity/surface-area effects

Most studies to date have focused on the development of synthetic methodologies with the aim of maximizing pore size and surface area for gas storage. That means the functions of COFs have not yet been well explored, but COFs can be used as catalysts, or for gas separation, etc.

Carbon capture

In 2015 the use of highly porous, catalyst-decorated COFs for converting carbon dioxide into carbon monoxide was reported. MOF under solvent-free conditions can also be used for catalytic activity in the cycloaddition of CO2 and epoxides into cyclic organic carbonates with enhanced catalyst recyclability.

Sensing

Due to defining molecule-framework interactions, COFs can be used as chemical sensors in a wide range of environments and applications. Properties of the COF change when their functionalities interact with various analytes enabling the materials to serve as devices in various conditions: as chemiresistive sensors, as well as electrochemical sensors for small molecules.

Catalysis

Due to the ability to introduce diverse functionality into COFs’ structure, catalytic sites can be fine-tuned in conjunction with other advantageous properties like conductivity and stability to afford efficient and selective catalysts. COFs have been used as heterogeneous catalysts in organic, electrochemical, as well as photochemical reactions.

Electrocatalysis

COFs have been studied as non-metallic electrocatalyst for energy-related catalysis, including carbon dioxide electro-reduction and water splitting reaction. However, such researches are still in the very earlier stage. Most of the efforts have been focusing on solving the key issues, such as conductivity, stability in electrochemical processes.

Energy Storage

A few COFs possess the stability and conductivity necessary to perform well in energy storage applications like lithium-ion batteries, and various different metal-ion batteries and cathodes.

Water filtration

A prototype 2 nanometer thick COF layer on a graphene substrate was used to filter dye from industrial wastewater. Once full, the COF can be cleaned and reused.

Entropy (information theory)

From Wikipedia, the free encyclopedia https://en.wikipedia.org/wiki/Entropy_(information_theory) In info...