Poster used to promote Ordinance 301. In May 2019, Denver became the first U.S. city to decriminalize psilocybin.
The movement to decriminalizepsilocybin in the United States began in the late 2010s, with Denver, Colorado, becoming the first city to decriminalize psilocybin in May 2019. The cities of Oakland and Santa Cruz, California,
followed suit and decriminalized psilocybin in June 2019 and January
2020, respectively. Supporters of the movement have cited emerging
research that indicate potential medical use for the drug. The use,
sale, and possession of psilocybin in the United States, despite state
laws, is illegal under federal law.
In May 2018, President Donald Trump signed the Right to Try Act, with certain doctors suggesting that it allows terminally-ill patients to use psychedelics for treatment. In October 2018, the Food and Drug Administration granted psilocybin "breakthrough therapy" status for research. The drug was granted this status again in November 2019.
Decriminalization advocates have cited research that suggests that the
drug is non-addictive and causes a low amount of emergency visits when
compared to other illegal drugs. Other research has indicated the potential beneficial use of psilocybin in treating treatment-resistant depression and nicotine dependence. Advocates have also claimed that decriminalization would lift law enforcement resources to focus on high-priority issues.
American author Michael Pollan, writing for The New York Times,
criticized the movement for being a premature push while research on
psilocybin was not done. He wrote, "We still have a lot to learn about
the immense power and potential risk of these molecules, not to mention
the consequences of unrestricted use." Pollan acknowledged the low-risks
of the drug's use, but cited a survey that nearly eight percent of
people needed psychiatric treatment after experiencing a bad trip.
Decriminalization
Legality of psilocybin in the United States
Decriminalized cities
States with decriminalized cities
Prohibited for any use
As of May 2020, three cities have decriminalized psilocybin. In May
2020, Ordinance 301 narrowly passed in Denver with 50.6% voting in
favor. The following month, thirty individuals testified to the city council in Oakland, California,
about their prior experiences with psilocybin. Following the
testimonies, the city council unanimously voted to decriminalize the
drug, along with peyote. In January 2020, Santa Cruz, California, voted unanimously to decriminalize the adult possession and cultivation of psilocybin. Commercial sale of psilocybin is still illegal.
Ongoing efforts
A 2018 effort to decriminalize psilocybin in California failed to garner enough signatures. In February 2019, Iowa
state lawmaker Jeff Shipley introduced two bills that would legalize
medical psilocybin and remove the drug from the state's list of
controlled substances. In June 2019, Representative Alexandria Ocasio-Cortez proposed legislation that would remove restrictions placed on researching the medical use of psilocybin. By November 2019, nearly 100 U.S. cities were reportedly considering measures to decriminalize psilocybin.
In January 2020, a Vermont state lawmaker, along with three other co-sponsors, introduced a bill to decriminalize psilocybin, peyote, ayahuasca, and kratom. In February 2020, the Board of Elections in Washington, D.C., decided to allow a vote on decriminalization in November of that year if organizers could collect enough signatures in time.
On May 26, 2020, an initiative in Oregon to legalize medical psilocybin
qualified to appear on the ballot in November. Another initiative in
Oregon would decriminalize drug possession and expand treatment
services. In May 2020, New York Assemblywoman Linda Rosenthal introduced a decriminalization bill, citing ongoing medical research and successful efforts in Denver, Oakland, and Santa Cruz.
Public opinion
In January 2019, the Oregon Psilocybin Society
and research firm DHM Research found that 47 percent of Oregon voters
approved the legalization of medical psilocybin, while 46 percent
opposed. The percentage of voters in favor increased to 64 percent after
key elements of the ballot were clarified to the poll's participants.
An October 2019 online poll conducted by research firm Green Horizons
found that 38 percent of U.S. adults supported legalizing psilocybin
"under at least some circumstances."
Global oceanic and terrestrial photoautotroph abundance, from September 1997 to August 2000. As an estimate of autotroph biomass, it is only a rough indicator of primary-production potential, and not an actual estimate of it. Provided by the SeaWiFS Project, NASA/Goddard Space Flight Center and ORBIMAGE.
In ecology, primary production is the synthesis of organic compounds from atmospheric or aqueous carbon dioxide. It principally occurs through the process of photosynthesis, which uses light as its source of energy, but it also occurs through chemosynthesis, which uses the oxidation or reduction of inorganic chemical compounds as its source of energy. Almost all life on Earth relies directly or indirectly on primary production. The organisms responsible for primary production are known as primary producers or autotrophs, and form the base of the food chain. In terrestrial ecoregions, these are mainly plants, while in aquatic ecoregionsalgae predominate in this role. Ecologists distinguish primary production as either net or gross, the former accounting for losses to processes such as cellular respiration, the latter not.
Primary production is the production of chemical energy in organic compounds by living organisms. The main source of this energy is sunlight but a minute fraction of primary production is driven by lithotrophic organisms using the chemical energy of inorganic molecules.
Regardless of its source, this energy is used to synthesize complex organic molecules from simpler inorganic compounds such as carbon dioxide (CO2) and water (H2O). The following two equations are simplified representations of photosynthesis (top) and (one form of) chemosynthesis (bottom):
CO2 + H2O + light → CH2O + O2
CO2 + O2 + 4 H2S → CH2O + 4 S + 3 H2O
In both cases, the end point is a polymer of reducedcarbohydrate, (CH2O)n, typically molecules such as glucose or other sugars. These relatively simple molecules may be then used to further synthesise more complicated molecules, including proteins, complex carbohydrates, lipids, and nucleic acids, or be respired to perform work. Consumption of primary producers by heterotrophic organisms, such as animals, then transfers these organic molecules (and the energy stored within them) up the food web, fueling all of the Earth's living systems.
Gross primary production and net primary production
Gross primary production (GPP) is the amount of chemical energy, typically expressed as carbon biomass, that primary producers create in a given length of time. Some fraction of this fixed energy is used by primary producers for cellular respiration and maintenance of existing tissues (i.e., "growth respiration" and "maintenance respiration"). The remaining fixed energy (i.e., mass of photosynthate) is referred to as net primary production (NPP).
NPP = GPP - respiration [by plants]
Net primary production is the rate at which all the autotrophs in an ecosystem
produce net useful chemical energy. As noted, it is equal to the
difference between the rate at which the plants in an ecosystem produce
useful chemical energy (GPP) and the rate at which they use some of that
energy during respiration. Net primary production is available to be
directed toward growth and reproduction of primary producers. As such it
is available for consumption by herbivores.
Both gross and net primary production are typically expressed in
units of mass per unit area per unit time interval. In terrestrial
ecosystems, mass of carbon per unit area per year (g C m−2 yr−1)
is most often used as the unit of measurement. Note that a distinction
is sometimes drawn between "production" and "productivity", with the
former the quantity of material produced (g C m−2), the latter the rate at which it is produced (g C m−2 yr−1), but these terms are more typically used interchangeably.
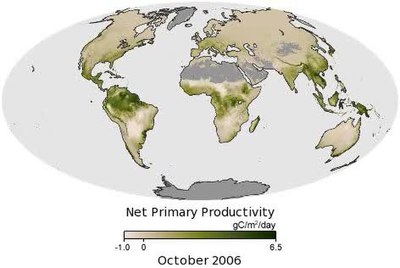
This
animation shows Earth's monthly terrestrial net primary productivity
from 2000 to 2013. Values range from near 0 grams of carbon per square
meter per day (tan) to 6.5 grams per square meter per day (dark green). A
negative value means decomposition or respiration overpowered carbon
absorption; more carbon was released to the atmosphere than the plants
took in. In mid-latitudes, productivity obviously interacts with
seasonal change, with productivity peaking in each hemisphere’s summer.
The data come from the Moderate Resolution Imaging Spectroradiometer
(MODIS) on NASA’s Terra satellite.
On the land, almost all primary production is now performed by vascular plants, with a small fraction coming from algae and non-vascular plants such as mosses and liverworts. Before the evolution of vascular plants, non-vascular plants likely played a more significant role. Primary production on land is a function of many factors, but principally local hydrology and temperature
(the latter covaries to an extent with light, specifically
photosynthetically active radiation (PAR), the source of energy for
photosynthesis). While plants cover much of the Earth's surface, they
are strongly curtailed wherever temperatures are too extreme or where
necessary plant resources (principally water and PAR) are limiting, such
as deserts or polar regions.
Water is "consumed" in plants by the processes of photosynthesis (see above) and transpiration. The latter process (which is responsible for about 90% of water use) is driven by the evaporation of water from the leaves of plants. Transpiration allows plants to transport water and mineralnutrients from the soil
to growth regions, and also cools the plant. Diffusion of water vapour
out of a leaf, the force that drives transpiration, is regulated by
structures known as stomata.
These structure also regulate the diffusion of carbon dioxide from the
atmosphere into the leaf, such that decreasing water loss (by partially
closing stomata) also decreases carbon dioxide gain. Certain plants use
alternative forms of photosynthesis, called Crassulacean acid metabolism (CAM) and C4. These employ physiological and anatomical
adaptations to increase water-use efficiency and allow increased
primary production to take place under conditions that would normally
limit carbon fixation by C3 plants (the majority of plant species).
As shown in the animation, the boreal forests of Canada and
Russia experience high productivity in June and July and then a slow
decline through fall and winter. Year-round, tropical forests in South
America, Africa, Southeast Asia, and Indonesia have high productivity,
not surprising with the abundant sunlight, warmth, and rainfall.
However, even in the tropics, there are variations in productivity over
the course of the year. For example, the Amazon basin exhibits
especially high productivity from roughly August through October - the
period of the area's dry season. Because the trees have access to a
plentiful supply of ground water that builds up in the rainy season,
they grow better when the rainy skies clear and allow more sunlight to
reach the forest.
In a reversal of the pattern on land, in the oceans, almost all
photosynthesis is performed by algae, with a small fraction contributed
by vascular plants and other groups. Algae encompass a diverse range of organisms, ranging from single floating cells to attached seaweeds. They include photoautotrophs from a variety of groups. Eubacteria are important photosynthetizers in both oceanic and terrestrial ecosystems, and while some archaea are phototrophic, none are known to utilise oxygen-evolving photosynthesis. A number of eukaryotes are significant contributors to primary production in the ocean, including green algae, brown algae and red algae, and a diverse group of unicellular groups. Vascular plants are also represented in the ocean by groups such as the seagrasses.
Unlike terrestrial ecosystems, the majority of primary production in the ocean is performed by free-living microscopic organisms called phytoplankton. Larger autotrophs, such as the seagrasses and macroalgae (seaweeds) are generally confined to the littoral zone and adjacent shallow waters, where they can attach to the underlying substrate but still be within the photic zone. There are exceptions, such as Sargassum, but the vast majority of free-floating production takes place within microscopic organisms.
Differences in relative photosynthesis between plankton species under different irradiance
The factors limiting primary production in the ocean are also very
different from those on land. The availability of water, obviously, is
not an issue (though its salinity can be). Similarly, temperature, while affecting metabolic rates (see Q10), ranges less widely in the ocean than on land because the heat capacity of seawater buffers temperature changes, and the formation of sea iceinsulates it at lower temperatures. However, the availability of light, the source of energy for photosynthesis, and mineral nutrients, the building blocks for new growth, play crucial roles in regulating primary production in the ocean.
Available Earth System Models suggest that ongoing ocean
bio-geochemical changes could trigger reductions in ocean NPP between 3%
and 10% of current values depending on the emissions scenario.
The sunlit zone of the ocean is called the photic zone
(or euphotic zone). This is a relatively thin layer (10–100 m) near
the ocean's surface where there is sufficient light for photosynthesis
to occur. For practical purposes, the thickness of the photic zone is
typically defined by the depth at which light reaches 1% of its surface
value. Light is attenuated down the water column by its absorption or scattering by the water itself, and by dissolved or particulate material within it (including phytoplankton).
Net photosynthesis in the water column is determined by the interaction between the photic zone and the mixed layer. Turbulent mixing by wind energy at the ocean's surface homogenises the water column vertically until the turbulence dissipates
(creating the aforementioned mixed layer). The deeper the mixed layer,
the lower the average amount of light intercepted by phytoplankton
within it. The mixed layer can vary from being shallower than the
photic zone, to being much deeper than the photic zone. When it is much
deeper than the photic zone, this results in phytoplankton spending too
much time in the dark for net growth to occur. The maximum depth of
the mixed layer in which net growth can occur is called the critical depth.
As long as there are adequate nutrients available, net primary
production occurs whenever the mixed layer is shallower than the
critical depth.
Both the magnitude of wind mixing and the availability of light
at the ocean's surface are affected across a range of space- and
time-scales. The most characteristic of these is the seasonal cycle (caused by the consequences of the Earth's axial tilt), although wind magnitudes additionally have strong spatial components. Consequently, primary production in temperate regions such as the North Atlantic
is highly seasonal, varying with both incident light at the water's
surface (reduced in winter) and the degree of mixing (increased in
winter). In tropical regions, such as the gyres in the middle of the major basins, light may only vary slightly across the year, and mixing may only occur episodically, such as during large storms or hurricanes.
Mixing also plays an important role in the limitation of primary production by nutrients. Inorganic nutrients, such as nitrate, phosphate and silicic acid are necessary for phytoplankton to synthesise their cells and cellular machinery. Because of gravitational sinking of particulate material (such as plankton, dead or fecal material), nutrients are constantly lost from the photic zone, and are only replenished by mixing or upwelling
of deeper water. This is exacerbated where summertime solar heating
and reduced winds increases vertical stratification and leads to a
strong thermocline,
since this makes it more difficult for wind mixing to entrain deeper
water. Consequently, between mixing events, primary production (and the
resulting processes that leads to sinking particulate material)
constantly acts to consume nutrients in the mixed layer, and in many
regions this leads to nutrient exhaustion and decreased mixed layer
production in the summer (even in the presence of abundant light).
However, as long as the photic zone is deep enough, primary production
may continue below the mixed layer where light-limited growth rates mean
that nutrients are often more abundant.
Iron
Another factor relatively recently discovered to play a significant role in oceanic primary production is the micronutrientiron. This is used as a cofactor in enzymes involved in processes such as nitrate reduction and nitrogen fixation. A major source of iron to the oceans is dust from the Earth's deserts, picked up and delivered by the wind as aeolian dust.
In regions of the ocean that are distant from deserts or that are not reached by dust-carrying winds (for example, the Southern and North Pacific
oceans), the lack of iron can severely limit the amount of primary
production that can occur. These areas are sometimes known as HNLC
(High-Nutrient, Low-Chlorophyll) regions, because the scarcity of iron
both limits phytoplankton growth and leaves a surplus of other
nutrients. Some scientists have suggested introducing iron to these areas as a means of increasing primary productivity and sequestering carbon dioxide from the atmosphere.
Measurement
The
methods for measurement of primary production vary depending on whether
gross vs net production is the desired measure, and whether terrestrial
or aquatic systems are the focus. Gross production is almost always
harder to measure than net, because of respiration, which is a
continuous and ongoing process that consumes some of the products of
primary production (i.e. sugars) before they can be accurately measured.
Also, terrestrial ecosystems are generally more difficult because a
substantial proportion of total productivity is shunted to below-ground
organs and tissues, where it is logistically difficult to measure.
Shallow water aquatic systems can also face this problem.
Scale also greatly affects measurement techniques. The rate of
carbon assimilation in plant tissues, organs, whole plants, or plankton
samples can be quantified by biochemically based techniques,
but these techniques are decidedly inappropriate for large scale
terrestrial field situations. There, net primary production is almost
always the desired variable, and estimation techniques involve various
methods of estimating dry-weight biomass changes over time. Biomass
estimates are often converted to an energy measure, such as
kilocalories, by an empirically determined conversion factor.
Terrestrial
An oak tree; a typical modern, terrestrial autotroph
In terrestrial ecosystems, researchers generally measure net primary
production (NPP). Although its definition is straightforward, field
measurements used to estimate productivity vary according to
investigator and biome. Field estimates rarely account for below ground
productivity, herbivory, turnover, litterfall, volatile organic compounds, root exudates, and allocation to symbiotic microorganisms. Biomass based NPP estimates result in underestimation of NPP due to incomplete accounting of these components.
However, many field measurements correlate well to NPP. There are a
number of comprehensive reviews of the field methods used to estimate
NPP. Estimates of ecosystem respiration, the total carbon dioxide produced by the ecosystem, can also be made with gas flux measurements.
The major unaccounted pool is belowground productivity,
especially production and turnover of roots. Belowground components of
NPP are difficult to measure. BNPP (below-ground NPP) is often estimated
based on a ratio of ANPP:BNPP (above-ground NPP:below-ground NPP)
rather than direct measurements.
Gross primary production can be estimated from measurements of net ecosystem exchange (NEE) of carbon dioxide made by the eddy covariance technique.
During night, this technique measures all components of ecosystem
respiration. This respiration is scaled to day-time values and further
subtracted from NEE.
Most frequently, peak standing biomass is assumed to measure NPP. In
systems with persistent standing litter, live biomass is commonly
reported. Measures of peak biomass are more reliable if the system is
predominantly annuals. However, perennial measurements could be
reliable if there were a synchronous phenology driven by a strong
seasonal climate. These methods may underestimate ANPP in grasslands by
as much as 2 (temperate) to 4 (tropical) fold.
Repeated measures of standing live and dead biomass provide more
accurate estimates of all grasslands, particularly those with large
turnover, rapid decomposition, and interspecific variation in timing of
peak biomass. Wetland productivity (marshes and fens) is similarly measured. In Europe, annual mowing makes the annual biomass increment of wetlands evident.
Forests
Methods
used to measure forest productivity are more diverse than those of
grasslands. Biomass increment based on stand specific allometry plus litterfall is considered a suitable although incomplete accounting of above-ground net primary production (ANPP). Field measurements used as a proxy for ANPP include annual litterfall, diameter or basal area increment (DBH or BAI), and volume increment.
Aquatic
In aquatic systems, primary production is typically measured using one of six main techniques:
variations in oxygen concentration within a sealed bottle (developed by Gaarder and Gran in 1927)
The technique developed by Gaarder and Gran uses variations in the
concentration of oxygen under different experimental conditions to infer
gross primary production. Typically, three identical transparent
vessels are filled with sample water and stoppered.
The first is analysed immediately and used to determine the initial
oxygen concentration; usually this is done by performing a Winkler titration.
The other two vessels are incubated, one each in under light and
darkened. After a fixed period of time, the experiment ends, and the
oxygen concentration in both vessels is measured. As photosynthesis has
not taken place in the dark vessel, it provides a measure of ecosystem respiration.
The light vessel permits both photosynthesis and respiration, so
provides a measure of net photosynthesis (i.e. oxygen production via
photosynthesis subtract oxygen consumption by respiration). Gross
primary production is then obtained by adding oxygen consumption in the
dark vessel to net oxygen production in the light vessel.
The technique of using 14C incorporation (added as labelled Na2CO3)
to infer primary production is most commonly used today because it is
sensitive, and can be used in all ocean environments. As 14C is radioactive (via beta decay), it is relatively straightforward to measure its incorporation in organic material using devices such as scintillation counters.
Depending upon the incubation time chosen, net or gross primary
production can be estimated. Gross primary production is best estimated
using relatively short incubation times (1 hour or less), since the
loss of incorporated 14C (by respiration and organic material
excretion / exudation) will be more limited. Net primary production is
the fraction of gross production remaining after these loss processes
have consumed some of the fixed carbon.
Loss processes can range between 10-60% of incorporated 14C according to the incubation period, ambient environmental conditions (especially temperature) and the experimental species
used. Aside from those caused by the physiology of the experimental
subject itself, potential losses due to the activity of consumers also
need to be considered. This is particularly true in experiments making
use of natural assemblages of microscopic autotrophs, where it is not
possible to isolate them from their consumers.
The methods based on stable isotopes and O2/Ar ratios
have the advantage of providing estimates of respiration rates in the
light without the need of incubations in the dark. Among them, the
method of the triple oxygen isotopes and O2/Ar have the additional advantage of not needing incubations in closed containers and O2/Ar can even be measured continuously at sea using equilibrator inlet mass spectrometry (EIMS) or a membrane inlet mass spectrometry (MIMS).
However, if results relevant to the carbon cycle are desired, it is
probably better to rely on methods based on carbon (and not oxygen)
isotopes. It is important to notice that the method based on carbon
stable isotopes is not simply an adaptation of the classic 14C
method, but an entirely different approach that does not suffer from
the problem of lack of account of carbon recycling during
photosynthesis.
Global
As primary production in the biosphere is an important part of the carbon cycle, estimating it at the global scale is important in Earth system science. However, quantifying primary production at this scale is difficult because of the range of habitats on Earth, and because of the impact of weather events (availability of sunlight, water) on its variability. Using satellite-derived estimates of the Normalized Difference Vegetation Index (NDVI) for terrestrial habitats and sea-surface chlorophyll for the oceans, it is estimated that the total (photoautotrophic) primary production for the Earth was 104.9 petagrams of carbon per year (Pg C yr−1; equivalent to the non-SI Gt C yr−1). Of this, 56.4 Pg C yr−1 (53.8%), was the product of terrestrial organisms, while the remaining 48.5 Pg C yr−1, was accounted for by oceanic production.
Scaling ecosystem-level GPP estimations based on eddy covariance
measurements of net ecosystem exchange (see above) to regional and
global values using spatial details of different predictor variables,
such as climate variables and remotely sensed fAPAR or LAI led to a terrestrial gross primary production of 123±8 Gt carbon (NOT carbon dioxide) per year during 1998-2005.
In areal terms, it was estimated that land production was approximately 426 g C m−2 yr−1 (excluding areas with permanent ice cover), while that for the oceans was 140 g C m−2 yr−1.
Another significant difference between the land and the oceans lies in
their standing stocks - while accounting for almost half of total
production, oceanic autotrophs only account for about 0.2% of the total
biomass.
Estimates
Primary
productivity can be estimated by a variety of proxies. One that has
particular relevance to the geological record is Barium, whose
concentration in marine sediments rises in line with primary
productivity at the surface.
Human impact and appropriation
Human societies are part of the Earth's NPP cycle, but exert a disproportionate influence in it.
In 1996, Josep Garí designed a new indicator of sustainable development
based precisely on the estimation of the human appropriation of NPP: he
coined it "HANPP" (Human Appropriation of Net Primary Production) and
introduced it at the inaugural conference of the European Society for
Ecological Economics.
HANPP has since been further developed and widely applied in research
on ecological economics as well as in policy analysis for
sustainability. HANPP represents a proxy of the human impact on Nature
and can be applied to different geographical scales and also globally.
The extensive degree of human use of the Planet's resources, mostly via land use, results in various levels of impact on actual NPP (NPPact). Although in some regions, such as the Nile valley, irrigation has resulted in a considerable increase in primary production, in most of the Planet there is a notable trend of NPP reduction due to land changes (ΔNPPLC) of 9.6% across global land-mass. In addition to this, end consumption by people raises the total HANPP to 23.8% of potential vegetation (NPP0). It is estimated that, in 2000, 34% of the Earth's ice-free land area (12% cropland; 22% pasture) was devoted to human agriculture. This disproportionate amount reduces the energy available to other species, having a marked impact on biodiversity, flows of carbon, water and energy, and ecosystem services, and scientists have questioned how large this fraction can be before these services begin to break down.
Reductions in NPP are also expected in the ocean as a result of ongoing
climate change, potentially impacting marine ecosystems (~10% of global
biodiversity) and goods and services (1-5% of global total) that the
oceans provide.
The biological pump, in its simplest form, is the ocean's biologically driven sequestration of carbon from the atmosphere to the ocean interior and seafloor sediments. It is the part of the oceanic carbon cycle responsible for the cycling of organic matter formed mainly by phytoplankton during photosynthesis (soft-tissue pump), as well as the cycling of calcium carbonate (CaCO3) formed into shells by certain organisms such as plankton and mollusks (carbonate pump).
Once this carbon is fixed into soft or hard tissue, the organisms
either stay in the euphotic zone to be recycled as part of the
regenerative nutrient cycle
or once they die, continue to the second phase of the biological pump
and begin to sink to the ocean floor. The sinking particles will often
form aggregates as they sink, greatly increasing the sinking rate. It is
this aggregation that gives particles a better chance of escaping
predation and decomposition in the water column and eventually make it
to the sea floor.
The fixed carbon that is either decomposed by bacteria on the way
down or once on the sea floor then enters the final phase of the pump
and is remineralized to be used again in primary production.
The particles that escape these processes entirely are sequestered in
the sediment and may remain there for millions of years. It is this
sequestered carbon that is responsible for ultimately lowering
atmospheric CO2.
Primary production
The
first step in the biological pump is the synthesis of both organic and
inorganic carbon compounds by phytoplankton in the uppermost, sunlit
layers of the ocean. Organic compounds in the form of sugars, carbohydrates, lipids, and proteins are synthesized during the process of photosynthesis:
CO2 + H2O + light → CH2O + O2
In addition to carbon, organic matter found in phytoplankton is composed of nitrogen, phosphorus and various trace metals. The ratio of carbon to nitrogen and phosphorus varies little and has an average ratio of 106C:16N:1P, known as the Redfield ratio.
Trace metals such as magnesium, cadmium, iron, calcium, barium and
copper are orders of magnitude less prevalent in phytoplankton organic
material, but necessary for certain metabolic processes and therefore
can be limiting nutrients in photosynthesis due to their lower abundance
in the water column.
Oceanic primary production accounts for about half of the carbon
fixation carried out on Earth. Approximately 50–60 Pg of carbon are
fixed by marine phytoplankton each year despite the fact that they
comprise less than 1% of the total photosynthetic biomass on Earth. The
majority of this carbon fixation (~80%) is carried out in the open ocean
while the remaining amount occurs in the very productive upwelling
regions of the ocean. Despite these productive regions producing 2 to 3
times as much fixed carbon per area, the open ocean accounts for
greater than 90% of the ocean area and therefore is the larger
contributor.
Calcium carbonate
Carbon is also biologically fixed in the form of calcium carbonate (CaCO3)
used as a protective coating for many planktonic species
(coccolithophores, foraminifera) as well as larger marine organisms
(mollusk shells). While this form of carbon is not directly taken from
the atmospheric budget, it is formed from dissolved forms of carbonate
which are in equilibrium with CO2 and then responsible for removing this carbon via sequestration.
CO2 + H2O → H2CO3 → H+ + HCO3−
Ca2+ + 2HCO3− → CaCO3 + CO2 + H2O
While this process does manage to fix a large amount of carbon, two units of alkalinity are sequestered for every unit of sequestered carbon, thereby lowering the pH of surface water and raising atmospheric CO2. The formation and sinking of CaCO3 drives a surface to deep alkalinity gradient which serves to raise the partial pressure of dissolved CO2 in surface waters and actually raise atmospheric levels. In addition, the sequestration of CaCO3 serves to lower overall oceanic alkalinity and again raise atmospheric levels.
Marine snow
The
vast majority of carbon incorporated in organic and inorganic
biological matter is formed at the sea surface and then must sink to the
ocean floor. A single phytoplankton cell has a sinking rate around 1 m
per day and with 4000 m as the average depth of the ocean, it can take
over ten years for these cells to reach the ocean floor. However,
through processes such as coagulation and expulsion in predator fecal
pellets, these cells form aggregates. These aggregates, known as marine snow,
have sinking rates orders of magnitude greater than individual cells
and complete their journey to the deep in a matter of days.
White Cliffs of Dover
Of the 50–60 Pg of carbon fixed annually, roughly 10% leaves the
surface mixed layer of the oceans, while less than 0.5% of eventually
reaches the sea floor.
Most is retained in regenerated production in the euphotic zone and a
significant portion is remineralized in midwater processes during
particle sinking. The portion of carbon that leaves the surface mixed
layer of the ocean is sometimes considered "sequestered", and
essentially removed from contact with the atmosphere for many centuries. However, work also finds that, in regions such as the Southern Ocean, much of this carbon can quickly (within decades) come back into contact with the atmosphere.
The portion of carbon that makes it to the sea floor becomes part of
the geologic record and in the case of the calcium carbonate, may form
large deposits and resurface through tectonic motion as in the case with
the White Cliffs of Dover in Southern England. These cliffs are made almost entirely of the plates of buried coccolithophores.
Quantification
As
the biological pump plays an important role in the Earth's carbon
cycle, significant effort is spent quantifying its strength. However,
because they occur as a result of poorly constrained ecological
interactions usually at depth, the processes that form the biological
pump are difficult to measure. A common method is to estimate primary
production fuelled by nitrate and ammonium
as these nutrients have different sources that are related to the
remineralisation of sinking material. From these it is possible to
derive the so-called f-ratio,
a proxy for the local strength of the biological pump. Applying the
results of local studies to the global scale is complicated by the role
the ocean's circulation plays in different ocean regions.
The biological pump has a physico-chemical counterpart known as the solubility pump. For an overview of both pumps, see Raven & Falkowski (1999).
Anthropogenic changes
Estimated vertical inventory of "present day" (1990s) anthropogenic CO2
It was recently determined that coccolithophore concentrations in the North Atlantic have increased by an order of magnitude since the 1960s and an increase in absorbed CO2, as well as temperature, were modeled to be the most likely cause of this increase.
Changes in land use, the combustion of fossil fuels, and the production of cement have led to an increase in CO2 concentration in the atmosphere. At present, about one third (approximately 2 Pg C y−1 = 2 × 10¹⁵ grams of carbon per year) of anthropogenic emissions of CO2
are believed to be entering the ocean. However, the biological pump is
not believed to play a significant role in the net uptake of CO2
by oceans. This is because the biological pump is primarily limited by
the availability of light and nutrients, and not by carbon. This is in
contrast to the situation on land, where elevated atmospheric
concentrations of CO2 may increase primary production because land plants are able to improve their water-use efficiency (= decrease transpiration) when CO2 is easier to obtain.
However, there are still considerable uncertainties in the marine
carbon cycle, and some research suggests that a link between elevated CO2 and marine primary production exists.
However, climate change may affect the biological pump in the future by warming and stratifying
the surface ocean. It is believed that this could decrease the supply
of nutrients to the euphotic zone, reducing primary production there.
Also, changes in the ecological success of calcifying organisms caused
by ocean acidification may affect the biological pump by altering the strength of the hard tissues pump.
This may then have a "knock-on" effect on the soft tissues pump because
calcium carbonate acts to ballast sinking organic material.
In 2019, a study indicated that at current rates of seawater
acidification, we could see Antarctic phytoplanktons smaller and less
effective at storing carbon before the end of the century.
A carbon credit is a generic term for any tradable certificate or permit representing the right to emit one tonne of carbon dioxide or the equivalent amount of a different greenhouse gas (tCO2e).
Carbon credits and carbon markets are a component of national and
international attempts to mitigate the growth in concentrations of greenhouse gases
(GHGs). One carbon credit is equal to one tonne of carbon dioxide, or
in some markets, carbon dioxide equivalent gases. Carbon trading is an
application of an emissions trading approach. Greenhouse gas emissions are capped and then markets are used to allocate the emissions among the group of regulated sources.
The goal is to allow market mechanisms to drive industrial and
commercial processes in the direction of low emissions or less carbon
intensive approaches than those used when there is no cost to emitting carbon dioxide and other GHGs into the atmosphere. Since GHG mitigation projects generate credits, this approach can be used to finance carbon reduction schemes between trading partners and around the world.
There are also many companies that sell carbon credits to
commercial and individual customers who are interested in lowering their
carbon footprint on a voluntary basis. These carbon offsetters
purchase the credits from an investment fund or a carbon development
company that has aggregated the credits from individual projects.
Buyers and sellers can also use an exchange platform to trade, which is
like a stock exchange for carbon credits. The quality of the credits is
based in part on the validation process and sophistication of the fund
or development company that acted as the sponsor to the carbon project.
This is reflected in their price; voluntary units typically have less
value than the units sold through the rigorously validated Clean Development Mechanism. The European Union's carbon credits traded from $7.78 to $25.19 averaging $16.21 per tonne in 2018.
Definitions
The Collins English Dictionary defines a carbon credit as “a
certificate showing that a government or company has paid to have a
certain amount of carbon dioxide removed from the environment”.
The Environment Protection Authority of Victoria defines a carbon credit as a “generic
term to assign a value to a reduction or offset of greenhouse gas
emissions.. usually equivalent to one tonne of carbon dioxide equivalent
(CO2-e).”
The Investopedia Inc investment dictionary defines a carbon credit as a “permit that allows the holder to emit one ton of carbon dioxide”..which “can be traded in the international market at their current market price”.
Types
There are two main markets for carbon credits;
Compliance Market credits
Secondary / Verified Market credits (VERs)
Background
The burning of fossil fuels is a major source of greenhouse gas emissions,
especially for power, cement, steel, textile, fertilizer and many other
industries which rely on fossil fuels (coal, electricity derived from
coal, natural gas and oil). The major greenhouse gases emitted by these
industries are carbon dioxide, methane, nitrous oxide, hydrofluorocarbons (HFCs), etc., all of which increase the atmosphere's ability to trap infrared energy and thus affect the climate.
The concept of carbon credits came into existence as a result of
increasing awareness of the need for controlling emissions. The IPCC (Intergovernmental Panel on Climate Change) has observed[9]
that:
Policies that provide a real or implicit price of
carbon could create incentives for producers and consumers to
significantly invest in low-GHG products, technologies and processes.
Such policies could include economic instruments, government funding and
regulation,
while noting that a tradable permit system is one of the policy
instruments that has been shown to be environmentally effective in the
industrial sector, as long as there are reasonable levels of
predictability over the initial allocation mechanism and long-term
price.
The mechanism was formalized in the Kyoto Protocol, an international agreement between more than 170 countries, and the market mechanisms were agreed through the subsequent Marrakesh Accords.
The mechanism adopted was similar to the successful US Acid Rain Program to reduce some industrial pollutants.
Emission allowances
Under the Kyoto Protocol, the 'caps' or quotas for Greenhouse gases for the developed Annex 1 countries are known as Assigned Amounts and are listed in Annex B.[10] The quantity of the initial assigned amount is denominated in individual units, called Assigned amount units
(AAUs), each of which represents an allowance to emit one metric tonne
of carbon dioxide equivalent, and these are entered into the country's
national registry.[11]
In turn, these countries set quotas on the emissions of
installations run by local business and other organizations, generically
termed 'operators'. Countries manage this through their national
registries, which are required to be validated and monitored for
compliance by the UNFCCC.[12] Each operator has an allowance of credits, where each unit gives the owner the right to emit one metric tonne of carbon dioxide or other equivalent greenhouse gas.
Operators that have not used up their quotas can sell their unused
allowances as carbon credits, while businesses that are about to exceed
their quotas can buy the extra allowances as credits, privately or on
the open market.
As demand for energy grows over time, the total emissions must still
stay within the cap, but it allows industry some flexibility and
predictability in its planning to accommodate this.
By permitting allowances to be bought and sold, an operator can
seek out the most cost-effective way of reducing its emissions, either
by investing in 'cleaner' machinery and practices or by purchasing
emissions from another operator who already has excess 'capacity'.
A tradable credit can be an emissions allowance or an assigned amount unit
which was originally allocated or auctioned by the national
administrators of a Kyoto-compliant cap-and-trade scheme, or it can be
an offset
of emissions. Such offsetting and mitigating activities can occur in
any developing country which has ratified the Kyoto Protocol, and has a
national agreement in place to validate its carbon project through one of the UNFCCC's approved mechanisms. Once approved, these units are termed Certified Emission Reductions, or CERs. The Protocol allows these projects to be constructed and credited in advance of the Kyoto trading period.
The Kyoto Protocol provides for three mechanisms that enable
countries or operators in developed countries to acquire greenhouse gas
reduction credits[15]
Under Joint Implementation
(JI) a developed country with relatively high costs of domestic
greenhouse reduction would set up a project in another developed
country.
Under the Clean Development Mechanism
(CDM) a developed country can 'sponsor' a greenhouse gas reduction
project in a developing country where the cost of greenhouse gas
reduction project activities is usually much lower, but the atmospheric
effect is globally equivalent. The developed country would be given
credits for meeting its emission reduction targets, while the developing
country would receive the capital investment and clean technology or beneficial change in land use.
Under International Emissions Trading (IET) countries can trade in the international carbon credit market to cover their shortfall in Assigned amount units.
Countries with surplus units can sell them to countries that are
exceeding their emission targets under Annex B of the Kyoto Protocol.
These carbon projects
can be created by a national government or by an operator within the
country.
In reality, most of the transactions are not performed by national
governments directly, but by operators who have been set quotas by their
country.
Emission markets
For trading purposes, one allowance or CER is considered equivalent to one metric ton of CO2
emissions. These allowances can be sold privately or in the
international market at the prevailing market price. These trade and settle
internationally and hence allow allowances to be transferred between
countries. Each international transfer is validated by the UNFCCC. Each transfer of ownership within the European Union is additionally validated by the European Commission.
Climate exchanges have been established to provide a spot market in allowances, as well as futures and optionsmarket to help discover a market price and maintain liquidity. Carbon prices are normally quoted in Euros per tonne of carbon dioxide or its equivalent (CO2e). Other greenhouse gasses can also be traded, but are quoted as standard multiples of carbon dioxide with respect to their global warming potential.
These features reduce the quota's financial impact on business, while
ensuring that the quotas are met at a national and international level.
Currently there are five exchanges trading in carbon allowances: the European Climate Exchange, NASDAQ OMX Commodities Europe, PowerNext, Commodity Exchange Bratislava and the European Energy Exchange. NASDAQ OMX Commodities Europe listed a contract to trade offsets generated by a CDM carbon project
called Certified Emission Reductions (CERs). Many companies now engage
in emissions abatement, offsetting, and sequestration programs to
generate credits that can be sold on one of the exchanges. At least one private electronic market has been established in 2008: CantorCO2e.[16] Carbon credits at Commodity Exchange Bratislava are traded at special platform - Carbon place.[17]
Managing emissions is one of the fastest-growing segments in financial services in the City of London with a market estimated to be worth about €30 billion in 2007. Louis Redshaw, head of environmental markets at Barclays Capital predicts that "Carbon will be the world's biggest commodity market, and it could become the world's biggest market overall."[18]
Setting a market price for carbon
Unchecked,
energy use and hence emission levels are predicted to keep rising over
time. Thus the number of companies needing to buy credits will increase,
and the rules of supply and demand will push up the market price, encouraging more groups to undertake environmentally friendly activities that create carbon credits to sell.
An individual allowance, such as an Assigned amount unit
(AAU) or its near-equivalent European Union Allowance (EUA), may have a
different market value to an offset such as a CER. This is due to the
lack of a developed secondary market for CERs, a lack of homogeneity
between projects which causes difficulty in pricing, as well as
questions due to the principle of supplementarity and its lifetime. Additionally, offsets generated by a carbon project
under the Clean Development Mechanism are potentially limited in value
because operators in the EU ETS are restricted as to what percentage of
their allowance can be met through these flexible mechanisms.
Yale University economics professor William Nordhaus
argues that the price of carbon needs to be high enough to motivate the
changes in behavior and changes in economic production systems
necessary to effectively limit emissions of greenhouse gases.
Raising the price of carbon will achieve four goals. First, it will
provide signals to consumers about what goods and services are
high-carbon ones and should therefore be used more sparingly. Second, it
will provide signals to producers about which inputs use more carbon
(such as coal and oil) and which use less or none (such as natural gas
or nuclear power), thereby inducing firms to substitute low-carbon
inputs. Third, it will give market incentives for inventors and
innovators to develop and introduce low-carbon products and processes
that can replace the current generation of technologies. Fourth, and
most important, a high carbon price will economize on the information
that is required to do all three of these tasks. Through the market
mechanism, a high carbon price will raise the price of products
according to their carbon content. Ethical consumers today, hoping to
minimize their “carbon footprint,” have little chance of making an
accurate calculation of the relative carbon use in, say, driving 250
miles as compared with flying 250 miles. A harmonized carbon tax would
raise the price of a good proportionately to exactly the amount of CO2
that is emitted in all the stages of production that are involved in
producing that good. If 0.01 of a ton of carbon emissions results from
the wheat growing and the milling and the trucking and the baking of a
loaf of bread, then a tax of $30 per ton carbon will raise the price of
bread by $0.30. The “carbon footprint” is automatically calculated by
the price system. Consumers would still not know how much of the price
is due to carbon emissions, but they could make their decisions
confident that they are paying for the social cost of their carbon
footprint.[19]
Nordhaus has suggested, based on the social cost of carbon emissions,
that an optimal price of carbon is around $30(US) per ton and will need
to increase with inflation.
The social cost of carbon is the additional damage caused by an
additional ton of carbon emissions. ... The optimal carbon price, or
optimal carbon tax, is the market price (or carbon tax) on carbon
emissions that balances the incremental costs of reducing carbon
emissions with the incremental benefits of reducing climate damages. ...
[I]f a country wished to impose a carbon tax of $30 per ton of carbon,
this would involve a tax on gasoline of about 9 cents per gallon.
Similarly, the tax on coal-generated electricity would be about 1 cent
per kWh, or 10 percent of the current retail price. At current levels of
carbon emissions in the United States, a tax of $30 per ton of carbon
would generate $50 billion of revenue per year.[20]
How buying carbon credits propose to reduce emissions
Carbon credits create a market for reducing greenhouse emissions by
giving a monetary value to the cost of polluting the air. Emissions
become an internal cost of doing business and are visible on the balance sheet alongside raw materials and other liabilities or assets.
For example, consider a business that owns a factory putting out
100,000 tonnes of greenhouse gas emissions in a year. Its government is
an Annex I country that enacts a law to limit the emissions that the
business can produce. So the factory is given a quota of say 80,000
tonnes per year. The factory either reduces its emissions to 80,000
tonnes or is required to purchase carbon credits to offset the excess.
After costing up alternatives the business may decide that it is
uneconomical or infeasible to invest in new machinery for that year.
Instead it may choose to buy carbon credits on the open market from
organizations that have been approved as being able to sell legitimate
carbon credits.
We should consider the impact of manufacturing alternative energy
sources. For example, the energy consumed and the carbon emitted in the
manufacture and transportation of a large wind turbine would prohibit a
credit being issued for a predetermined period of time.
One seller might be a company that will offer to offset emissions
through a project in the developing world, such as recovering methane
from a swine farm to feed a power station that previously would use
fossil fuel. So although the factory continues to emit gases, it would
pay another group to reduce the equivalent of 20,000 tonnes of carbon
dioxide emissions from the atmosphere for that year.
Another seller may have already invested in new low-emission
machinery and have a surplus of allowances as a result. The factory
could make up for its emissions by buying 20,000 tonnes of allowances
from them. The cost of the seller's new machinery would be subsidized by
the sale of allowances. Both the buyer and the seller would submit
accounts for their emissions to prove that their allowances were met
correctly.
Credits versus taxes
Carbon
credits and carbon taxes each have their advantages and disadvantages.
Credits were chosen by the signatories to the Kyoto Protocol as an
alternative to carbon taxes. A criticism of tax-raising schemes is that they are frequently not hypothecated,
and so some or all of the taxation raised by a government would be
applied based on what the particular nation's government deems most
fitting. However, some would argue that carbon trading is based around
creating a lucrative artificial market, and, handled by free market
enterprises as it is, carbon trading is not necessarily a focused or
easily regulated solution.
By treating emissions as a market commodity
some proponents insist it becomes easier for businesses to understand
and manage their activities, while economists and traders can attempt to
predict future pricing using market theories. Thus the main advantages
of a tradeable carbon credit over a carbon tax are argued to be:
the price may be more likely to be perceived as fair by those
paying it. Investors in credits may have more control over their own
costs.
the flexible mechanisms of the Kyoto Protocol help to ensure that
all investment goes into genuine sustainable carbon reduction schemes
through an internationally agreed validation process.
some proponents state that if correctly implemented a target level
of emission reductions may somehow be achieved with more certainty,
while under a tax the actual emissions might vary over time.
it may provide a framework for rewarding people or companies who
plant trees or otherwise meet standards exclusively recognized as
"green."
The advantages of a carbon tax are argued to be:
possibly less complex, expensive, and time-consuming to
implement. This advantage is especially great when applied to markets
like gasoline or home heating oil.
perhaps some reduced risk of certain types of cheating, though under both credits and taxes, emissions must be verified.
reduced incentives for companies to delay efficiency improvements
prior to the establishment of the baseline if credits are distributed in
proportion to past emissions.
when credits are grandfathered, this puts new or growing companies at a disadvantage relative to more established companies.
allows for more centralized handling of acquired gains
worth of carbon is stabilized by government regulation rather than
market fluctuations. Poor market conditions and weak investor interest
have a lessened impact on taxation as opposed to carbon trading.
Creating carbon credits
The principle of Supplementarity
within the Kyoto Protocol means that internal abatement of emissions
should take precedence before a country buys in carbon credits. However
it also established the Clean Development Mechanism
as a Flexible Mechanism by which capped entities could develop
measurable and permanent emissions reductions voluntarily in sectors
outside the cap. Many criticisms of carbon credits stem from the fact
that establishing that an emission of CO2-equivalent greenhouse gas has truly been reduced involves a complex process. This process has evolved as the concept of a carbon project has been refined over the past 10 years.
The first step in determining whether or not a carbon project
has legitimately led to the reduction of measurable and permanent
emissions is understanding the CDM methodology process. This is the
process by which project sponsors submit, through a Designated
Operational Entity (DOE), their concepts for emissions reduction
creation. The CDM Executive Board, with the CDM Methodology Panel and
their expert advisors, review each project and decide how and if they do
indeed result in reductions that are additional[21]
It is also important for any carbon credit (offset) to prove a concept called additionality. The concept of additionality
addresses the question of whether the project would have happened in
the absence of an intervention in the form of the price signal of carbon
credits. Only projects with emissions below their baseline level,
defined as emissions under a scenario without this price signal (holding
all other factors constant), represent a net environmental benefit.
Carbon projects that yield strong financial returns even in the absence
of revenue from carbon credits; or that are compelled by regulations; or
that represent common practice in an industry; are usually not
considered additional. A full determination of additionality requires a
careful investigation of proposed carbon offset projects.[22]
It is generally agreed that voluntary carbon offset projects must demonstrate additionality to ensure the legitimacy of the environmental stewardship claims resulting from the retirement of carbon credits (offsets).
Criticisms
The
Kyoto mechanism is the only internationally agreed mechanism for
regulating carbon credit activities, and crucially, includes checks for
additionality and overall effectiveness. Its supporting organisation,
the UNFCCC, is the only organisation with a global mandate on the
overall effectiveness of emission control systems, although enforcement
of decisions relies on national co-operation. The Kyoto trading period
only applies for five years between 2008 and 2012. The first phase of
the EU ETS system started before then, and is expected to continue in a
third phase afterwards, and may co-ordinate with whatever is
internationally agreed at but there is general uncertainty as to what
will be agreed in Post–Kyoto Protocol negotiations on greenhouse gas emissions.
As business investment often operates over decades, this adds risk and
uncertainty to their plans. As several countries responsible for a large
proportion of global emissions (notably USA, India, China) have avoided
mandatory caps, this also means that businesses in capped countries may
perceive themselves to be working at a competitive disadvantage against
those in uncapped countries as they are now paying for their carbon
costs directly.[citation needed]
A key concept behind the cap and trade system is that national
quotas should be chosen to represent genuine and meaningful reductions
in national output of emissions. Not only does this ensure that overall
emissions are reduced but also that the costs of emissions trading are
carried fairly across all parties to the trading system. However,
governments of capped countries may seek to unilaterally weaken their
commitments, as evidenced by the 2006 and 2007 National Allocation Plans for several countries in the EU ETS, which were submitted late and then were initially rejected by the European Commission for being too lax.[23]
A question has been raised over the grandfathering
of allowances. Countries within the EU ETS have granted their incumbent
businesses most or all of their allowances for free. This can sometimes
be perceived as a protectionist obstacle to new entrants into their
markets. There have also been accusations of power generators getting a
'windfall' profit by passing on these emissions 'charges' to their
customers.[24]
As the EU ETS moves into its second phase and joins up with Kyoto, it
seems likely that these problems will be reduced as more allowances will
be auctioned.
Some sources [25]
show that UK financial service wins a lot from Carbon credit trade
(which is designed to be profitable). The profit is evident if one check
the statistics: London has
secured dominance on the global carbon trading market, with net value
$64bn in 2007, according to the report by International Financial Services London.
London controlled about 90% of the exchange market (Carbon credit vs
money) in 2007. London-based companies made about 59% of the purchases
of Carbon credits issued by the UN. And some of the Carbon credit's system creators are from UK, for example, the economist, former Senior Vice-President of the World Bank and government economic advisor in the United Kingdom Nicholas Stern, Baron Stern of Brentford who has founded a consultancy-trading agency "The Carbon Rating Agency (CRA)" [26] on the Isle-of-Man (controlled by firm IDEAglobal Group [27] there Stern was a Vice Chairman at that time [28]) for Carbon credit evaluation and firm's rating and making money on that. [25]
Fraud allegation
In 2019, a fraud trial began. Eight men were accused of a £7m carbon credit fraud at Southwark Crown Court
in England. It was alleged that a fraud had been perpetrated on
members of the public who were persuaded to make investments, including
the purchase of carbon credits, which were 'effectively worthless'. The
trial collapsed because the judge ruled that the prosecution's expert
witness 'did not have any relevant qualifications'.[29]