Search This Blog

Wednesday, February 16, 2022

Propaganda in the United States

From Wikipedia, the free encyclopedia
 
An American propaganda poster from World War II produced under the Works Progress Administration

Propaganda in the United States is spread by both government and media entities. Propaganda is carefully curated information, ideas, or rumors deliberately spread, usually to preserve the self-interest of a nation. It is used in advertising, radio, newspaper, posters, books, television and other media. Propagandists may provide either factual or non-factual information to their audiences, often emphasizing positive features and downplaying negative ones, or vice versa, in order to shape wide scale public opinion or influence behavioral changes.

Domestic

World War I

The first large-scale use of propaganda by the U.S. government came during World War I. The government enlisted the help of citizens and children to help promote war bonds and stamps to help stimulate the economy. To keep the prices of war supplies down (guns, gunpowder, cannons, steel, etc.), the U.S. government produced posters that encouraged people to reduce waste and grow their own vegetables in "victory gardens". The public skepticism that was generated by the heavy-handed tactics of the Committee on Public Information would lead the postwar government to officially abandon the use of propaganda.

The 1915 film The German Side of the War was compiled from footage filmed by Chicago Tribune cameraman Edwin F. Weigle. It was one of the only American films to show the German perspective of the war. At the theater lines stretched around the block; the screenings were received with such enthusiasm that would-be moviegoers resorted to purchasing tickets from scalpers.

World War II

During World War II, the United States officially had no propaganda, but the Roosevelt government used means to circumvent this official line. One such propaganda tool was the publicly owned but government-funded Writers' War Board (WWB). The activities of the WWB were so extensive that it has been called the "greatest propaganda machine in history". Why We Fight is a famous series of US government propaganda films made to justify US involvement in World War II. Response to the use of propaganda in the United States was mixed, as attempts by the government to release propaganda during World War I was perceived negatively by the American public. The government did not initially use propaganda but was ultimately persuaded by businesses and media, which saw its use as informational. Cultural and racial stereotypes were used in World War II propaganda to encourage the perception of the Japanese people and government as a "ruthless and animalistic enemy that needed to be defeated", leading to many Americans seeing all Japanese people in a negative light. Many people of Japanese ancestry, most of whom were American citizens, were forcibly rounded up and placed in internment camps in the early 1940s.

From 1944 to 1948, prominent US policy makers promoted a domestic propaganda campaign aimed at convincing the U.S. public to agree to a harsh peace for the German people, for example by removing the common view of the German people and the Nazi Party as separate entities. The core of this campaign was the Writers' War Board, which was closely associated with the Roosevelt administration.

Another means was the United States Office of War Information that Roosevelt established in June 1942, whose mandate was to promote understanding of the war policies under the director Elmer Davis. It dealt with posters, press, movies, exhibitions, and produced often slanted material conforming to US wartime purposes.

Cold War

Propaganda during the Cold War was at its peak in the 1950s and 1960s in the early years of the Cold War. The United States would make propaganda that criticized and belittled the enemy, the Soviet Union. The American government dispersed propaganda through movies, television, music, literature and art. The United States officials did not call it propaganda, maintaining they were portraying accurate information about Russia and their Communist way of life during the 1950s and 1960s. The United States boycotted the 1980 Olympics held in Moscow along with Japan and West Germany, among many other nations. When the Olympics were held in Los Angeles in 1984, the Soviets did the same as the United States did to them and did not show up for the games. In terms of education, American propaganda took the form of videos children watched in school; one such video is called How to Spot a Communist.

War on Drugs

A poster circa 2000 concerning cannabis in the United States.
 

There was an abundant amount of propaganda in the time Nixon declared the war on drugs. One form of propaganda they used, and that is still used today, is the national youth anti-drug media campaign. The government used posters and ads to scare children and teenagers into avoiding drug use. Nixon initiated the first federal funded programs to begin the prevention of drugs in the U.S. Over the past 40 years, the U.S. has spent over $2.5 trillion fighting the war on drugs. The 1960s gave birth to a rebellious movement that popularized drug use. With many soldiers returning from the war with marijuana and heroin habits there was a strong demand for drugs in the U.S.

In June 1971, President Nixon declared a “war on drugs.” He dramatically increased the presence of federal drug control agencies, and pushed through measures such as mandatory sentencing and no-knock warrants. The Drug Enforcement Administration (DEA) was created in 1973 to tackle drug use and the smuggling of illegal narcotics into America. The D.A.R.E. program began in 1983 to educate children on saying no to drugs. By 2003 it cost $230 million and employed 50,000 police officers, but never showed promising results in reducing illegal drug use. The National Youth Anti-Drug Media Campaign, originally established by the National Narcotics Leadership Act of 1988, but now conducted by the Office of National Drug Control Policy under the Drug-Free Media Campaign Act of 1998, is a domestic propaganda campaign designed to "influence the attitudes of the public and the news media with respect to drug abuse" and for "reducing and preventing drug abuse among young people in the United States". The Media Campaign cooperates with the Partnership for a Drug-Free America and other government and non-government organizations.

Gulf War

Shortly after Iraq's invasion of Kuwait in 1990, the organization Citizens for a Free Kuwait was formed in the US. It hired the public relations firm Hill & Knowlton for about $11 million, paid by Kuwait's government.

Among many other means of influencing US opinion, such as distributing books on Iraqi atrocities to US soldiers deployed in the region, "Free Kuwait" T-shirts and speakers to college campuses, and dozens of video news releases to television stations, the firm arranged for an appearance before a group of members of the US Congress in which a young woman identifying herself as a nurse working in the Kuwait City hospital described Iraqi soldiers pulling babies out of incubators and letting them die on the floor.

The story helped tip both the public and Congress towards a war with Iraq: six Congressmen said the testimony was enough for them to support military action against Iraq and seven Senators referenced the testimony in debate. The Senate supported the military actions in a 52–47 vote. However, a year after the war, this allegation was revealed to be a fabrication. The young woman who had testified was found to be a member of Kuwait's Royal Family and the daughter of Kuwait's ambassador to the US. She hadn't lived in Kuwait during the Iraqi invasion.

Iraq War

In early 2002, the U.S. Department of Defense launched an information operation, colloquially referred to as the Pentagon military analyst program. The goal of the operation is "to spread the administrations's talking points on Iraq by briefing retired commanders for network and cable television appearances," where they have been presented as independent analysts. On 22 May 2008, after this program was revealed in The New York Times, the House passed an amendment that would make permanent a domestic propaganda ban that until now has been enacted annually in the military authorization bill.

The Shared Values Initiative was a public relations campaign that was intended to sell a "new" America to Muslims around the world by showing that American Muslims were living happily and freely, without persecution, in post-9/11 America. Funded by the United States Department of State, the campaign created a public relations front group known as the Council of American Muslims for Understanding (CAMU). The campaign was divided in phases; the first of which consisted of five mini-documentaries for television, radio, and print with shared values messages for key Muslim countries.

Ad Council

The Ad Council, an American non-profit organization that distributes public service announcements on behalf of various private and federal government agency sponsors, has been labeled as "little more than a domestic propaganda arm of the federal government" given the Ad Council's historically close collaboration with the President of the United States and the federal government. According to the Ad Council official website they aim to make sure advertisements are not as biased and do not harm any individuals. They have a myriad of published press releases and news articles relaying around different topics in the United States. The Ad Council has a goal to change the lives of people through advertisement through various case studies and real stories. This non-profit organization continues to give public service announcements with the hope to relay information without opinion and raise awareness on issues. The Ad Council continues to distribute announcements from the White House regarding all political information and debates.

COVID-19 pandemic

In April 2020, President Donald Trump and the United States government played a campaign video for the Republican Party, which was widely regarded as a propaganda video. This video referred to a timeline of the U.S. government's response to the pandemic, only displaying favorable moments. Some commentators and analysts believed that this was to protect President Donald Trump and his government's reputation, especially before the country's 2020 presidential election. Supporters maintained this was to combat widespread media criticism stating that he failed to act quickly enough to stop the spread of COVID-19.

1776 Commission

The 1776 Commission was an advisory committee established in September 2020 by President Donald Trump to support what he called "patriotic education". The Commission, which included no historians specializing in United States History, released The 1776 Report on January 18, 2021. Historians criticized the report as "filled with errors and partisan politics", with some describing it as political propaganda.

International

Through several international broadcasting operations, the US disseminates American cultural information, official positions on international affairs, and daily summaries of international news. These operations fall under the International Broadcasting Bureau, the successor of the United States Information Agency, established in 1953. IBB's operations include Voice of America, Radio Liberty, Alhurra and other programs. They broadcast mainly to countries where the United States finds that information about international events is limited, either due to poor infrastructure or government censorship. The Smith-Mundt Act prohibits the Voice of America from disseminating information to US citizens that were produced specifically for a foreign audience.

During the Cold War, the United States ran covert propaganda campaigns in countries that appeared likely to become Soviet satellites, such as Italy, Afghanistan, and Chile. According to the Church Committee report, US agencies ran a "massive propaganda campaign" on Chile, where over 700 news items placed in American and European media resulted from CIA activities in a six-weeks period alone.

In 2006, The Pentagon announced the creation of a new unit aimed at spreading propaganda about supposedly "inaccurate" stories being spread about the Iraq War. These "inaccuracies" have been blamed on the enemy trying to decrease support for the war. Donald Rumsfeld has been quoted as saying these stories are something that keeps him up at night.

Psychological operations

US PSYOP pamphlet disseminated in Iraq. Text: "This is your future al-Zarqawi" and shows al-Qaeda fighter al-Zarqawi caught in a rat trap.
 

The US military defines psychological operations, or PSYOP, as:

planned operations to convey selected information and indicators to foreign audiences to influence the emotions, motives, objective reasoning, and ultimately the behavior of foreign governments, organizations, groups, and individuals.

Some argue that the Smith-Mundt Act, adopted in 1948, explicitly forbids information and psychological operations aimed at the US public. However, Emma Briant points out that this is a common confusion: the Smith-Mundt Act only ever applied to the State Department, not the Department of Defense and military PSYOP, which are governed by Article 10 of the US Code. Nevertheless, the current easy access to news and information from around the globe, makes it difficult to guarantee PSYOP programs do not reach the US public. Or, in the words of Army Col. James A. Treadwell, who commanded the U.S. military psyops unit in Iraq in 2003, in The Washington Post:

There's always going to be a certain amount of bleed-over with the global information environment.

Agence France Presse reported on U.S. propaganda campaigns that:

The Pentagon acknowledged in a newly declassified document that the US public is increasingly exposed to propaganda disseminated overseas in psychological operations.

Former US Defense Secretary Donald Rumsfeld approved the document referred to, which is titled "Information Operations Roadmap." The document acknowledges restrictions on targeting domestic audience, but fails to offer any way of limiting the effect PSYOP programs have on domestic audiences. A recent book by Emma L. Briant brings this up to date, detailing the big changes in practice following 9/11 and especially after the Iraq War as US defense adapted to a more fluid media environment and brought in new internet policies.

Several incidents in 2003 were documented by Sam Gardiner, a retired Air Force colonel, which he saw as information-warfare campaigns that were intended for "foreign populations and the American public." Truth from These Podia, as the treatise was called, reported that the way the Iraq War was fought resembled a political campaign, stressing the message instead of the truth.

Growth of photovoltaics

From Wikipedia, the free encyclopedia
 
Recent and estimated capacity (GWp)
Year-end 2016 2017 2018 2019 2020 2021E 2022F
Cumulative 306.5 403.3 512 630 774 957 1185
Annual new 76.8 99 109 118 144 183 228
Cumulative
growth
32% 32% 27% 24% 23% 24% 24%
Installed PV in watts per capita

Worldwid PV capacity in watts per capita by country in 2013.

   none or unknown
   0.1–10 watts
   10–100 watts
   100–200 watts
   200–400 watts
   400–600 watts
History of cumulative PV capacity worldwide

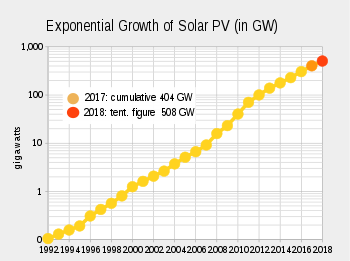
Exponential growth-curve on a semi-log scale, show a straight line since 1992

Grid parity for solar PV around the world

Grid parity for solar PV systems around the world

  reached before 2014
  reached after 2014
  only for peak prices
  predicted U.S. states

Added PV capacity by country in 2019 (by percent of world total, clustered by region)

  China (39.16%)
  Vietnam (9.23%)
  Japan (4.35%)
  South Korea (2.08%)
  India (3.29%)
  Australia (3.48%)
  United States (11.72%)
  Brazil (2.60%)
  Germany (3.76%)
  Netherlands (2.49%)
  Spain (2.24%)
  Poland (1.90%)
  Rest of Europe (6.22%)
  Rest of the World (7.56%)

Worldwide growth of photovoltaics has been close to exponential between 1992 and 2018. During this period of time, photovoltaics (PV), also known as solar PV, evolved from a niche market of small-scale applications to a mainstream electricity source.

When solar PV systems were first recognized as a promising renewable energy technology, subsidy programs, such as feed-in tariffs, were implemented by a number of governments in order to provide economic incentives for investments. For several years, growth was mainly driven by Japan and pioneering European countries. As a consequence, cost of solar declined significantly due to experience curve effects like improvements in technology and economies of scale. Several national programs were instrumental in increasing PV deployment, such as the Energiewende in Germany, the Million Solar Roofs project in the United States, and China's 2011 five-year-plan for energy production. Since then, deployment of photovoltaics has gained momentum on a worldwide scale, increasingly competing with conventional energy sources. In the early 21st century a market for utility-scale plants emerged to complement rooftop and other distributed applications. By 2015, some 30 countries had reached grid parity.

Since the 1950s, when the first solar cells were commercially manufactured, there has been a succession of countries leading the world as the largest producer of electricity from solar photovoltaics. First it was the United States, then Japan, followed by Germany, and currently China.

By the end of 2018, global cumulative installed PV capacity reached about 512 gigawatts (GW), of which about 180 GW (35%) were utility-scale plants. Solar power supplied about 3% of global electricity demand in 2019. In 2018, solar PV contributed between 7% and 8% to the annual domestic consumption in Italy, Greece, Germany, and Chile. The largest penetration of solar power in electricity production is found in Honduras (14%). Solar PV contribution to electricity in Australia is edging towards 11%, while in the United Kingdom and Spain it is close to 4%. China and India moved above the world average of 2.55%, while, in descending order, the United States, South Korea, France and South Africa are below the world's average.

Projections for photovoltaic growth are difficult and burdened with many uncertainties. Official agencies, such as the International Energy Agency (IEA) have consistently increased their estimates for decades, while still falling far short of projecting actual deployment in every forecast. Bloomberg NEF projects global solar installations to grow in 2019, adding another 125–141 GW resulting in a total capacity of 637–653 GW by the end of the year. By 2050, the IEA foresees solar PV to reach 4.7 terawatts (4,674 GW) in its high-renewable scenario, of which more than half will be deployed in China and India, making solar power the world's largest source of electricity.

Solar PV nameplate capacity

Nameplate capacity denotes the peak power output of power stations in unit watt prefixed as convenient, to e.g. kilowatt (kW), megawatt (MW) and gigawatt (GW). Because power output for variable renewable sources is unpredictable, a source's average generation is generally significantly lower than the nameplate capacity. In order to have an estimate of the average power output, the capacity can be multiplied by a suitable capacity factor, which takes into account varying conditions - weather, nighttime, latitude, maintenance. Worldwide, the average solar PV capacity factor is 11%. In addition, depending on context, the stated peak power may be prior to a subsequent conversion to alternating current, e.g. for a single photovoltaic panel, or include this conversion and its loss for a grid connected photovoltaic power station.

Wind power has different characteristics, e.g. a higher capacity factor and about four times the 2015 electricity production of solar power. Compared with wind power, photovoltaic power production correlates well with power consumption for air-conditioning in warm countries. As of 2017 a handful of utilities have started combining PV installations with battery banks, thus obtaining several hours of dispatchable generation to help mitigate problems associated with the duck curve after sunset.

Current status

Worldwide

In 2017, photovoltaic capacity increased by 95 GW, with a 29% growth year-on-year of new installations. Cumulative installed capacity exceeded 401 GW by the end of the year, sufficient to supply 2.1 percent of the world's total electricity consumption.

Regions

As of 2018, Asia was the fastest growing region, with almost 75% of global installations. China alone accounted for more than half of worldwide deployment in 2017. In terms of cumulative capacity, Asia was the most developed region with more than half of the global total of 401 GW in 2017. Europe continued to decline as a percentage of the global PV market. In 2017, Europe represented 28% of global capacity, the Americas 19% and Middle East 2%. However with respect to per capita installation the European Union has more than twice the capacity compared to China and 25% more than the US.

Solar PV covered 3.5% and 7% of European electricity demand and peak electricity demand, respectively in 2014.

Countries and territories

Worldwide growth of photovoltaics is extremely dynamic and varies strongly by country. The top installers of 2019 were China, the United States, and India. There are 37 countries around the world with a cumulative PV capacity of more than one gigawatt. The available solar PV capacity in Honduras is sufficient to supply 14.8% of the nation's electrical power while 8 countries can produce between 7% and 9% of their respective domestic electricity consumption.

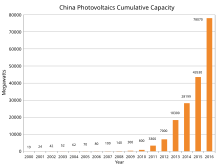
PV capacity growth in China
 
Growth of PV in Europe 1992-2014

History of leading countries

The United States was the leader of installed photovoltaics for many years, and its total capacity was 77 megawatts in 1996, more than any other country in the world at the time. From the late 1990s, Japan was the world's leader of solar electricity production until 2005, when Germany took the lead and by 2016 had a capacity of over 40 gigawatts. In 2015, China surpassed Germany to become the world's largest producer of photovoltaic power, and in 2017 became the first country to surpass 100 GW of installed capacity.

United States (1954–1996)

The United States, where modern solar PV was invented, led installed capacity for many years. Based on preceding work by Swedish and German engineers, the American engineer Russell Ohl at Bell Labs patented the first modern solar cell in 1946. It was also there at Bell Labs where the first practical c-silicon cell was developed in 1954. Hoffman Electronics, the leading manufacturer of silicon solar cells in the 1950s and 1960s, improved on the cell's efficiency, produced solar radios, and equipped Vanguard I, the first solar powered satellite launched into orbit in 1958.

In 1977 US-President Jimmy Carter installed solar hot water panels on the White House (later removed by President Reagan) promoting solar energy and the National Renewable Energy Laboratory, originally named Solar Energy Research Institute was established at Golden, Colorado. In the 1980s and early 1990s, most photovoltaic modules were used in stand-alone power systems or powered consumer products such as watches, calculators and toys, but from around 1995, industry efforts have focused increasingly on developing grid-connected rooftop PV systems and power stations. By 1996, solar PV capacity in the US amounted to 77 megawatts–more than any other country in the world at the time. Then, Japan moved ahead.

Japan (1997–2004)

Japan took the lead as the world's largest producer of PV electricity, after the city of Kobe was hit by the Great Hanshin earthquake in 1995. Kobe experienced severe power outages in the aftermath of the earthquake, and PV systems were then considered as a temporary supplier of power during such events, as the disruption of the electric grid paralyzed the entire infrastructure, including gas stations that depended on electricity to pump gasoline. Moreover, in December of that same year, an accident occurred at the multibillion-dollar experimental Monju Nuclear Power Plant. A sodium leak caused a major fire and forced a shutdown (classified as INES 1). There was massive public outrage when it was revealed that the semigovernmental agency in charge of Monju had tried to cover up the extent of the accident and resulting damage. Japan remained world leader in photovoltaics until 2004, when its capacity amounted to 1,132 megawatts. Then, focus on PV deployment shifted to Europe.

Germany (2005–2014)

In 2005, Germany took the lead from Japan. With the introduction of the Renewable Energy Act in 2000, feed-in tariffs were adopted as a policy mechanism. This policy established that renewables have priority on the grid, and that a fixed price must be paid for the produced electricity over a 20-year period, providing a guaranteed return on investment irrespective of actual market prices. As a consequence, a high level of investment security lead to a soaring number of new photovoltaic installations that peaked in 2011, while investment costs in renewable technologies were brought down considerably. In 2016 Germany's installed PV capacity was over the 40 GW mark.

China (2015–present)

China surpassed Germany's capacity by the end of 2015, becoming the world's largest producer of photovoltaic power. China's rapid PV growth continued in 2016 – with 34.2 GW of solar photovoltaics installed. The quickly lowering feed in tariff rates at the end of 2015 motivated many developers to secure tariff rates before mid-year 2016 – as they were anticipating further cuts (correctly so). During the course of the year, China announced its goal of installing 100 GW during the next Chinese Five Year Economic Plan (2016–2020). China expected to spend ¥1 trillion ($145B) on solar construction during that period. Much of China's PV capacity was built in the relatively less populated west of the country whereas the main centres of power consumption were in the east (such as Shanghai and Beijing). Due to lack of adequate power transmission lines to carry the power from the solar power plants, China had to curtail its PV generated power.

History of market development

Prices and costs (1977–present)

Swanson's law – the PV learning curve
 
Price decline of c-Si solar cells
 
Type of cell or module Price per Watt
Multi-Si Cell (≥18.6%) $0.071
Mono-Si Cell (≥20.0%) $0.090
G1 Mono-Si Cell (>21.7%) $0.099
M6 Mono-Si Cell (>21.7%) $0.100
275W - 280W (60P) Module $0.176
325W - 330W (72P) Module $0.188
305W - 310W Module $0.240
315W - 320W Module $0.190
>325W - >385W Module $0.200
Source: EnergyTrend, price quotes, average prices, 13 July 2020 

The average price per watt dropped drastically for solar cells in the decades leading up to 2017. While in 1977 prices for crystalline silicon cells were about $77 per watt, average spot prices in August 2018 were as low as $0.13 per watt or nearly 600 times less than forty years ago. Prices for thin-film solar cells and for c-Si solar panels were around $.60 per watt. Module and cell prices declined even further after 2014 (see price quotes in table).

This price trend was seen as evidence supporting Swanson's law (an observation similar to the famous Moore's Law) that states that the per-watt cost of solar cells and panels fall by 20 percent for every doubling of cumulative photovoltaic production. A 2015 study showed price/kWh dropping by 10% per year since 1980, and predicted that solar could contribute 20% of total electricity consumption by 2030.

In its 2014 edition of the Technology Roadmap: Solar Photovoltaic Energy report, the International Energy Agency (IEA) published prices for residential, commercial and utility-scale PV systems for eight major markets as of 2013 (see table below). However, DOE's SunShot Initiative report states lower prices than the IEA report, although both reports were published at the same time and referred to the same period. After 2014 prices fell further. For 2014, the SunShot Initiative modeled U.S. system prices to be in the range of $1.80 to $3.29 per watt. Other sources identified similar price ranges of $1.70 to $3.50 for the different market segments in the U.S. In the highly penetrated German market, prices for residential and small commercial rooftop systems of up to 100 kW declined to $1.36 per watt (€1.24/W) by the end of 2014. In 2015, Deutsche Bank estimated costs for small residential rooftop systems in the U.S. around $2.90 per watt. Costs for utility-scale systems in China and India were estimated as low as $1.00 per watt.

Typical PV system prices in 2013 in selected countries (USD)
USD/W Australia China France Germany Italy Japan United Kingdom United States
 Residential 1.8 1.5 4.1 2.4 2.8 4.2 2.8 4.91
 Commercial 1.7 1.4 2.7 1.8 1.9 3.6 2.4 4.51
 Utility-scale 2.0 1.4 2.2 1.4 1.5 2.9 1.9 3.31
Source: IEA – Technology Roadmap: Solar Photovoltaic Energy report, September 2014'
1U.S figures are lower in DOE's Photovoltaic System Pricing Trends

According to the International Renewable Energy Agency, a "sustained, dramatic decline" in utility-scale solar PV electricity cost driven by lower solar PV module and system costs continued in 2018, with global weighted average levelized cost of energy of solar PV falling to US$0.085 per kilowatt-hour, or 13% lower than projects commissioned the previous year, resulting in a decline from 2010 to 2018 of 77%.

Technologies (1990–present)

Market-share of PV technologies since 1990

There were significant advances in conventional crystalline silicon (c-Si) technology in the years leading up to 2017. The falling cost of the polysilicon since 2009, that followed after a period of severe shortage (see below) of silicon feedstock, pressure increased on manufacturers of commercial thin-film PV technologies, including amorphous thin-film silicon (a-Si), cadmium telluride (CdTe), and copper indium gallium diselenide (CIGS), led to the bankruptcy of several thin-film companies that had once been highly touted. The sector faced price competition from Chinese crystalline silicon cell and module manufacturers, and some companies together with their patents were sold below cost.

Global PV market by technology in 2013.

  CdTe (5.1%)
  a-Si (2.0%)
  CIGS (2.0%)
  mono-Si (36.0%)
  multi-Si (54.9%)

In 2013 thin-film technologies accounted for about 9 percent of worldwide deployment, while 91 percent was held by crystalline silicon (mono-Si and multi-Si). With 5 percent of the overall market, CdTe held more than half of the thin-film market, leaving 2 percent to each CIGS and amorphous silicon.

Copper indium gallium selenide (CIGS) is the name of the semiconductor material on which the technology is based. One of the largest producers of CIGS photovoltaics in 2015 was the Japanese company Solar Frontier with a manufacturing capacity in the gigawatt-scale. Their CIS line technology included modules with conversion efficiencies of over 15%. The company profited from the booming Japanese market and attempted to expand its international business. However, several prominent manufacturers could not keep up with the advances in conventional crystalline silicon technology. The company Solyndra ceased all business activity and filed for Chapter 11 bankruptcy in 2011, and Nanosolar, also a CIGS manufacturer, closed its doors in 2013. Although both companies produced CIGS solar cells, it has been pointed out, that the failure was not due to the technology but rather because of the companies themselves, using a flawed architecture, such as, for example, Solyndra's cylindrical substrates.
The U.S.-company First Solar, a leading manufacturer of CdTe, built several of the world's largest solar power stations, such as the Desert Sunlight Solar Farm and Topaz Solar Farm, both in the Californian desert with 550 MW capacity each, as well as the 102 MWAC Nyngan Solar Plant in Australia (the largest PV power station in the Southern Hemisphere at the time) commissioned in mid-2015. The company was reported in 2013 to be successfully producing CdTe-panels with a steadily increasing efficiency and declining cost per watt. CdTe was the lowest energy payback time of all mass-produced PV technologies, and could be as short as eight months in favorable locations. The company Abound Solar, also a manufacturer of cadmium telluride modules, went bankrupt in 2012.
In 2012, ECD solar, once one of the world's leading manufacturer of amorphous silicon (a-Si) technology, filed for bankruptcy in Michigan, United States. Swiss OC Oerlikon divested its solar division that produced a-Si/μc-Si tandem cells to Tokyo Electron Limited. Other companies that left the amorphous silicon thin-film market include DuPont, BP, Flexcell, Inventux, Pramac, Schuco, Sencera, EPV Solar, NovaSolar (formerly OptiSolar) and Suntech Power that stopped manufacturing a-Si modules in 2010 to focus on crystalline silicon solar panels. In 2013, Suntech filed for bankruptcy in China.

Silicon shortage (2005–2008)

Polysilicon prices since 2004. As of July 2020, the ASP for polysilicon stands at $6.956/kg

In the early 2000s, prices for polysilicon, the raw material for conventional solar cells, were as low as $30 per kilogram and silicon manufacturers had no incentive to expand production.

However, there was a severe silicon shortage in 2005, when governmental programmes caused a 75% increase in the deployment of solar PV in Europe. In addition, the demand for silicon from semiconductor manufacturers was growing. Since the amount of silicon needed for semiconductors makes up a much smaller portion of production costs, semiconductor manufacturers were able to outbid solar companies for the available silicon in the market.

Initially, the incumbent polysilicon producers were slow to respond to rising demand for solar applications, because of their painful experience with over-investment in the past. Silicon prices sharply rose to about $80 per kilogram, and reached as much as $400/kg for long-term contracts and spot prices. In 2007, the constraints on silicon became so severe that the solar industry was forced to idle about a quarter of its cell and module manufacturing capacity—an estimated 777 MW of the then available production capacity. The shortage also provided silicon specialists with both the cash and an incentive to develop new technologies and several new producers entered the market. Early responses from the solar industry focused on improvements in the recycling of silicon. When this potential was exhausted, companies have been taking a harder look at alternatives to the conventional Siemens process.

As it takes about three years to build a new polysilicon plant, the shortage continued until 2008. Prices for conventional solar cells remained constant or even rose slightly during the period of silicon shortage from 2005 to 2008. This is notably seen as a "shoulder" that sticks out in the Swanson's PV-learning curve and it was feared that a prolonged shortage could delay solar power becoming competitive with conventional energy prices without subsidies.

In the meantime the solar industry lowered the number of grams-per-watt by reducing wafer thickness and kerf loss, increasing yields in each manufacturing step, reducing module loss, and raising panel efficiency. Finally, the ramp up of polysilicon production alleviated worldwide markets from the scarcity of silicon in 2009 and subsequently lead to an overcapacity with sharply declining prices in the photovoltaic industry for the following years.

Solar overcapacity (2009–2013)

As the polysilicon industry had started to build additional large production capacities during the shortage period, prices dropped as low as $15 per kilogram forcing some producers to suspend production or exit the sector. Prices for silicon stabilized around $20 per kilogram and the booming solar PV market helped to reduce the enormous global overcapacity from 2009 onwards. However, overcapacity in the PV industry continued to persist. In 2013, global record deployment of 38 GW (updated EPIA figure) was still much lower than China's annual production capacity of approximately 60 GW. Continued overcapacity was further reduced by significantly lowering solar module prices and, as a consequence, many manufacturers could no longer cover costs or remain competitive. As worldwide growth of PV deployment continued, the gap between overcapacity and global demand was expected in 2014 to close in the next few years.

IEA-PVPS published in 2014 historical data for the worldwide utilization of solar PV module production capacity that showed a slow return to normalization in manufacture in the years leading up to 2014. The utilization rate is the ratio of production capacities versus actual production output for a given year. A low of 49% was reached in 2007 and reflected the peak of the silicon shortage that idled a significant share of the module production capacity. As of 2013, the utilization rate had recovered somewhat and increased to 63%.

Anti-dumping duties (2012–present)

After anti-dumping petition were filed and investigations carried out, the United States imposed tariffs of 31 percent to 250 percent on solar products imported from China in 2012. A year later, the EU also imposed definitive anti-dumping and anti-subsidy measures on imports of solar panels from China at an average of 47.7 percent for a two-year time span.

Shortly thereafter, China, in turn, levied duties on U.S. polysilicon imports, the feedstock for the production of solar cells. In January 2014, the Chinese Ministry of Commerce set its anti-dumping tariff on U.S. polysilicon producers, such as Hemlock Semiconductor Corporation to 57%, while other major polysilicon producing companies, such as German Wacker Chemie and Korean OCI were much less affected. All this has caused much controversy between proponents and opponents and was subject of debate.

History of deployment

2016-2020 development of the Bhadla Solar Park (India), documented on Sentinel-2 satellite imagery

Deployment figures on a global, regional and nationwide scale are well documented since the early 1990s. While worldwide photovoltaic capacity grew continuously, deployment figures by country were much more dynamic, as they depended strongly on national policies. A number of organizations release comprehensive reports on PV deployment on a yearly basis. They include annual and cumulative deployed PV capacity, typically given in watt-peak, a break-down by markets, as well as in-depth analysis and forecasts about future trends.

Timeline of the largest PV power stations in the world
Year(a) Name of PV power station Country Capacity
MW
1982 Lugo United States 1
1985 Carrisa Plain United States 5.6
2005 Bavaria Solarpark (Mühlhausen) Germany 6.3
2006 Erlasee Solar Park Germany 11.4
2008 Olmedilla Photovoltaic Park Spain 60
2010 Sarnia Photovoltaic Power Plant Canada 97
2011 Huanghe Hydropower Golmud Solar Park China 200
2012 Agua Caliente Solar Project United States 290
2014 Topaz Solar Farm(b) United States 550
2015 Longyangxia Dam Solar Park China 850
2016 Tengger Desert Solar Park China 1547
2019 Pavagada Solar Park India 2050
2020 Bhadla Solar Park India 2245
Also see list of photovoltaic power stations and list of noteworthy solar parks
(a) year of final commissioning (b) capacity given in  MWAC otherwise in MWDC

Worldwide annual deployment

Due to the exponential nature of PV deployment, most of the overall capacity has been installed in the years leading up to 2017 (see pie-chart). Since the 1990s, each year has been a record-breaking year in terms of newly installed PV capacity, except for 2012. Contrary to some earlier predictions, early 2017 forecasts were that 85 gigawatts would be installed in 2017. Near end-of-year figures however raised estimates to 95 GW for 2017-installations.

Worldwide cumulative

Worldwide cumulative PV capacity on a semi log chart since 1992

Worldwide growth of solar PV capacity was an exponential curve between 1992 and 2017. Tables below show global cumulative nominal capacity by the end of each year in megawatts, and the year-to-year increase in percent. In 2014, global capacity was expected to grow by 33 percent from 139 to 185 GW. This corresponded to an exponential growth rate of 29 percent or about 2.4 years for current worldwide PV capacity to double. Exponential growth rate: P(t) = P0ert, where P0 is 139 GW, growth-rate r 0.29 (results in doubling time t of 2.4 years).

Deployment by country

See section Forecast for projected photovoltaic deployment in 2017
Grid parity for solar PV systems around the world
  Reached grid-parity before 2014
  Reached grid-parity after 2014
  Reached grid-parity only for peak prices
  U.S. states poised to reach grid-parity
Source: Deutsche Bank, as of February 2015

Population ecology

From Wikipedia, the free encyclopedia
 
Map of population trends of native and invasive species of jellyfish
  Increase (high certainty)
  Increase (low certainty)
  Stable/variable
  Decrease
  No data

Population ecology is a sub-field of ecology that deals with the dynamics of species populations and how these populations interact with the environment, such as birth and death rates, and by immigration and emigration.

The discipline is important in conservation biology, especially in the development of population viability analysis which makes it possible to predict the long-term probability of a species persisting in a given patch of habitat. Although population ecology is a subfield of biology, it provides interesting problems for mathematicians and statisticians who work in population dynamics.

History

In the 1940s ecology was divided into autecology—the study of individual species in relation to the environment—and synecology—the study of groups of species in relation to the environment. The term autecology (from Ancient Greek: αὐτο, aúto, "self"; οίκος, oíkos, "household"; and λόγος, lógos, "knowledge"), refers to roughly the same field of study as concepts such as life cycles and behaviour as adaptations to the environment by individual organisms. Eugene Odum, writing in 1953, considered that synecology should be divided into population ecology, community ecology and ecosystem ecology, renaming autecology as 'species ecology' (Odum regarded "autecology" as an archaic term), thus that there were four subdivisions of ecology.

Terminology

A population is defined as a group of interacting organisms of the same species. A demographic structure of a population is how populations are often quantified. The total number of individuals in a population is defined as a population size, and how dense these individuals are is defined as population density. There is also a population’s geographic range, which has limits that a species can tolerate (such as temperature).

Population size can be influenced by the per capita population growth rate (rate at which the population size changes per individual in the population.) Births, deaths, emigration, and immigration rates all play a significant role in growth rate. The maximum per capita growth rate for a population is known as the intrinsic rate of increase.

In a population, carrying capacity is known as the maximum population size of the species that the environment can sustain, which is determined by resources available. In many classic population models, r is represented as the intrinsic growth rate, where K is the carrying capacity, and N0 is the initial population size.

Terms used to describe natural groups of individuals in ecological studies
Term Definition
Species population All individuals of a species.
Metapopulation A set of spatially disjunct populations, among which there is some migration.
Population A group of conspecific individuals that is demographically, genetically, or spatially disjunct from other groups of individuals.
Aggregation A spatially clustered group of individuals.
Deme A group of individuals more genetically similar to each other than to other individuals, usually with some degree of spatial isolation as well.
Local population A group of individuals within an investigator-delimited area smaller than the geographic range of the species and often within a population (as defined above). A local population could be a disjunct population as well.
Subpopulation An arbitrary spatially delimited subset of individuals from within a population (as defined above).
Immigration The number of individuals that join a population over time.
Emigration The number of individuals that leave a population over time.

Population dynamics

The development of population ecology owes much to the mathematical models known as population dynamics, which were originally formulae derived from demography at the end of the 18th and beginning of 19th century.

The beginning of population dynamics is widely regarded as the work of Malthus, formulated as the Malthusian growth model. According to Malthus, assuming that the conditions (the environment) remain constant (ceteris paribus), a population will grow (or decline) exponentially. This principle provided the basis for the subsequent predictive theories, such as the demographic studies such as the work of Benjamin Gompertz and Pierre François Verhulst in the early 19th century, who refined and adjusted the Malthusian demographic model.

A more general model formulation was proposed by F. J. Richards in 1959, further expanded by Simon Hopkins, in which the models of Gompertz, Verhulst and also Ludwig von Bertalanffy are covered as special cases of the general formulation. The Lotka–Volterra predator-prey equations are another famous example, as well as the alternative Arditi–Ginzburg equations.

Exponential vs. Logistic Growth

When describing growth models, there are two types of models that can be used: exponential and logistic.

When the per capita rate of increase takes the same positive value regardless of population size, then it shows exponential growth.

When the per capita rate of increase decreases as the population increases towards a maximum limit, then the graph shows logistic growth.

Fisheries and wildlife management

In fisheries and wildlife management, population is affected by three dynamic rate functions.

  • Natality or birth rate, often recruitment, which means reaching a certain size or reproductive stage. Usually refers to the age a fish can be caught and counted in nets.
  • Population growth rate, which measures the growth of individuals in size and length. More important in fisheries, where population is often measured in biomass.
  • Mortality, which includes harvest mortality and natural mortality. Natural mortality includes non-human predation, disease and old age.

If N1 is the number of individuals at time 1 then

where N0 is the number of individuals at time 0, B is the number of individuals born, D the number that died, I the number that immigrated, and E the number that emigrated between time 0 and time 1.

If we measure these rates over many time intervals, we can determine how a population's density changes over time. Immigration and emigration are present, but are usually not measured.

All of these are measured to determine the harvestable surplus, which is the number of individuals that can be harvested from a population without affecting long-term population stability or average population size. The harvest within the harvestable surplus is termed "compensatory" mortality, where the harvest deaths are substituted for the deaths that would have occurred naturally. Harvest above that level is termed "additive" mortality, because it adds to the number of deaths that would have occurred naturally. These terms are not necessarily judged as "good" and "bad," respectively, in population management. For example, a fish & game agency might aim to reduce the size of a deer population through additive mortality. Bucks might be targeted to increase buck competition, or does might be targeted to reduce reproduction and thus overall population size.

For the management of many fish and other wildlife populations, the goal is often to achieve the largest possible long-run sustainable harvest, also known as maximum sustainable yield (or MSY). Given a population dynamic model, such as any of the ones above, it is possible to calculate the population size that produces the largest harvestable surplus at equilibrium. While the use of population dynamic models along with statistics and optimization to set harvest limits for fish and game is controversial among some scientists, it has been shown to be more effective than the use of human judgment in computer experiments where both incorrect models and natural resource management students competed to maximize yield in two hypothetical fisheries. To give an example of a non-intuitive result, fisheries produce more fish when there is a nearby refuge from human predation in the form of a nature reserve, resulting in higher catches than if the whole area was open to fishing.

r/K selection

At its most elementary level, interspecific competition involves two species utilizing a similar resource. It rapidly gets more complicated, but stripping the phenomenon of all its complications, this is the basic principle: two consumers consuming the same resource.

An important concept in population ecology is the r/K selection theory. For example, if an animal has the choice of producing one or a few offspring, or to put a lot of effort or little effort in offspring -- these are all examples of trade-offs. In order for species to thrive, they must choose what is best for them, leading to a clear distinction between r and K selected species.

The first variable is r (the intrinsic rate of natural increase in population size, density independent) and the second variable is K (the carrying capacity of a population, density dependent). An r-selected species (e.g., many kinds of insects, such as aphids) is one that has high rates of fecundity, low levels of parental investment in the young, and high rates of mortality before individuals reach maturity. Evolution favors productivity in r-selected species.

In contrast, a K-selected species (such as humans) has low rates of fecundity, high levels of parental investment in the young, and low rates of mortality as individuals mature. Evolution in K-selected species favors efficiency in the conversion of more resources into fewer offspring. K-selected species generally experience stronger competition, where populations generally live near carrying capacity. These species have heavy investment in offspring, resulting in longer lived organisms, and longer period of maturation. Offspring of K-selected species generally have a higher probability of survival, due to heavy parental care and nurturing.

Top-Down and Bottom-Up Controls

Top-Down Controls

In some populations, organisms in lower trophic levels are controlled by organisms at the top. This is known as top-down control.

For example, the presence of top carnivores keep herbivore populations in check. If there were no top carnivores in the ecosystem, then herbivore populations would rapidly increase, leading to all plants being eaten. This ecosystem would eventually collapse.

Bottom-Up Controls

Bottom-up controls, on the other hand, are driven by producers in the ecosystem. If plant populations change, then the population of all species would be impacted.

For example, if plant populations decreased significantly, the herbivore populations would decrease, which would lead to a carnivore population decreasing too. Therefore, if all of the plants disappeared, then the ecosystem would collapse. Another example would be if there were too many plants available, then two herbivore populations may compete for the same food. The competition would lead to an eventual removal of one population.

Do all ecosystems have to be either top-down or bottom-up?

An ecosystem does not have to be either top-down or bottom-up. There are occasions where an ecosystem could be bottom-up sometimes, such as a marine ecosystem, but then have periods of top-down control due to fishing.

Survivorship curves

Survivorship curves show the distribution of populations according to age. Survivorship curves are important to be able to compare generations, populations, or even different species.

Humans and most other mammals have a type I survivorship because death occurs in older years. Typically, Type I survivorship curves characterize K-selected species.

Type II survivorship shows that death at any age is equally probable.

Type III curves indicate few surviving the younger years, but after a certain age, individuals are much more likely to survive. Type III survivorship typically characterizes r-selected species.

Metapopulation

Populations are also studied and conceptualized through the "metapopulation" concept. The metapopulation concept was introduced in 1969:

"as a population of populations which go extinct locally and recolonize."

Metapopulation ecology is a simplified model of the landscape into patches of varying levels of quality. Patches are either occupied or they are not. Migrants moving among the patches are structured into metapopulations either as sources or sinks. Source patches are productive sites that generate a seasonal supply of migrants to other patch locations. Sink patches are unproductive sites that only receive migrants. In metapopulation terminology there are emigrants (individuals that leave a patch) and immigrants (individuals that move into a patch). Metapopulation models examine patch dynamics over time to answer questions about spatial and demographic ecology. An important concept in metapopulation ecology is the rescue effect, where small patches of lower quality (i.e., sinks) are maintained by a seasonal influx of new immigrants. Metapopulation structure evolves from year to year, where some patches are sinks, such as dry years, and become sources when conditions are more favorable. Ecologists utilize a mixture of computer models and field studies to explain metapopulation structure.

Journals

The first journal publication of the Society of Population Ecology, titled Population Ecology (originally called Researches on Population Ecology) was released in 1952.

Scientific articles on population ecology can also be found in the Journal of Animal Ecology, Oikos and other journals.

Mandatory Palestine

From Wikipedia, the free encyclopedia https://en.wikipedia.org/wiki/Mandatory_Palestine   Palestine 1920–...